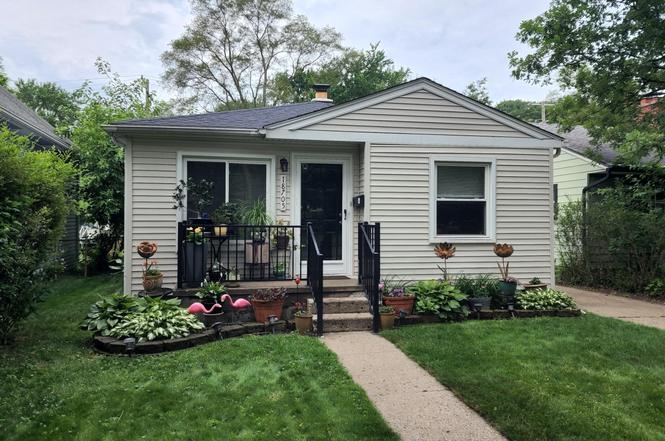
18705 Delaware Ave · Livonia, MI
Flood risk 1/10 · Minimal
- FEMA flood zone
- X (unshaded)
- Chance of flooding over 30 yrs
- 0.0%
- Est. flood insurance / yr
- $507 – $1,088
Fire risk 1/10 · Minimal
- Est. fire insurance / yr
- $784 – $1,456
Heat risk 3/10 · Minor
- Hot days now (above 98°F)
- 7 days/yr
- Hot days in 30 yrs
- 15 days/yr
Wind risk 2/10 · Minimal
- Chance of severe wind over 30 yrs
- —
Air-quality risk 3/10 · Minor
- Unhealthy air days now
- 2 days/yr
- Unhealthy air days in 30 yrs
- 3 days/yr
Risk factors via First Street. Map © Google.
Why this score? — see what drove the C- grade
The composite is a weighted blend of 9 inputs, each scored 0–100. Each bar is that input's sub-score; the figure is the points it added to the 100-point composite (weight × sub-score).
- Cash flow +21.7/30.0
- DSCR +6.9/10.0
- ARV discount +6.3/15.0
- 1% rule +5.2/10.0
- Livability +3.9/5.0
- Rent growth +2.5/5.0
- Condition / age +2.5/5.0
- Schools +1.4/10.0
- Appreciation +0.0/10.0
$149,900
🖨 Deal sheet (PDF) 📄 Offer letter ✓ Due diligence
Listing remarks MLS
Charming 2BR/1BA single-family home in a beautiful Redford Twp. Bright living area, functional kitchen, and cozy bedroom. Yard offers great potential for gardening, entertaining, or relaxing. A rare opportunity for first-time buyers, downsizers, or anyone seeking a low-maintenance home in a desirable location
Key facts
- Functional kitchen
- Single family home
- Desirable location
Tags
Neighborhood map
What this means for you Summary
Snapshot
- This is a 2-bed/1.0-bath single-family listed at $150k.
Deal economics
- At list price, monthly cash flow is $229 ($3k/yr) — positive.
- The deal already cash-flows at list — no discount required.
- Meets the 1% rule at list price ($2k rent vs $150k).
- Recommended offer: $141k (6.0% below list) — sets the bar for market timing.
- Cap rate 8.1% vs local median 4.9% in Livonia — top-decile yield for the area; either an underpriced asset or a hidden risk that comps aren't pricing in. Stress-test before assuming the spread holds.
Location & tenants
- Location reads 77/100 on livability (#116 in MI, #2,784 nationally) — a middle-class / working-renter tenant base. Strengths: employment A+, cost of living A+, housing A+; Watch: amenities D, health & safety D, commute F.
- Redford Union Schools District No. 1 (suburban): math 8% / reading 23% proficiency, ranked #489 of 540 in MI (top 91%) — low school quality limits family demand, transient renter base, plan for 1-2y turnover; 66% free/reduced lunch — lower-income household profile, screen leases tightly.
- Zoned schools: Beech Elementary (math 2% / reading 17%, grade F, #1,277 of 1,397 statewide, top 93%, 453 students, 83% FRL); Hilbert Middle School (math 8% / reading 25%, grade F, #446 of 493 statewide, top 90%, 398 students, 75% FRL); Redford Union High School (math 15% / reading 34%, grade F, #476 of 713 statewide, top 67%, 736 students, 70% FRL).
- Market conditions: 90 active listings in the ZIP; 19 comparable units currently listed for rent nearby; rentals at typical pace (median 27d on market — plan ~3-4 weeks tenant-placement turnaround); 2,639 units permitted in Wayne County in 2024 (1,216 in 5+ unit buildings).
Forward outlook
- Local home prices are declining (-3.0%/yr); year-one equity from $1k of loan paydown is wiped out by about $4k of value loss. Plan a longer hold.
- Wayne County population projected at -17% by 2050 — secular population decline; favor cash flow + early exit over multi-decade hold.
Negotiation context
- It's been on market 65 days — a 6% lower offer ($141k) is reasonable based on typical stale-listing flexibility.
- 6 sale attempts since 24y ago with the ask held roughly flat each time — persistent listings suggest the price (not the market) is what's stuck; bring a comps-based counter.
- Current owner paid $57k; list at $150k implies a 163% gain — meaningful room to come down on a strong offer.
Risks & watch-outs
- Watch-outs: built in 1954 — expect roof / HVAC / electrical / plumbing capex.
Questions for the listing agent
- It's been on market 65 days. Have you received any prior offers? Is the seller open to a 6% concession, seller financing, or rate buy-down credit?
- Built in 1954 — when were the roof, HVAC, electrical panel, plumbing, and water heater last replaced?
- Why hasn't it sold? Are there any deal-killer items the seller is aware of (foundation, flood, title, zoning, code violations)?
- Is there a deadline driving the sale (1031 exchange, divorce, estate, relocation)? That informs how much negotiation room exists.
- Schools are B-rated — typically a magnet for longer-tenancy family renters. What's the average tenant stay here, and is there a school-zone premium baked into asking?
- What's the average days-on-market for RENTAL listings here right now (not sales)? A rising rental-DOM trend means longer vacancies and softer asking-rent achievability than the comps imply.
- What's the recent tenant-quality profile in this submarket — average credit score on applications, eviction rate, late-payment / NSF rate, and stable-employment percentage? A property-management company in the area should have these aggregated.
- How much new for-sale + rental construction is in the pipeline within 1–3 miles? Heavy new supply typically softens prices + rents 12–24 months out; constrained supply supports both.
Investment metrics
- 1% rule
- 1.02% ✓
- Cap rate
- 8.13%
- Cash-on-cash
- 6.56%
- DSCR
- 1.29
- GRM
- 8.2
CMA / ARV
- ARV (on-the-fly)
- $146,097
- Comps found
- 12
Show comp detail 12 sales within ~0.75 mi
| Address | Dist | Beds/Ba | Sqft | Sold | Price | $/sf | Match |
|---|---|---|---|---|---|---|---|
| 18705 Delaware Ave | 0.00mi | 2/1.0 | 773 (0%) | 0mo | $140,000 | $181 | 100 |
| 18714 Gaylord | 0.03mi | 2/1.0 | 693 (-10%) | 2mo | $165,000 | $238 | 80 |
| 19357 Centralia | 0.55mi | 3/1.0 (+1) | 788 (+2%) | 2mo | $70,000 | $89 | 64 |
| 19498 Poinciana | 0.59mi | 2/1.0 | 800 (+4%) | 3mo | $147,500 | $184 | 64 |
| 19363 Centralia | 0.56mi | 2/1.0 | 737 (-5%) | 9mo | $143,000 | $194 | 59 |
| 19754 Negaunee | 0.62mi | 2/1.0 | 731 (-5%) | 8mo | $139,200 | $190 | 56 |
| 17606 Norborne | 0.64mi | 3/2.0 (+1) | 818 (+6%) | 1mo | $157,500 | $193 | 51 |
| 19349 Negaunee | 0.43mi | 2/1.0 | 872 (+13%) | 10mo | $127,000 | $146 | 50 |
| 18515 Sumner | 0.69mi | 2/1.0 | 860 (+11%) | 5mo | $87,000 | $101 | 44 |
| 19134 Angling St | 0.73mi | 3/1.0 (+1) | 873 (+13%) | 1mo | $165,000 | $189 | 38 |
| 19493 Negaunee | 0.57mi | 3/1.0 (+1) | 888 (+15%) | 6mo | $157,500 | $177 | 38 |
| 18531 Pershing St | 0.58mi | 3/1.0 (+1) | 880 (+14%) | 10mo | $230,000 | $261 | 37 |
Match score weights: distance 35% · size 25% · config 20% · recency 20%. Top-matched comps best support the ARV.
Projected returns pro-forma
-3.0% appreciation · 3.0% rent growth · sell at horizon
- IRR
- -6.2%
- Equity multiple
- 0.77×
- Total profit
- $-9,689
- Equity at exit
- $22,351
- IRR
- 3.4%
- Equity multiple
- 1.25×
- Total profit
- $10,332
- Equity at exit
- $12,961
Cash invested: $41,972 (down + closing). Projections, not guarantees.
Landlord ↔ Tenant lean methodology
- Overall (STATE)
- 62 Landlord-Friendly
- State Michigan
- 62 Landlord-Friendly · EVEN
- County
- — inherits STATE
- City
- — inherits STATE
ZIP-level market 48240
- Active inventory
- 90
- Price-to-rent
- 8.2×
Monthly cashflow live
- Estimated rent
- $1,531 high interval (Pro) →
- Mortgage (P&I)
- −$786
- Tax from tax record
- −$131 /mo · $1,575/yr
- Insurance
- −$62
- HOA
- −$0
- Vacancy / Maint / Mgmt
- −$321
- Net cashflow
- $229
Break-even live
Sensitivity live
| Price | -10% $314 | -5% $272 | +0% $229 | +5% $187 | +10% $145 |
|---|---|---|---|---|---|
| Rent | -10% $108 | -5% $169 | +0% $229 | +5% $290 | +10% $350 |
| Rate | -1.0pp $305 | -0.5pp $268 | base $229 | +0.5pp $191 | +1.0pp $151 |
UW: 25.0% down · 7.5% · 30yr · 1.5% tax · 5.0% vac · 8.0% maint · 8.0% mgmt
Financing live
Cash to close
- Down payment
- $37,475
- Closing costs
- $4,497
- Reserves months
- —
- Total cash needed
- —
Loan-product check · same deal, 3 products live
Conventional
25% down · 7.5% · 30yr
- Down + closing
- —
- Monthly P&I
- —
- Monthly cashflow
- —
- DSCR
- —
- Eligible?
- —
Personal DTI + credit; lowest rate.
DSCR
20% down · 8.5% · 30yr
- Down + closing
- —
- Monthly P&I
- —
- Monthly cashflow
- —
- DSCR
- —
- Eligible?
- —
No personal income docs; deal must DSCR.
Hard money
10% down · 12.0% · 12mo
- Down + closing
- —
- Monthly P&I
- —
- Monthly cashflow
- —
- DSCR
- —
- Eligible?
- —
Short-term bridge; refi at stabilization.
Rent comps 19 comps
| Address | Beds | Baths | Sqft | Rent | $/sqft | DOM | Units | Dist |
|---|---|---|---|---|---|---|---|---|
| 26539 Clarita Redford, MI | 3.0 | 1.5 | 931 | $1,875 | $2.01 | 26d | 1 | 0.04mi |
| 19354 Seminole Redford, MI | 3.0 | 1.0 | 1050 | $1,450 | $1.38 | 26d | 1 | 0.51mi |
| 18405 Gillman St Livonia, MI | 3.0 | 2.0 | 1014 | $1,950 | $1.92 | 7d | 1 | 0.88mi |
| 25822 W 6 Mile Rd Redford Township, MI | 2.0 | 2.0 | 1100 | $1,100 | $1.00 | 26d | 1 | 0.95mi |
| 20091 Inkster Rd Livonia, MI | 2.0 | 1.0 | 756 | $1,400 | $1.85 | 7d | 1 | 0.98mi |
| 20524 Indian Redford, MI | 3.0 | 1.0 | 988 | $1,600 | $1.62 | 26d | 1 | 1.06mi |
| 18732 Salem Unit 2 Detroit, MI | 2.0 | 1.0 | 925 | $1,050 | $1.14 | 14d | 1 | 1.11mi |
| 17324 Salem St Detroit, MI | 2.0 | 1.0 | 989 | $1,200 | $1.21 | 26d | 1 | 1.28mi |
| 20083 Salem St Detroit, MI | 3.0 | 1.0 | 969 | $1,050 | $1.08 | 7d | 1 | 1.37mi |
| 20083 Salem St Detroit, MI | 3.0 | 1.0 | 969 | $1,050 | $1.08 | 13d | 1 | 1.37mi |
| 20410 Five Points St Redford, MI | 3.0 | 1.0 | 950 | $1,600 | $1.68 | 7d | 1 | 1.38mi |
| 20745 Saint Francis Unit 101 Farmington Hills, MI | 2.0 | 1.0 | 900 | $1,495 | $1.66 | 45d | 1 | 1.39mi |
| 20745 Saint Francis Unit 208 Farmington Hills, MI | 2.0 | 1.0 | 900 | $1,395 | $1.55 | 17d | 1 | 1.39mi |
| 18302 Wormer St Detroit, MI | 3.0 | 1.0 | 1046 | $1,475 | $1.41 | 45d | 1 | 1.41mi |
| 24651 W McNichols Rd Detroit, MI | 1.0 | 1.0 | 700 | $800 | $1.14 | 45d | 4 | 1.41mi |
| 29200 Dardanella St Livonia, MI | 1.0–2.0 | 1.0 | 825 | $1,230 | $1.49 | 1d | 5 | 1.42mi |
| 24224 W 7 Mile Rd Detroit, MI | 1.0–2.0 | 1.0 | 600 | $875 | $1.46 | 45d | 3 | 1.44mi |
| 25304 Shiawassee Cir #105 Southfield, MI | 1.0 | 1.0 | 700 | $1,050 | $1.50 | 45d | 1 | 1.47mi |
| 25740 Shiawassee St Southfield, MI | 1.0–2.0 | 1.0 | 850 | $1,253 | $1.47 | 45d | 10 | 1.47mi |
Listing history 19 events
-
2026-04-23status Pending 310-char remark
Show marketing remark (310 chars)
Charming 2BR/1BA single-family home in a beautiful Redford Twp. Bright living area, functional kitchen, and cozy bedroom. Yard offers great potential for gardening, entertaining, or relaxing. A rare opportunity for first-time buyers, downsizers, or anyone seeking a low-maintenance home in a desirable location
-
2026-04-23status Pending
Show marketing remark (310 chars)
Charming 2BR/1BA single-family home in a beautiful Redford Twp. Bright living area, functional kitchen, and cozy bedroom. Yard offers great potential for gardening, entertaining, or relaxing. A rare opportunity for first-time buyers, downsizers, or anyone seeking a low-maintenance home in a desirable location
-
2026-02-17$149,900 Active 310-char remark
Show marketing remark (310 chars)
Charming 2BR/1BA single-family home in a beautiful Redford Twp. Bright living area, functional kitchen, and cozy bedroom. Yard offers great potential for gardening, entertaining, or relaxing. A rare opportunity for first-time buyers, downsizers, or anyone seeking a low-maintenance home in a desirable location
-
2026-02-16$149,900 Active 310-char remark
Show marketing remark (310 chars)
Charming 2BR/1BA single-family home in a beautiful Redford Twp. Bright living area, functional kitchen, and cozy bedroom. Yard offers great potential for gardening, entertaining, or relaxing. A rare opportunity for first-time buyers, downsizers, or anyone seeking a low-maintenance home in a desirable location
-
2026-02-16$149,900 Active
Show marketing remark (310 chars)
Charming 2BR/1BA single-family home in a beautiful Redford Twp. Bright living area, functional kitchen, and cozy bedroom. Yard offers great potential for gardening, entertaining, or relaxing. A rare opportunity for first-time buyers, downsizers, or anyone seeking a low-maintenance home in a desirable location
-
2018-03-06soldstatus $57,100
-
2018-03-02soldstatus $57,000 Sold
-
2018-03-02soldstatus $57,000 Closed
-
2018-01-27status Pending
-
2018-01-27status Pending
-
2018-01-19price $59,900
-
2018-01-19price $59,900
-
2017-12-05$64,900 Active
-
2017-12-05$64,900 Active
-
2003-07-02soldstatus $102,000
-
2003-04-28soldstatus $102,000
-
2002-10-30$99,900
-
1998-09-29soldstatus $60,000
ⓘ Source: listings_history table (triggers on properties + properties_extension) + one-shot
backfill from property_details.listing_events for pre-trigger history.
Tax reassessment forecast MI · Partial reset (capped growth)
- Current annual tax
- $1,575 · $131/mo
- Projected year-2 tax
- $1,942 · $162/mo
- Expected delta
- +$367/yr (+$31/mo · 23.3%)
ⓘ Screening estimate from a state-policy table — verify with the county assessor before closing.
Climate risk First Street
- Flood 1/10 Low FEMA zone X (unshaded) · 0% chance over 30 yrs
- Wildfire 1/10 Low
- Heat 3/10 Moderate 7 d/yr ≥98°F today · 15 d/yr by 30 yrs out
- Wind 2/10 Low
- Air quality 3/10 Moderate 2 unhealthy d/yr today · 3 by 30 yrs out
Nearby sold comps map
Loading sold comps map…
Walkable amenities ~0.75 mi
Loading nearby amenities…
Taxation est. · year 1
- Rental income
- $18,368
- − Mortgage interest
- −$8,397
- − Property taxes
- −$1,575
- − Insurance
- −$750
- − Repairs & maintenance
- −$1,469
- − Management
- −$1,469
- − Depreciation
- −$4,361
- Taxable income
- $347
- Est. tax owed @ 24.0%
- −$83
- After-tax cash flow
- $2,670/yr
For passive investors: Depreciation is non-cash, so a rental often shows a tax loss while cash-flowing — sheltering income. Rental losses are passive: they offset passive income freely, and up to $25,000/yr can offset ordinary (W-2) income if you actively participate and your MAGI is under $100k (phasing out to $0 by $150k); unused losses carry forward. On sale, claimed depreciation is recaptured at up to 25%, and gains may owe capital-gains tax (a 1031 exchange can defer both). Figures are a year-1 estimate at your 24.0% rate — not tax advice; consult a CPA.
Schools (NCES district)
- District
- Redford Union Schools District No. 1
- NCES district ID
- 2629460
- Math proficiency
- 8% ▼ -6.00%
- Reading proficiency
- 23% ▬ 0.00%
- Median HH income
- $49,778
- Composite
- 14.1/100
- National rank
- #9460
- State rank
- #489 of 540 in MI
Livability — Livonia
- Score
- 77/100
- State rank
- #116
- US rank
- #2784
Category grades
Schools grade is shown separately in the Schools card above.
Census & demographics
- City population
- 56,806
- Population (ZIP)
- 17,097
Population outlook (Wayne County) Hauer SSP2
- Today (2025)
- 1,675,273 people
- By 2030
- 1,620,300 · -3.3%
- By 2040
- 1,502,341 · -10.3%
- By 2050
- 1,384,039 · -17.4%
- By 2075
- 1,124,592 · -32.9%
- By 2100
- 881,193 · -47.4%
Race, ethnicity, and origin ACS 2023
- Neighborhood character
- Diverse neighborhood (Simpson 0.64)
- Race & ethnicity
- White 45% Black 40% Two or more races 10% Hispanic / Latino 6%
- Hispanic origin (detail)
- Mexican 6%
- Common ancestry
- Romanian 5% Lithuanian 3% Slovak 2%
- Foreign-born
- 4% · Canada
- Languages at home
- 93% English-only · Spanish 5% Chinese 1%
Political lean MEDSL · Wayne
- 2024 margin
- Strong D (+29.0) · D 62.7% · R 33.7% · Other 3.6%
- 2008→2024 swing
- -20.5pp toward R · 2008: 49.5pp · 2024: 29.0pp
- All cycles
- 2024: D+29.0 2020: D+38.1 2016: D+37.3 2012: D+46.9 2008: D+49.5
Not yet ingested
- Civics
- —
Market trends
- HPI YoY
- ▼ -177.98%
- Current HPI
- 236.2958
- Rent YoY
- —
- Metro
- —
- State GDP YoY
- ▲ 1.37%
- F500 in state
- 28
Industry mix (Fortune 500 HQ in MI)
| Industry | F500 HQs | Revenue |
|---|---|---|
| Automotive Parts | 3 | $48B |
|
||
| Automotive | 2 | $372B |
|
||
| Chemicals | 1 | $45B |
|
||
| Automotive Retail | 1 | $29B |
|
||
| Healthcare / Medical Devices | 1 | $23B |
|
||
| Automotive Technology | 1 | $20B |
|
||
Price history
+149.8% since first listed19 events — show timeline
- 2026-04-23 Pending — REALCOMP
- 2026-04-23 Pending — MiRealSource-MiMLS
- 2026-04-23 Pending — SW Michigan MLS
- 2026-02-17 Listed $149,900 REALCOMP
- 2026-02-16 Listed $149,900 SW Michigan MLS
- 2026-02-16 Listed $149,900 MiRealSource-MiMLS
- 2018-03-06 Sold (Public Records) $57,100 Public Records
- 2018-03-02 Sold (MLS) $57,000 MiRealSource-MiMLS
- 2018-03-02 Sold (MLS) $57,000 REALCOMP
- 2018-01-27 Pending — MiRealSource-MiMLS
- 2018-01-27 Pending — REALCOMP
- 2018-01-19 Price Changed $59,900 MiRealSource-MiMLS
- 2018-01-19 Price Changed $59,900 REALCOMP
- 2017-12-05 Listed $64,900 MiRealSource-MiMLS
- 2017-12-05 Listed $64,900 REALCOMP
- 2003-07-02 Sold (Public Records) $102,000 Public Records
- 2003-04-28 Sold (MLS) $102,000 REALCOMP
- 2002-10-30 Listed $99,900 REALCOMP
- 1998-09-29 Sold (Public Records) $60,000 Public Records
Property tax history
+3.6%/yrLatest (2025): $1,575 · -46.6% YoY. Source: county tax records.
Cash-flow waterfall
monthlySold comps — $/sqft
last 12 mo · ≤1 miLoading sold comps…