8753 Rose Ave · Atwater, CA
Flood risk 1/10 · Minimal
- FEMA flood zone
- X (unshaded)
- Chance of flooding over 30 yrs
- 0.0%
- Est. flood insurance / yr
- $507 – $1,088
Fire risk 7/10 · Major
- Est. fire insurance / yr
- $659 – $1,223
Heat risk 7/10 · Major
- Hot days now (above 104°F)
- 7 days/yr
- Hot days in 30 yrs
- 17 days/yr
Wind risk 1/10 · Minimal
- Chance of severe wind over 30 yrs
- —
Air-quality risk 10/10 · Severe
- Unhealthy air days now
- 29 days/yr
- Unhealthy air days in 30 yrs
- 35 days/yr
Risk factors via First Street. Map © Google.
Why this score? — see what drove the B- grade
The composite is a weighted blend of 9 inputs, each scored 0–100. Each bar is that input's sub-score; the figure is the points it added to the 100-point composite (weight × sub-score).
- Cash flow +30.0/30.0
- 1% rule +10.0/10.0
- DSCR +10.0/10.0
- ARV discount +7.5/15.0
- Livability +3.4/5.0
- Schools +2.8/10.0
- Rent growth +2.5/5.0
- Condition / age +2.2/5.0
- Appreciation +0.0/10.0
$99,950
🖨 Deal sheet (PDF) 📄 Offer letter ✓ Due diligence
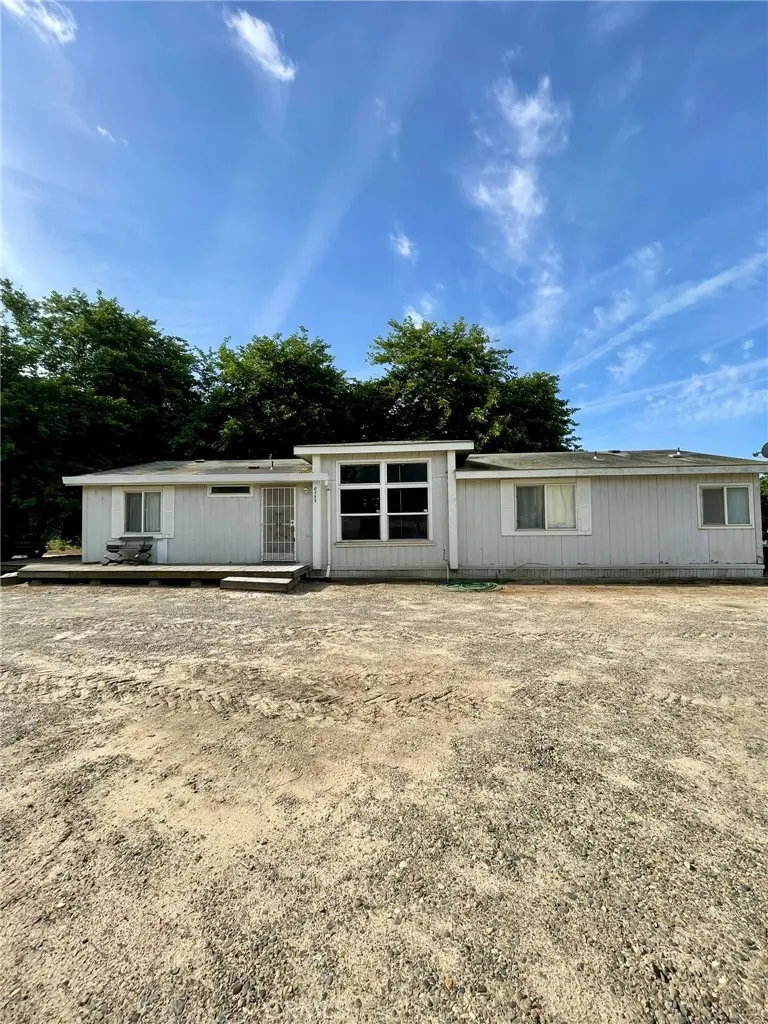
Listing remarks
Spacious 4-bedroom, 2-bathroom manufactured home offering over 1,400 sq ft of comfortable living space, built in 1990. This double-wide home (24'x 60') features an open-concept layout combining the family room and dining area ideal for both everyday living and entertaining. The kitchen includes laminate flooring, a cozy breakfast nook, gas range, hood, and dishwasher. A convenient indoor laundry room adds to the home’s functionality. The hall bathroom offers a shower-over-tub and vanity, while the primary bathroom features a separate shower, soaking tub, and vanity. The generously sized primary bedroom includes an additional sitting area, providing extra flexibility and comfort. Impor
Key facts
- 1,000 sq ft lot
- Built 1998
- Listed 44 days
Property features AI
Finance
- Other: Property contains a single unit; No common walls; Living area is estimated; No accessory dwelling unit (ADU)
- HOA & community: Rural community
Exterior
- Parking: No designated parking
- Security: Smoke detector; Carbon monoxide detector
- Utilities: Well water; Community septic; Road access via paved county road
- Home design: Manufactured home; Single-story; Entry at front of house
- Construction: Wood construction with vertical siding; No foundation details provided; Roof: see remarks; Seller-provided year built
- Exterior features: Patio (see remarks); No fencing; No pool; No landscaping
Interior
- Kitchen: Gas range and oven; Dishwasher; In-kitchen eating area; Tile countertops
- Bedrooms: Three main-level bedrooms (all bedrooms on the ground floor)
- Flooring: Tile; Carpet; Laminate
- Bathrooms: Two full bathrooms; Master bath with double sinks
- Heating & cooling: Central heating (furnace); Central cooling
- Interior features: Ceiling fan; Tile counters; Front entry; One-level home; Carbon monoxide and smoke detectors
- Laundry & utility: Laundry inside the home
Neighborhood map
What this means for you Summary
Snapshot
- This is a 4-bed/2.0-bath manufactured listed at $100k. Condition is rated fair.
Deal economics
- At list price, monthly cash flow is $895 ($11k/yr) — positive.
- The deal already cash-flows at list — no discount required.
- Meets the 1% rule at list price ($2k rent vs $100k).
- Recommended offer: $97k (3.0% below list) — sets the bar for market timing.
- Cap rate 17.0% vs local median 2.8% in Atwater — top-decile yield for the area; either an underpriced asset or a hidden risk that comps aren't pricing in. Stress-test before assuming the spread holds.
Location & tenants
- Location reads 68/100 on livability (#295 in CA) — a middle-class / working-renter tenant base. Strengths: housing A+, health & safety A+, amenities B; Watch: employment D+, schools D, crime F.
- Merced Union High (urban): math 20% / reading 46% proficiency, ranked #301 of 517 in CA (top 58%) — families likely to look elsewhere, expect single-tenant / working-renter base with shorter leases.
- Market conditions: 115 active listings in the ZIP; 459 units permitted in Merced County in 2024 (0 in 5+ unit buildings).
- This rent runs 33% of the median local income ($68k/yr) — at the standard rent-burdened threshold; future hikes will face affordability resistance.
Forward outlook
- Local home prices are declining (-3.0%/yr); year-one equity from $692 of loan paydown is wiped out by about $3k of value loss. Plan a longer hold.
- Merced County population projected at +12% by 2050 — modest demand growth; plan on rents tracking national, not racing it.
- At projected returns (-3.0% appreciation + 3.0% rent growth), your $28k cash investment doubles in ~4 years — after that, you're playing with house money.
Negotiation context
- It's been on market 44 days — a 3% lower offer ($97k) is reasonable based on typical stale-listing flexibility.
Risks & watch-outs
- Climate carrying-cost: major wildfire risk; extreme-heat days projected 7→17/yr by 2055 (HVAC capex compounding) — expect insurance premiums to compound above CPI over the hold.
Questions for the listing agent
- It's been on market 44 days. Have you received any prior offers? Is the seller open to a 3% concession, seller financing, or rate buy-down credit?
- Have any recent inspections been done? Can we get a copy of the seller's disclosures and any deferred-maintenance estimates?
- Is there a deadline driving the sale (1031 exchange, divorce, estate, relocation)? That informs how much negotiation room exists.
- Schools are D-rated, which usually means shorter tenancies and higher turnover. Who's the typical renter profile here, and what's been the actual vacancy rate?
- Crime grade is F in this area — have there been break-ins, vandalism, or insurance claims at this property in the last 3 years? What carrier currently insures it and at what premium?
- What's the average days-on-market for RENTAL listings here right now (not sales)? A rising rental-DOM trend means longer vacancies and softer asking-rent achievability than the comps imply.
- What's the recent tenant-quality profile in this submarket — average credit score on applications, eviction rate, late-payment / NSF rate, and stable-employment percentage? A property-management company in the area should have these aggregated.
- How much new for-sale + rental construction is in the pipeline within 1–3 miles? Heavy new supply typically softens prices + rents 12–24 months out; constrained supply supports both.
Investment metrics
- 1% rule
- 1.90% ✓
- Cap rate
- 17.04%
- Cash-on-cash
- 38.39%
- DSCR
- 2.71
- GRM
- 4.4
CMA / ARV
No comps found within radius.
Projected returns pro-forma
-3.0% appreciation · 3.0% rent growth · sell at horizon
- IRR
- 34.5%
- Equity multiple
- 2.46×
- Total profit
- $40,806
- Equity at exit
- $14,903
- IRR
- 41.3%
- Equity multiple
- 4.89×
- Total profit
- $108,864
- Equity at exit
- $8,642
Cash invested: $27,986 (down + closing). Projections, not guarantees.
Landlord ↔ Tenant lean methodology
- Overall (STATE)
- 18 Strongly Tenant-Friendly
- State California
- 18 Strongly Tenant-Friendly · D+13
- County
- — inherits STATE
- City
- — inherits STATE
ZIP-level market 95301
- Active inventory
- 115
- Price-to-rent
- 4.4×
Monthly cashflow live
- Estimated rent
- $1,898 medium interval (Pro) →
- Mortgage (P&I)
- −$524
- Tax from tax record
- −$38 /mo · $458/yr
- Insurance
- −$42
- HOA
- −$0
- Vacancy / Maint / Mgmt
- −$399
- Net cashflow
- $895
Break-even live
Sensitivity live
| Price | -10% $952 | -5% $924 | +0% $895 | +5% $867 | +10% $839 |
|---|---|---|---|---|---|
| Rent | -10% $745 | -5% $820 | +0% $895 | +5% $970 | +10% $1,045 |
| Rate | -1.0pp $946 | -0.5pp $921 | base $895 | +0.5pp $869 | +1.0pp $843 |
UW: 25.0% down · 7.5% · 30yr · 1.5% tax · 5.0% vac · 8.0% maint · 8.0% mgmt
Financing live
Cash to close
- Down payment
- $24,988
- Closing costs
- $2,998
- Reserves months
- —
- Total cash needed
- —
Loan-product check · same deal, 3 products live
Conventional
25% down · 7.5% · 30yr
- Down + closing
- —
- Monthly P&I
- —
- Monthly cashflow
- —
- DSCR
- —
- Eligible?
- —
Personal DTI + credit; lowest rate.
DSCR
20% down · 8.5% · 30yr
- Down + closing
- —
- Monthly P&I
- —
- Monthly cashflow
- —
- DSCR
- —
- Eligible?
- —
No personal income docs; deal must DSCR.
Hard money
10% down · 12.0% · 12mo
- Down + closing
- —
- Monthly P&I
- —
- Monthly cashflow
- —
- DSCR
- —
- Eligible?
- —
Short-term bridge; refi at stabilization.
Listing history 16 events
-
2026-06-18days on market $99,950 Active 44 DOM
-
2026-06-17days on market $99,950 Active 43 DOM
-
2026-06-16days on market $99,950 Active 42 DOM
-
2026-06-15days on market $99,950 Active 41 DOM
-
2026-06-14days on market $99,950 Active 39 DOM
-
2026-06-13days on market $99,950 Active 38 DOM
-
2026-06-10days on market $99,950 Active 36 DOM
-
2026-06-09days on market $99,950 Active 35 DOM
-
2026-06-08days on market $99,950 Active 34 DOM
-
2026-06-07days on market $99,950 Active 33 DOM
-
2026-06-03days on market $99,950 Active 29 DOM
-
2026-06-02days on market $99,950 Active 28 DOM
-
2026-06-01days on market $99,950 Active 27 DOM
-
2026-05-31days on market $99,950 Active 26 DOM
-
2026-05-30days on market $99,950 Active 25 DOM
-
2026-05-05$99,950 Active
ⓘ Source: listings_history table (triggers on properties + properties_extension) + one-shot
backfill from property_details.listing_events for pre-trigger history.
Tax reassessment forecast CA · Resets to sale price
- Current annual tax
- $458 · $38/mo
- Projected year-2 tax
- $760 · $63/mo
- Expected delta
- +$302/yr (+$25/mo · 65.9%)
ⓘ Screening estimate from a state-policy table — verify with the county assessor before closing.
Climate risk First Street
- Flood 1/10 Low FEMA zone X (unshaded) · 0% chance over 30 yrs
- Wildfire 7/10 Severe
- Heat 7/10 Severe 7 d/yr ≥104°F today · 17 d/yr by 30 yrs out
- Wind 1/10 Low
- Air quality 10/10 Extreme 29 unhealthy d/yr today · 35 by 30 yrs out
Nearby sold comps map
Loading sold comps map…
Walkable amenities ~0.75 mi
Loading nearby amenities…
Taxation est. · year 1
- Rental income
- $22,775
- − Mortgage interest
- −$5,599
- − Property taxes
- −$458
- − Insurance
- −$500
- − Repairs & maintenance
- −$1,822
- − Management
- −$1,822
- − Depreciation
- −$2,908
- Taxable income
- $9,667
- Est. tax owed @ 24.0%
- −$2,320
- After-tax cash flow
- $8,425/yr
For passive investors: Depreciation is non-cash, so a rental often shows a tax loss while cash-flowing — sheltering income. Rental losses are passive: they offset passive income freely, and up to $25,000/yr can offset ordinary (W-2) income if you actively participate and your MAGI is under $100k (phasing out to $0 by $150k); unused losses carry forward. On sale, claimed depreciation is recaptured at up to 25%, and gains may owe capital-gains tax (a 1031 exchange can defer both). Figures are a year-1 estimate at your 24.0% rate — not tax advice; consult a CPA.
Condition & rehab AI · 12 photos
This 1990 manufactured home requires moderate repairs and maintenance to improve its condition and value. Updates to the interior walls, ceiling fans, and kitchen cabinets would significantly enhance its resale and rental value.
Repairs flagged
- Minor Kitchen cabinets — Worn cabinet hardware
- Minor Primary bedroom carpet — Visible wear
- Minor Bathroom vanity — Visible wear
Value-add opportunities
- Both Paint interior walls — Enhances curb appeal and interior aesthetics
- Both Replace ceiling fans — Improves air circulation and reduces energy consumption
- Both Replace worn kitchen cabinets — Updates kitchen and improves functionality
- Both Replace worn primary bedroom carpet — Enhances comfort and appearance
- Both Replace worn bathroom vanity — Enhances bathroom functionality and appearance
Renovation cost estimate screening
| Repair item | Severity | Est. cost |
|---|---|---|
| Kitchen cabinets · Worn cabinet hardware | Minor | $500–3,000 |
| Primary bedroom carpet · Visible wear | Minor | $500–3,000 |
| Bathroom vanity · Visible wear | Minor | $500–3,000 |
| Total estimated repair cost · 3 items | $1,500–9,000 |
Value-add ROI direction
- Both Paint interior walls — Enhances curb appeal and interior aesthetics ↑
- Both Replace ceiling fans — Improves air circulation and reduces energy consumption ↑
- Both Replace worn kitchen cabinets — Updates kitchen and improves functionality ↑
- Both Replace worn primary bedroom carpet — Enhances comfort and appearance ↑
- Both Replace worn bathroom vanity — Enhances bathroom functionality and appearance ↑
ⓘ Cost ranges are severity-bucket heuristics (US national rule-of-thumb). Get contractor quotes + a written scope before underwriting a rehab budget.
Schools (NCES district)
- District
- Merced Union High
- NCES district ID
- 0624660
- Math proficiency
- 20% ▲ 3.00%
- Reading proficiency
- 46% ▼ -1.00%
- Median HH income
- $44,977
- Composite
- 28.11/100
- National rank
- #6823
- State rank
- #301 of 517 in CA
Livability — Atwater
- Score
- 68/100
- State rank
- #295
- US rank
- #9893
Category grades
Schools grade is shown separately in the Schools card above.
Census & demographics
- County
- Merced County · 205,386 people
- City population
- 43,009
- Metro
- Merced, CA
- Population (ZIP)
- 43,009
- Household income
- $68,349
- Rent vs Own
- Severe rent burden
- 1477.0
Population outlook (Merced County) Hauer SSP2
- Today (2025)
- 285,501 people
- By 2030
- 293,437 · +2.8%
- By 2040
- 308,808 · +8.2%
- By 2050
- 321,011 · +12.4%
- By 2075
- 338,497 · +18.6%
- By 2100
- 330,493 · +15.8%
Race, ethnicity, and origin ACS 2023
- Neighborhood character
- Diverse neighborhood (Simpson 0.61)
- Race & ethnicity
- Hispanic / Latino 53% White 33% Two or more races 11% Asian 6% Black 4% Native American 1%
- Hispanic origin (detail)
- Mexican 50%
- Common ancestry
- Russian 7% Slovak 1% Iranian 1%
- Foreign-born
- 21% · Canada
- Languages at home
- 56% English-only · Spanish 37% Other Indo-European 3% Other Asian/Pacific 2%
Political lean MEDSL · Merced
- 2024 margin
- Toss-up / Even · D 46.5% · R 50.9% · Other 2.6%
- 2008→2024 swing
- -12.7pp toward R · 2008: 8.3pp · 2024: -4.4pp
- All cycles
- 2024: R+4.4 2020: D+10.6 2016: D+7.9 2012: D+5.4 2008: D+8.3
Not yet ingested
- Civics
- —
Market trends
- HPI YoY
- ▼ -365.43%
- Current HPI
- 281.52
- Rent YoY
- —
- Metro
- Merced, CA
- State GDP YoY
- ▲ 3.21%
- F500 in state
- 116
Industry mix (Fortune 500 HQ in CA)
| Industry | F500 HQs | Revenue |
|---|---|---|
| Technology | 27 | $1,492B |
|
||
| Financial Services | 3 | $174B |
|
||
| Retail | 3 | $44B |
|
||
| Insurance | 3 | $26B |
|
||
| Media / Entertainment | 2 | $115B |
|
||
| Pharmaceuticals / Biotech | 2 | $62B |
|
||
Price history
1 event — show timeline
- 2026-05-05 Listed $99,950 CRMLS
Cash-flow waterfall
monthlySold comps — $/sqft
last 12 mo · ≤1 miLoading sold comps…