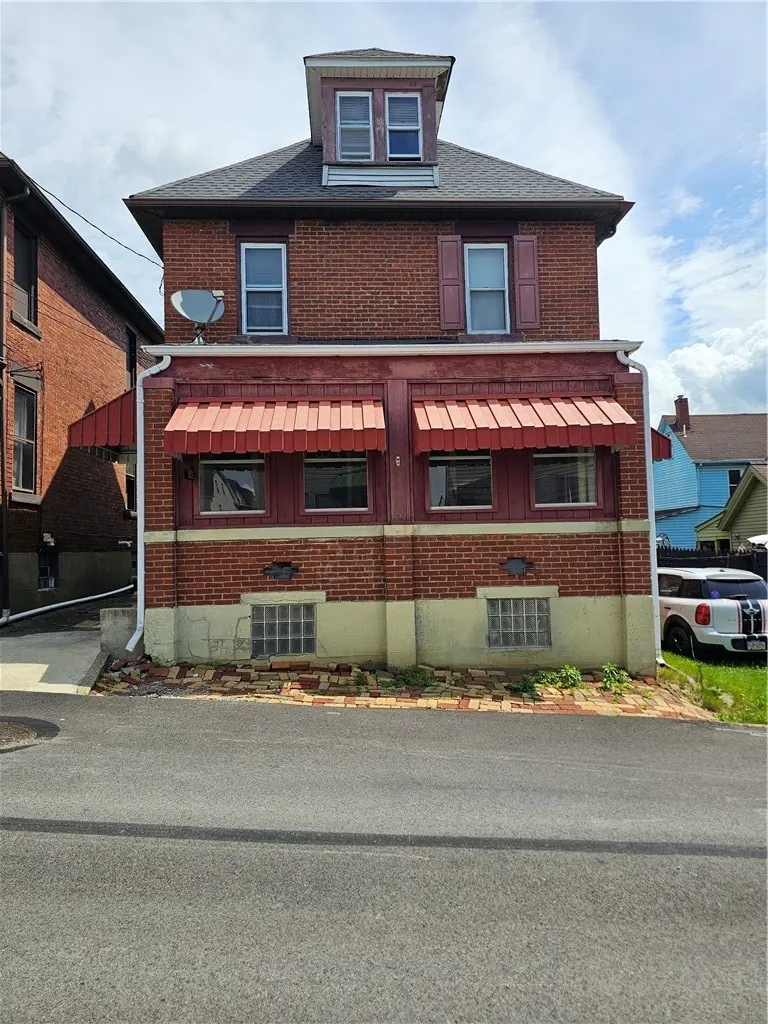
924 Summit St · Tarentum, PA
Flood risk 1/10 · Minimal
- FEMA flood zone
- X (unshaded)
- Chance of flooding over 30 yrs
- 0.0%
- Est. flood insurance / yr
- $473 – $860
Fire risk 1/10 · Minimal
- Est. fire insurance / yr
- $511 – $949
Heat risk 4/10 · Minor
- Hot days now (above 97°F)
- 8 days/yr
- Hot days in 30 yrs
- 19 days/yr
Wind risk 2/10 · Minimal
- Chance of severe wind over 30 yrs
- 0.0%
Air-quality risk 4/10 · Minor
- Unhealthy air days now
- 5 days/yr
- Unhealthy air days in 30 yrs
- 6 days/yr
Risk factors via First Street. Map © Google.
Why this score? — see what drove the A- grade
The composite is a weighted blend of 9 inputs, each scored 0–100. Each bar is that input's sub-score; the figure is the points it added to the 100-point composite (weight × sub-score).
- Cash flow +30.0/30.0
- ARV discount +15.0/15.0
- DSCR +10.0/10.0
- 1% rule +8.6/10.0
- Appreciation +5.2/10.0
- Livability +4.0/5.0
- Schools +3.3/10.0
- Rent growth +2.5/5.0
- Condition / age +2.5/5.0
$99,000
🖨 Deal sheet 📄 Offer letter ✓ Due diligence
Listing remarks
Welcome to 924 Summit Street! As you enter, you are greeted with a great enclosed front porch with lots of natural light! The large entry way leads to the living and dining room along with kitchen and walk in pantry. Upstairs are 3 bedrooms and a full bath with walk in shower. On the 3rd finished floor you have another bedroom or can be used as you please! The large basement can be transformed any way you choose. The back covered porch leads to the fully fenced in yard with shed. This home is located close to route 28 for a short commute to the city, also nearby shopping, parks, the river and much more! With some of your own touches and TLC this home can be the perfect one for you!
Key facts
- Back covered porch
- Fully fenced in yard
- Walk in pantry
Tags
Property features AI
Exterior
- Parking: On-street parking
- Utilities: Public water service; Public sewer service
- Home design: 3-story building; Resale property
- Construction: Aluminum siding; Brick exterior; Asphalt roof
- Exterior features: Public water; Public sewer
Interior
- Flooring: Carpet; Vinyl
- Bathrooms: 1 full bathroom
- Heating & cooling: Gas heating; Central air conditioning
- Interior features: Full walk-out basement; Carpet flooring; Vinyl flooring
Neighborhood map
What this means for you Summary
Snapshot
- This is a 3-bed/1.0-bath single-family listed at $99k.
Deal economics
- At list price, monthly cash flow is $386 ($5k/yr) — positive.
- The deal already cash-flows at list — no discount required.
- Meets the 1% rule at list price ($1k rent vs $99k).
- Recommended offer: $98k (1.5% below list) — sets the bar for market timing.
Location & tenants
- Location reads 79/100 on livability (#240 in PA, #2,066 nationally) — a middle-class / working-renter tenant base. Strengths: commute A+, cost of living A+, housing A+; Watch: schools C-, amenities F, employment F.
- Highlands SD (suburban): math 29% / reading 48% proficiency, ranked #376 of 539 in PA (top 70%) — families likely to look elsewhere, expect single-tenant / working-renter base with shorter leases.
- Market conditions: 39 active listings in the ZIP; 8 comparable units currently listed for rent nearby; rentals at typical pace (median 15d on market — plan ~3-4 weeks tenant-placement turnaround); 2,996 units permitted in Allegheny County in 2024 (1,588 in 5+ unit buildings).
Forward outlook
- In year one you build about $1k of equity ($684 loan paydown + $449 appreciation (0.5% local appreciation)).
- At projected returns (0.5% appreciation + 3.0% rent growth), your $28k cash investment doubles in ~5 years — after that, you're playing with house money.
Negotiation context
- It's been on market 22 days — a 2% lower offer ($98k) is reasonable based on typical stale-listing flexibility.
- Current owner paid $38k; list at $99k implies a 161% gain — meaningful room to come down on a strong offer.
Risks & watch-outs
- Watch-outs: built in 1920 — expect roof / HVAC / electrical / plumbing capex.
Questions for the listing agent
- Built in 1920 — when were the roof, HVAC, electrical panel, plumbing, and water heater last replaced?
- Is there a deadline driving the sale (1031 exchange, divorce, estate, relocation)? That informs how much negotiation room exists.
- What's the average days-on-market for RENTAL listings here right now (not sales)? A rising rental-DOM trend means longer vacancies and softer asking-rent achievability than the comps imply.
- What's the recent tenant-quality profile in this submarket — average credit score on applications, eviction rate, late-payment / NSF rate, and stable-employment percentage? A property-management company in the area should have these aggregated.
- How much new for-sale + rental construction is in the pipeline within 1–3 miles? Heavy new supply typically softens prices + rents 12–24 months out; constrained supply supports both.
Investment metrics
- 1% rule
- 1.36% ✓
- Cap rate
- 10.97%
- Cash-on-cash
- 16.71%
- DSCR
- 1.74
- GRM
- 6.1
CMA / ARV
- ARV (on-the-fly)
- $140,802
- Comps found
- 12
Show comp detail 12 sales within ~0.75 mi
| Address | Dist | Beds/Ba | Sqft | Sold | Price | $/sf | Match |
|---|---|---|---|---|---|---|---|
| 524 Roup St | 0.08mi | 3/2.0 | 1,440 (-5%) | 2mo | $183,000 | $127 | 83 |
| 1126 Highland St | 0.15mi | 3/1.5 | 1,440 (-5%) | 7mo | $206,500 | $143 | 77 |
| 473 E 7th | 0.19mi | 3/2.0 | 1,417 (-6%) | 4mo | $115,000 | $81 | 73 |
| 721 Morgan St | 0.52mi | 3/1.0 | 1,560 (+3%) | 2mo | $44,900 | $29 | 69 |
| 439 E 7th Ave | 0.19mi | 4/1.5 (+1) | 1,648 (+9%) | 4mo | $26,000 | $16 | 65 |
| 109 E 10th Ave | 0.47mi | 4/1.5 (+1) | 1,536 (+2%) | 4mo | $115,000 | $75 | 65 |
| 1066 Roup Ave | 0.69mi | 3/2.0 | 1,515 (+0%) | 3mo | $148,000 | $98 | 61 |
| 1317 Pitcairn St | 0.59mi | 3/3.0 | 1,554 (+3%) | 4mo | $160,000 | $103 | 56 |
| 616 E 3rd Ave | 0.34mi | 3/2.0 | 1,694 (+12%) | 7mo | $125,000 | $74 | 55 |
| 218 W 10th Ave | 0.73mi | 3/1.0 | 1,598 (+6%) | 4mo | $162,500 | $102 | 53 |
| 108 W 8th Ave | 0.62mi | 3/1.0 | 1,312 (-13%) | 6mo | $85,750 | $65 | 44 |
| 135 E First Ave | 0.56mi | 2/1.5 (-1) | 1,292 (-15%) | 4mo | $120,000 | $93 | 39 |
Match score weights: distance 35% · size 25% · config 20% · recency 20%. Top-matched comps best support the ARV.
Projected returns pro-forma
0.45% appreciation · 3.0% rent growth · sell at horizon
- IRR
- 17.4%
- Equity multiple
- 1.86×
- Total profit
- $23,838
- Equity at exit
- $31,013
- IRR
- 21.3%
- Equity multiple
- 3.45×
- Total profit
- $67,922
- Equity at exit
- $39,139
Cash invested: $27,720 (down + closing). Projections, not guarantees.
Landlord ↔ Tenant lean methodology
- Overall (STATE)
- 62 Landlord-Friendly
- State Pennsylvania
- 62 Landlord-Friendly · EVEN
- County
- — inherits STATE
- City
- — inherits STATE
ZIP-level market 15084
- Home prices YoY
- 0.2%
- Active inventory
- 39
- Price-to-rent
- 6.1×
Monthly cashflow live
- Estimated rent
- $1,342 high interval (Pro) →
- Mortgage (P&I)
- −$519
- Tax from tax record
- −$114 /mo · $1,367/yr
- Insurance
- −$41
- HOA
- −$0
- Vacancy / Maint / Mgmt
- −$282
- Net cashflow
- $386
Break-even live
UW: 25.0% down · 7.5% · 30yr · 1.5% tax · 5.0% vac · 8.0% maint · 8.0% mgmt
Financing live
Cash to close
- Down payment
- $24,750
- Closing costs
- $2,970
- Reserves months
- —
- Total cash needed
- —
Loan-product check · same deal, 3 products live
Conventional
25% down · 7.5% · 30yr
- Down + closing
- —
- Monthly P&I
- —
- Monthly cashflow
- —
- DSCR
- —
- Eligible?
- —
Personal DTI + credit; lowest rate.
DSCR
20% down · 8.5% · 30yr
- Down + closing
- —
- Monthly P&I
- —
- Monthly cashflow
- —
- DSCR
- —
- Eligible?
- —
No personal income docs; deal must DSCR.
Hard money
10% down · 12.0% · 12mo
- Down + closing
- —
- Monthly P&I
- —
- Monthly cashflow
- —
- DSCR
- —
- Eligible?
- —
Short-term bridge; refi at stabilization.
Rent comps 8 comps
| Address | Beds | Baths | Sqft | Rent | $/sqft | DOM | Units | Dist |
|---|---|---|---|---|---|---|---|---|
| 875 1st Ave Brackenridge, PA | 3.0 | 2.0 | 1440 | $1,399 | $0.97 | 15d | 1 | 0.60mi |
| 1067 Cleveland Ave Brackenridge, PA | 3.0 | 1.0 | 1096 | $1,500 | $1.37 | 44d | 1 | 0.68mi |
| 1067 Cleveland Ave Brackenridge, PA | 3.0 | 1.0 | 1096 | $1,350 | $1.23 | 2d | 1 | 0.68mi |
| 1079 9th Ave Brackenridge, PA | 2.0 | 1.0 | 1352 | $1,095 | $0.81 | 2d | 1 | 0.71mi |
| 1210 Minnesota Ave Natrona Heights, PA | 3.0 | 1.0 | 1224 | $1,980 | $1.62 | 2d | 1 | 0.90mi |
| 424 W 7th Ave Unit 1 Tarentum, PA | 2.0 | 1.0 | 1632 | $1,000 | $0.61 | 44d | 1 | 1.01mi |
| 424 W 7th Ave Unit 2 Tarentum, PA | 3.0 | 1.0 | 1632 | $1,250 | $0.77 | 44d | 1 | 1.01mi |
| 300 Craigdell Rd New Kensington, PA | 3.0 | 2.0 | 1300 | $1,130 | $0.87 | 2d | 1 | 1.47mi |
Listing history 18 events
-
2026-06-18days on market $99,000 Active 22 DOM
-
2026-06-17days on market $99,000 Active 21 DOM
-
2026-06-16days on market $99,000 Active 20 DOM
-
2026-06-15days on market $99,000 Active 19 DOM
-
2026-06-13days on market $99,000 Active 17 DOM
-
2026-06-13days on market $99,000 Active 16 DOM
-
2026-06-10price $99,000 Active 13 DOM
-
2026-06-09days on market $104,900 Active 13 DOM
-
2026-06-08days on market $104,900 Active 12 DOM
-
2026-06-07days on market $104,900 Active 11 DOM
-
2026-06-05days on market $104,900 Active 8 DOM
-
2026-06-03days on market $104,900 Active 7 DOM
-
2026-06-02days on market $104,900 Active 6 DOM
-
2026-06-01days on market $104,900 Active 5 DOM
-
2026-05-31days on market $104,900 Active 4 DOM
-
2026-05-27$104,900 Active
-
2011-12-06soldstatus $38,000
-
1976-05-27soldstatus $11,000
ⓘ Source: listings_history table (triggers on properties + properties_extension) + one-shot
backfill from property_details.listing_events for pre-trigger history.
Tax reassessment forecast PA · Partial reset (capped growth)
- Current annual tax
- $1,367 · $114/mo
- Projected year-2 tax
- $1,465 · $122/mo
- Expected delta
- +$99/yr (+$8/mo · 7.2%)
ⓘ Screening estimate from a state-policy table — verify with the county assessor before closing.
Climate risk First Street
- Flood 1/10 Low FEMA zone X (unshaded) · 0% chance over 30 yrs
- Wildfire 1/10 Low
- Heat 4/10 Moderate 8 d/yr ≥97°F today · 19 d/yr by 30 yrs out
- Wind 2/10 Low 0% chance of damaging wind over 30 yrs
- Air quality 4/10 Moderate 5 unhealthy d/yr today · 6 by 30 yrs out
Nearby sold comps map
Loading sold comps map…
Walkable amenities ~0.75 mi
Loading nearby amenities…
Taxation est. · year 1
- Rental income
- $16,107
- − Mortgage interest
- −$5,546
- − Property taxes
- −$1,367
- − Insurance
- −$495
- − Repairs & maintenance
- −$1,289
- − Management
- −$1,289
- − Depreciation
- −$2,880
- Taxable income
- $3,243
- Est. tax owed @ 24.0%
- −$778
- After-tax cash flow
- $3,855/yr
For passive investors: Depreciation is non-cash, so a rental often shows a tax loss while cash-flowing — sheltering income. Rental losses are passive: they offset passive income freely, and up to $25,000/yr can offset ordinary (W-2) income if you actively participate and your MAGI is under $100k (phasing out to $0 by $150k); unused losses carry forward. On sale, claimed depreciation is recaptured at up to 25%, and gains may owe capital-gains tax (a 1031 exchange can defer both). Figures are a year-1 estimate at your 24.0% rate — not tax advice; consult a CPA.
Schools (NCES district)
- District
- Highlands SD
- NCES district ID
- 4211880
- Math proficiency
- 29% ▼ -9.00%
- Reading proficiency
- 48% ▼ -9.00%
- Median HH income
- $43,730
- Composite
- 32.58/100
- National rank
- #5679
- State rank
- #376 of 539 in PA
Livability — Tarentum
- Score
- 79/100
- State rank
- #240
- US rank
- #2066
Category grades
Schools grade is shown separately in the Schools card above.
Census & demographics
- Census place
- Tarentum, PA
- Population (ZIP)
- 9,884
Population outlook (Allegheny County) Hauer SSP2
- Today (2025)
- 1,250,282 people
- By 2030
- 1,256,482 · +0.5%
- By 2040
- 1,256,318 · +0.5%
- By 2050
- 1,244,169 · -0.5%
- By 2075
- 1,197,693 · -4.2%
- By 2100
- 1,093,187 · -12.6%
Race, ethnicity, and origin ACS 2023
- Neighborhood character
- Predominantly White (92%)
- Race & ethnicity
- White 92% Two or more races 4% Black 3% Hispanic / Latino 1%
- Common ancestry
- Romanian 14% Lithuanian 2% Serbian 2%
- Foreign-born
- 1%
- Languages at home
- 98% English-only · French/Haitian/Cajun 1%
Political lean MEDSL · Allegheny
- 2024 margin
- Strong D (+20.3) · D 59.7% · R 39.4%
- 2008→2024 swing
- +4.8pp toward D · 2008: 15.5pp · 2024: 20.3pp
- All cycles
- 2024: D+20.3 2020: D+20.4 2016: D+16.4 2012: D+14.4 2008: D+15.5
Not yet ingested
- Civics
- —
Market trends
- HPI YoY
- ▲ 0.45%
- Current HPI
- 230.7532
- Rent YoY
- —
- Metro
- —
- State GDP YoY
- ▲ 1.68%
- F500 in state
- 34
Industry mix (Fortune 500 HQ in PA)
| Industry | F500 HQs | Revenue |
|---|---|---|
| Healthcare | 2 | $309B |
|
||
| Insurance | 2 | $27B |
|
||
| Telecommunications / Media | 1 | $124B |
|
||
| Industrial Distribution | 1 | $22B |
|
||
| Financial Services | 1 | $20B |
|
||
| Chemicals / Materials | 1 | $18B |
|
||
Price history
+853.6% since first listed3 events — show timeline
- 2026-05-27 Listed $104,900 West Penn MLS
- 2011-12-06 Sold (Public Records) $38,000 Public Records
- 1976-05-27 Sold (Public Records) $11,000 Public Records
Property tax history
+0.1%/yrLatest (2026): $1,367 · -1.3% YoY. Source: county tax records.
Cash-flow waterfall
monthlySold comps — $/sqft
last 12 mo · ≤1 miLoading sold comps…