13736 Alabama Dr · Eagle, MI
Flood risk 1/10 · Minimal
- FEMA flood zone
- X (unshaded)
- Chance of flooding over 30 yrs
- 0.0%
- Est. flood insurance / yr
- $473 – $860
Fire risk 1/10 · Minimal
- Est. fire insurance / yr
- $784 – $1,456
Heat risk 2/10 · Minimal
- Hot days now (above 98°F)
- 7 days/yr
- Hot days in 30 yrs
- 15 days/yr
Wind risk 2/10 · Minimal
- Chance of severe wind over 30 yrs
- —
Air-quality risk 2/10 · Minimal
- Unhealthy air days now
- 1 days/yr
- Unhealthy air days in 30 yrs
- 2 days/yr
Risk factors via First Street. Map © Google.
Why this score? — see what drove the B grade
The composite is a weighted blend of 9 inputs, each scored 0–100. Each bar is that input's sub-score; the figure is the points it added to the 100-point composite (weight × sub-score).
- Cash flow +30.0/30.0
- 1% rule +10.0/10.0
- DSCR +10.0/10.0
- ARV discount +7.5/15.0
- Condition / age +3.8/5.0
- Schools +3.6/10.0
- Livability +3.2/5.0
- Rent growth +2.5/5.0
- Appreciation +0.0/10.0
$80,499
🖨 Deal sheet 📄 Offer letter ✓ Due diligence
Listing remarks
What?s better than an apartment? Renting a home at Capital Crossings, a family-friendly, well-maintained, professionally managed manufactured home community. Capital Crossings, has a model year 2019, 3 bed/2 bath, 1456 sq. ft. home available for $999.00 per month, including site fees! Call today to schedule a viewing and find out how easy it is to move into a new home!
Key facts
- Built 2026
- Listed 5 days
Property features AI
Finance
- Financial info: Listed at $80,499
Exterior
- Home design: Spec new construction — Capital Crossings plan; Active listing
- Construction: Built in 2026 (new construction)
Interior
- Bedrooms: 3 bedrooms
- Bathrooms: 2 full bathrooms
- Interior features: Open living area totaling 1,568
Neighborhood map
What this means for you Summary
Snapshot
- This is a 3-bed/2.0-bath manufactured listed at $80k. Condition is rated good.
Deal economics
- At list price, monthly cash flow is $580 ($7k/yr) — positive.
- The deal already cash-flows at list — no discount required.
- Meets the 1% rule at list price ($1k rent vs $80k).
Location & tenants
- Location reads 64/100 on livability (#480 in MI) — a middle-class / working-renter tenant base. Strengths: cost of living A+, housing A+, employment B; Watch: crime D+, amenities F, commute F.
- Portland Public Schools (town): math 30% / reading 50% proficiency, ranked #191 of 540 in MI (top 35%) — families likely to look elsewhere, expect single-tenant / working-renter base with shorter leases.
- Market conditions: 20 active listings in the ZIP; 1 comparable units currently listed for rent nearby; 154 units permitted in Clinton County in 2024 (0 in 5+ unit buildings).
Forward outlook
- Local home prices are declining (-3.0%/yr); year-one equity from $556 of loan paydown is wiped out by about $2k of value loss. Plan a longer hold.
- At projected returns (-3.0% appreciation + 3.0% rent growth), your $23k cash investment doubles in ~4 years — after that, you're playing with house money.
Negotiation context
- Only 6 days on market — expect competitive offers; lowballing is unlikely to land.
Questions for the listing agent
- Is there a deadline driving the sale (1031 exchange, divorce, estate, relocation)? That informs how much negotiation room exists.
- Schools are B-rated — typically a magnet for longer-tenancy family renters. What's the average tenant stay here, and is there a school-zone premium baked into asking?
- Crime grade is D in this area — have there been break-ins, vandalism, or insurance claims at this property in the last 3 years? What carrier currently insures it and at what premium?
- What's the average days-on-market for RENTAL listings here right now (not sales)? A rising rental-DOM trend means longer vacancies and softer asking-rent achievability than the comps imply.
- What's the recent tenant-quality profile in this submarket — average credit score on applications, eviction rate, late-payment / NSF rate, and stable-employment percentage? A property-management company in the area should have these aggregated.
- How much new for-sale + rental construction is in the pipeline within 1–3 miles? Heavy new supply typically softens prices + rents 12–24 months out; constrained supply supports both.
Investment metrics
- 1% rule
- 1.79% ✓
- Cap rate
- 14.95%
- Cash-on-cash
- 30.91%
- DSCR
- 2.38
- GRM
- 4.7
CMA / ARV
No comps found within radius.
Projected returns pro-forma
-3.0% appreciation · 3.0% rent growth · sell at horizon
- IRR
- 25.7%
- Equity multiple
- 2.06×
- Total profit
- $23,950
- Equity at exit
- $12,003
- IRR
- 33.4%
- Equity multiple
- 4.04×
- Total profit
- $68,551
- Equity at exit
- $6,960
Cash invested: $22,540 (down + closing). Projections, not guarantees.
Landlord ↔ Tenant lean methodology
- Overall (STATE)
- 62 Landlord-Friendly
- State Michigan
- 62 Landlord-Friendly · EVEN
- County
- — inherits STATE
- City
- — inherits STATE
ZIP-level market 48822
- Home prices YoY
- -18.2%
- Active inventory
- 20
- Price-to-rent
- 4.7×
Monthly cashflow live
- Estimated rent
- $1,439 medium interval (Pro) →
- Mortgage (P&I)
- −$422
- Tax est. 1.5%
- −$101 /mo · $1,207/yr
- Insurance
- −$34
- HOA
- −$0
- Vacancy / Maint / Mgmt
- −$302
- Net cashflow
- $580
Break-even live
UW: 25.0% down · 7.5% · 30yr · 1.5% tax · 5.0% vac · 8.0% maint · 8.0% mgmt
Financing live
Cash to close
- Down payment
- $20,125
- Closing costs
- $2,415
- Reserves months
- —
- Total cash needed
- —
Loan-product check · same deal, 3 products live
Conventional
25% down · 7.5% · 30yr
- Down + closing
- —
- Monthly P&I
- —
- Monthly cashflow
- —
- DSCR
- —
- Eligible?
- —
Personal DTI + credit; lowest rate.
DSCR
20% down · 8.5% · 30yr
- Down + closing
- —
- Monthly P&I
- —
- Monthly cashflow
- —
- DSCR
- —
- Eligible?
- —
No personal income docs; deal must DSCR.
Hard money
10% down · 12.0% · 12mo
- Down + closing
- —
- Monthly P&I
- —
- Monthly cashflow
- —
- DSCR
- —
- Eligible?
- —
Short-term bridge; refi at stabilization.
Rent comps 1 comps
| Address | Beds | Baths | Sqft | Rent | $/sqft | DOM | Units | Dist |
|---|---|---|---|---|---|---|---|---|
| 13531 Declaration Ct Eagle, MI | 3.0–4.0 | 2.0 | 1456 | $1,439 | $0.99 | 11d | 1 | 0.06mi |
Listing history 6 events
-
2026-06-10days on market $80,499 Active 6 DOM
-
2026-06-09days on market $80,499 Active 5 DOM
-
2026-06-08days on market $80,499 Active 4 DOM
-
2026-06-07days on market $80,499 Active 3 DOM
-
2026-06-05remarks 371-char remark
-
2026-06-05$80,499 Active 1 DOM
ⓘ Source: listings_history table (triggers on properties + properties_extension) + one-shot
backfill from property_details.listing_events for pre-trigger history.
Climate risk First Street
- Flood 1/10 Low FEMA zone X (unshaded) · 0% chance over 30 yrs
- Wildfire 1/10 Low
- Heat 2/10 Low 7 d/yr ≥98°F today · 15 d/yr by 30 yrs out
- Wind 2/10 Low
- Air quality 2/10 Low 1 unhealthy d/yr today · 2 by 30 yrs out
Nearby sold comps map
Loading sold comps map…
Walkable amenities ~0.75 mi
Loading nearby amenities…
Taxation est. · year 1
- Rental income
- $17,268
- − Mortgage interest
- −$4,509
- − Property taxes
- −$1,207
- − Insurance
- −$402
- − Repairs & maintenance
- −$1,381
- − Management
- −$1,381
- − Depreciation
- −$2,342
- Taxable income
- $6,044
- Est. tax owed @ 24.0%
- −$1,451
- After-tax cash flow
- $5,515/yr
For passive investors: Depreciation is non-cash, so a rental often shows a tax loss while cash-flowing — sheltering income. Rental losses are passive: they offset passive income freely, and up to $25,000/yr can offset ordinary (W-2) income if you actively participate and your MAGI is under $100k (phasing out to $0 by $150k); unused losses carry forward. On sale, claimed depreciation is recaptured at up to 25%, and gains may owe capital-gains tax (a 1031 exchange can defer both). Figures are a year-1 estimate at your 24.0% rate — not tax advice; consult a CPA.
Condition & rehab AI · 6 photos
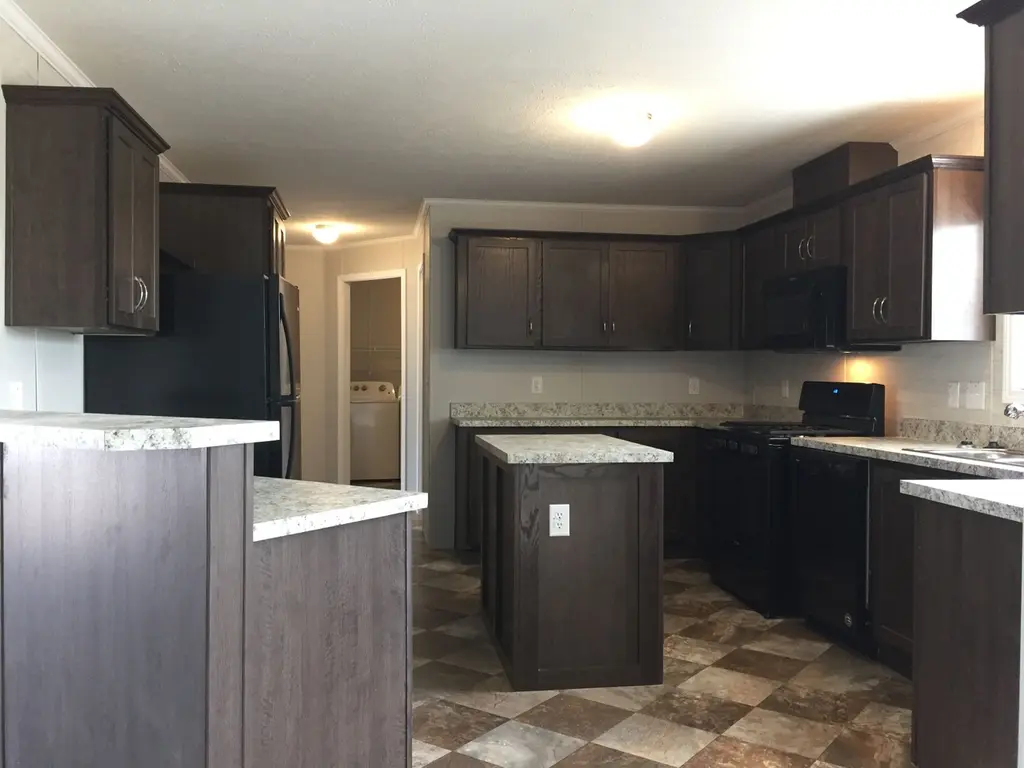
This 2019 manufactured home is in good condition with a fresh paint job and energy-efficient updates, making it a great investment for both resale and rental.
Value-add opportunities
- Both Paint interior walls — Fresh paint enhances curb appeal and interior aesthetics
- Both Replace blinds with energy-efficient shades — Energy-efficient shades improve energy efficiency and appearance
- Both Install new flooring in kitchen and bathrooms — New flooring can significantly increase both resale and rental value
Renovation cost estimate screening
Value-add ROI direction
- Both Paint interior walls — Fresh paint enhances curb appeal and interior aesthetics ↑
- Both Replace blinds with energy-efficient shades — Energy-efficient shades improve energy efficiency and appearance ↑
- Both Install new flooring in kitchen and bathrooms — New flooring can significantly increase both resale and rental value ↑
ⓘ Cost ranges are severity-bucket heuristics (US national rule-of-thumb). Get contractor quotes + a written scope before underwriting a rehab budget.
Schools (NCES district)
- District
- Portland Public Schools
- NCES district ID
- 2629120
- Math proficiency
- 30% ▼ -9.00%
- Reading proficiency
- 50% ▼ -8.00%
- Median HH income
- $61,869
- Composite
- 35.55/100
- National rank
- #4905
- State rank
- #191 of 540 in MI
Livability — Eagle
- Score
- 64/100
- State rank
- #480
- US rank
- #13699
Category grades
Schools grade is shown separately in the Schools card above.
Census & demographics
- Population (ZIP)
- 2,410
Population outlook (Clinton County) Hauer SSP2
- Today (2025)
- 81,490 people
- By 2030
- 82,558 · +1.3%
- By 2040
- 82,325 · +1.0%
- By 2050
- 79,133 · -2.9%
- By 2075
- 65,737 · -19.3%
- By 2100
- 51,314 · -37.0%
Race, ethnicity, and origin ACS 2023
- Neighborhood character
- Predominantly White (84%)
- Race & ethnicity
- White 84% Hispanic / Latino 10% Two or more races 10% Black 4%
- Hispanic origin (detail)
- Mexican 9%
- Common ancestry
- Italian 7% Iranian 5% Romanian 4%
- Foreign-born
- 1% · Canada
- Languages at home
- 99% English-only · Spanish 1%
Political lean MEDSL · Clinton
- 2024 margin
- Lean R (+8.6) · D 44.9% · R 53.5% · Other 1.5%
- 2008→2024 swing
- -9.3pp toward R · 2008: 0.7pp · 2024: -8.6pp
- All cycles
- 2024: R+8.6 2020: R+6.5 2016: R+12.7 2012: R+6.2 2008: D+0.7
Not yet ingested
- Civics
- —
Market trends
- HPI YoY
- ▼ -59.86%
- Current HPI
- 268.4386
- Rent YoY
- —
- Metro
- —
- State GDP YoY
- ▲ 1.37%
- F500 in state
- 28
Industry mix (Fortune 500 HQ in MI)
| Industry | F500 HQs | Revenue |
|---|---|---|
| Automotive Parts | 3 | $48B |
|
||
| Automotive | 2 | $372B |
|
||
| Chemicals | 1 | $45B |
|
||
| Automotive Retail | 1 | $29B |
|
||
| Healthcare / Medical Devices | 1 | $23B |
|
||
| Automotive Technology | 1 | $20B |
|
||
Cash-flow waterfall
monthlySold comps — $/sqft
last 12 mo · ≤1 miLoading sold comps…