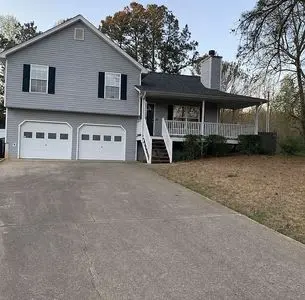
24 Crabapple Way · Villa Rica, GA
Flood risk 1/10 · Minimal
- FEMA flood zone
- X (unshaded)
- Chance of flooding over 30 yrs
- 0.0%
- Est. flood insurance / yr
- $473 – $860
Fire risk 5/10 · Moderate
- Est. fire insurance / yr
- $963 – $1,789
Heat risk 5/10 · Moderate
- Hot days now (above 103°F)
- 7 days/yr
- Hot days in 30 yrs
- 19 days/yr
Wind risk 5/10 · Moderate
- Chance of severe wind over 30 yrs
- 25.0%
Air-quality risk 3/10 · Minor
- Unhealthy air days now
- 3 days/yr
- Unhealthy air days in 30 yrs
- 4 days/yr
Risk factors via First Street. Map © Google.
Why this score? — see what drove the D grade
The composite is a weighted blend of 9 inputs, each scored 0–100. Each bar is that input's sub-score; the figure is the points it added to the 100-point composite (weight × sub-score).
- Appreciation +10.0/10.0
- Cash flow +8.1/30.0
- ARV discount +8.1/15.0
- Schools +3.6/10.0
- Livability +3.2/5.0
- Rent growth +2.5/5.0
- Condition / age +2.5/5.0
- DSCR +2.2/10.0
- 1% rule +2.0/10.0
$258,000
🖨 Deal sheet (PDF) 📄 Offer letter ✓ Due diligence
Listing remarks MLS
Adorable Split level home in the South Paulding area. This home features 3BR/2BA, a large fenced back yard located on a cul-de-sac lot. All kitchen appliances remain. New roof with transferable warranty, HVAC was replaced in 2017, and newer aluminum garage doors. Master bedroom has his and her closets. Outbuilding and playset included. Enjoy your morning coffee while relaxing on your spacious front porch. Make your appt today to view this great home.
Key facts
- Quiet cul-de-sac
- Large 0.58-acre lot
- No hoa
Tags
Neighborhood map
What this means for you Summary
Snapshot
- This is a 3-bed/2.0-bath single-family listed at $258k.
Deal economics
- At list price, monthly cash flow is $-250 ($-3k/yr) — negative.
- To cash-flow at today's rent, offer at most $214k (17.1% below list).
- To meet the 1% rule (rent ≥ 1% of price), the offer needs to be $180k (30.1% below list).
- Recommended offer: $180k (30.1% below list) — sets the bar for 1% rule.
- Cap rate 5.1% vs local median 4.0% in Villa Rica — meaningfully above typical; check what's discounted (condition, days-on-market, listing class) to confirm the premium yield is real.
Location & tenants
- Location reads 65/100 on livability (#224 in GA) — a middle-class / working-renter tenant base. Strengths: cost of living A+, housing A+, employment B; Watch: amenities F, commute F, health & safety F.
- Paulding County (suburban): math 39% / reading 42% proficiency, ranked #33 of 174 in GA (top 19%) — families likely to look elsewhere, expect single-tenant / working-renter base with shorter leases.
- Zoned schools: Union Elementary School (math 49% / reading 40%, grade F, #336 of 1,228 statewide, top 29%, 465 students, 42% FRL); Carl Scoggins Sr. Middle School (math 29% / reading 40%, grade F, #196 of 470 statewide, top 42%, 760 students, 47% FRL); South Paulding High School (math 20% / reading 32%, grade F, #175 of 424 statewide, top 42%, 1,911 students, 36% FRL).
- Market conditions: 191 active listings in the ZIP; 1 comparable units currently listed for rent nearby; solid renter incomes; 1,458 units permitted in Paulding County in 2024 (0 in 5+ unit buildings).
Forward outlook
- In year one you build about $28k of equity ($2k loan paydown + $26k appreciation (10.0% local appreciation)).
- Paulding County population projected at +24% by 2050 — long-run rental-demand tailwind backs the buy-and-hold thesis.
- By year 2, paydown + projected appreciation supports a ~$44k cash-out refi (75% LTV) — recoverable capital for the next deal without selling this one.
Negotiation context
- Only 9 days on market — expect competitive offers; lowballing is unlikely to land.
- 3 sale attempts since 5y ago with the ask held roughly flat each time — persistent listings suggest the price (not the market) is what's stuck; bring a comps-based counter.
- Current owner paid $173k; 49% above their basis — modest negotiation headroom, anchor on the comps not their cost.
Risks & watch-outs
- Climate carrying-cost: moderate wind risk, 25% chance of damaging wind over 30y; moderate wildfire risk; extreme-heat days projected 7→19/yr by 2055 (HVAC capex compounding) — expect insurance premiums to compound above CPI over the hold.
Questions for the listing agent
- What do current leases actually rent for vs. the listed asking? Can we see a recent rent roll and the last 12 months of T-12 income?
- Is there a deadline driving the sale (1031 exchange, divorce, estate, relocation)? That informs how much negotiation room exists.
- The area grade is low — what's the realistic commute time and amenity access for the typical tenant pool here? Any planned neighborhood developments (good or bad) we should know about?
- What's the average days-on-market for RENTAL listings here right now (not sales)? A rising rental-DOM trend means longer vacancies and softer asking-rent achievability than the comps imply.
- What's the recent tenant-quality profile in this submarket — average credit score on applications, eviction rate, late-payment / NSF rate, and stable-employment percentage? A property-management company in the area should have these aggregated.
- How much new for-sale + rental construction is in the pipeline within 1–3 miles? Heavy new supply typically softens prices + rents 12–24 months out; constrained supply supports both.
Investment metrics
- 1% rule
- 0.70% ✗
- Cap rate
- 5.13%
- Cash-on-cash
- -4.15%
- DSCR
- 0.82
- GRM
- 11.9
CMA / ARV
- ARV (on-the-fly)
- $261,648
- Comps found
- 5
Show comp detail 5 sales within ~0.75 mi
| Address | Dist | Beds/Ba | Sqft | Sold | Price | $/sf | Match |
|---|---|---|---|---|---|---|---|
| 139 Orchard Dr | 0.13mi | 3/2.0 | 1,104 (0%) | 15mo | $265,000 | $240 | 82 |
| 389 Orchard Dr | 0.36mi | 3/2.0 | 1,092 (-1%) | 1mo | $250,000 | $229 | 81 |
| 300 Orchard Dr | 0.28mi | 3/2.0 | 1,104 (0%) | 16mo | $265,000 | $240 | 74 |
| 315 Orchard Dr | 0.30mi | 3/2.0 | 1,092 (-1%) | 16mo | $259,000 | $237 | 71 |
| 528 Orchard Dr | 0.47mi | 3/2.5 | 1,154 (+4%) | 21mo | $258,000 | $224 | 52 |
Match score weights: distance 35% · size 25% · config 20% · recency 20%. Top-matched comps best support the ARV.
Projected returns pro-forma
10.0% appreciation · 3.0% rent growth · sell at horizon
- IRR
- 21.3%
- Equity multiple
- 2.72×
- Total profit
- $124,577
- Equity at exit
- $232,427
- IRR
- 19.3%
- Equity multiple
- 6.25×
- Total profit
- $379,280
- Equity at exit
- $501,237
Cash invested: $72,240 (down + closing). Projections, not guarantees.
Landlord ↔ Tenant lean methodology
- Overall (STATE)
- 90 Strongly Landlord-Friendly
- State Georgia
- 90 Strongly Landlord-Friendly · R+3
- County
- — inherits STATE
- City
- — inherits STATE
ZIP-level market 30179
- Home prices YoY
- 6.7%
- Active inventory
- 191
- Price-to-rent
- 11.9×
Monthly cashflow live
- Estimated rent
- $1,803 medium interval (Pro) →
- Mortgage (P&I)
- −$1,353
- Tax from tax record
- −$214 /mo · $2,563/yr
- Insurance
- −$108
- HOA
- −$0
- Vacancy / Maint / Mgmt
- −$379
- Net cashflow
- $-250
Break-even live
Sensitivity live
| Price | -10% $-104 | -5% $-177 | +0% $-250 | +5% $-323 | +10% $-396 |
|---|---|---|---|---|---|
| Rent | -10% $-392 | -5% $-321 | +0% $-250 | +5% $-178 | +10% $-107 |
| Rate | -1.0pp $-120 | -0.5pp $-184 | base $-250 | +0.5pp $-316 | +1.0pp $-384 |
UW: 25.0% down · 7.5% · 30yr · 1.5% tax · 5.0% vac · 8.0% maint · 8.0% mgmt
Financing live
Cash to close
- Down payment
- $64,500
- Closing costs
- $7,740
- Reserves months
- —
- Total cash needed
- —
Loan-product check · same deal, 3 products live
Conventional
25% down · 7.5% · 30yr
- Down + closing
- —
- Monthly P&I
- —
- Monthly cashflow
- —
- DSCR
- —
- Eligible?
- —
Personal DTI + credit; lowest rate.
DSCR
20% down · 8.5% · 30yr
- Down + closing
- —
- Monthly P&I
- —
- Monthly cashflow
- —
- DSCR
- —
- Eligible?
- —
No personal income docs; deal must DSCR.
Hard money
10% down · 12.0% · 12mo
- Down + closing
- —
- Monthly P&I
- —
- Monthly cashflow
- —
- DSCR
- —
- Eligible?
- —
Short-term bridge; refi at stabilization.
Rent comps 1 comps
| Address | Beds | Baths | Sqft | Rent | $/sqft | DOM | Units | Dist |
|---|---|---|---|---|---|---|---|---|
| 484 Rustin Dr Dallas, GA | 3.0 | 1.5 | 1104 | $1,600 | $1.45 | 45d | 1 | 1.10mi |
Listing history 7 events
-
2026-06-21days on market $258,000 Active 9 DOM
-
2026-06-18days on market $258,000 Active 6 DOM
-
2026-06-17days on market $258,000 Active 5 DOM
-
2026-06-16days on market $258,000 Active 4 DOM
-
2026-06-15days on market $258,000 Active 3 DOM
-
2026-06-13remarks 461-char remark
-
2026-06-13$258,000 Active 1 DOM
ⓘ Source: listings_history table (triggers on properties + properties_extension) + one-shot
backfill from property_details.listing_events for pre-trigger history.
Tax reassessment forecast GA · Resets to sale price
- Current annual tax
- $2,563 · $214/mo
- Projected year-2 tax
- $2,563 · $214/mo
- Expected delta
- $0/yr ($0/mo · 0.0%)
ⓘ Screening estimate from a state-policy table — verify with the county assessor before closing.
Climate risk First Street
- Flood 1/10 Low FEMA zone X (unshaded) · 0% chance over 30 yrs
- Wildfire 5/10 Major
- Heat 5/10 Major 7 d/yr ≥103°F today · 19 d/yr by 30 yrs out
- Wind 5/10 Major 25% chance of damaging wind over 30 yrs
- Air quality 3/10 Moderate 3 unhealthy d/yr today · 4 by 30 yrs out
Nearby sold comps map
Loading sold comps map…
Walkable amenities ~0.75 mi
Loading nearby amenities…
Taxation est. · year 1
- Rental income
- $21,637
- − Mortgage interest
- −$14,452
- − Property taxes
- −$2,563
- − Insurance
- −$1,290
- − Repairs & maintenance
- −$1,731
- − Management
- −$1,731
- − Depreciation
- −$7,505
- Taxable loss
- −$7,635
- Est. tax savings @ 24.0%
- +$1,832
- After-tax cash flow
- $-1,163/yr
For passive investors: Depreciation is non-cash, so a rental often shows a tax loss while cash-flowing — sheltering income. Rental losses are passive: they offset passive income freely, and up to $25,000/yr can offset ordinary (W-2) income if you actively participate and your MAGI is under $100k (phasing out to $0 by $150k); unused losses carry forward. On sale, claimed depreciation is recaptured at up to 25%, and gains may owe capital-gains tax (a 1031 exchange can defer both). Figures are a year-1 estimate at your 24.0% rate — not tax advice; consult a CPA.
Schools (NCES district)
- District
- Paulding County
- NCES district ID
- 1304020
- Math proficiency
- 39% ▼ -6.00%
- Reading proficiency
- 42% ▼ -7.00%
- Median HH income
- $61,447
- Composite
- 36.0/100
- National rank
- #4784
- State rank
- #33 of 174 in GA
Livability — Villa Rica
- Score
- 65/100
- State rank
- #224
- US rank
- #13182
Category grades
Schools grade is shown separately in the Schools card above.
Census & demographics
- County
- Carroll County · 124,888 people
- City population
- 43,013
- Metro
- Atlanta-Sandy Springs-Alpharetta, GA
- Population (ZIP)
- 19,882
- Household income
- $76,571
- Rent vs Own
- Severe rent burden
- 396.0
Population outlook (Paulding County) Hauer SSP2
- Today (2025)
- 175,714 people
- By 2030
- 186,082 · +5.9%
- By 2040
- 204,414 · +16.3%
- By 2050
- 217,040 · +23.5%
- By 2075
- 236,980 · +34.9%
- By 2100
- 238,314 · +35.6%
Race, ethnicity, and origin ACS 2023
- Neighborhood character
- Predominantly White (77%)
- Race & ethnicity
- White 77% Black 15% Hispanic / Latino 5% Two or more races 4%
- Common ancestry
- Italian 1% Lithuanian 1% Serbian 1%
- Foreign-born
- 4% · Canada
- Languages at home
- 95% English-only · Spanish 4%
Political lean MEDSL · Paulding
- 2024 margin
- Strong R (+24.1) · D 37.6% · R 61.7%
- 2008→2024 swing
- +14.4pp toward D · 2008: -38.5pp · 2024: -24.1pp
- All cycles
- 2024: R+24.1 2020: R+29.1 2016: R+41.2 2012: R+43.6 2008: R+38.5
Not yet ingested
- Civics
- —
Market trends
- HPI YoY
- ▲ 27.16%
- Current HPI
- 435.3863
- Rent YoY
- —
- Metro
- Atlanta-Sandy Springs-Alpharetta, GA
- State GDP YoY
- ▲ 2.66%
- F500 in state
- 28
Industry mix (Fortune 500 HQ in GA)
| Industry | F500 HQs | Revenue |
|---|---|---|
| Paper / Packaging | 2 | $29B |
|
||
| Retail | 1 | $160B |
|
||
| Transportation / Logistics | 1 | $91B |
|
||
| Airlines | 1 | $62B |
|
||
| Consumer Goods | 1 | $47B |
|
||
| Utilities | 1 | $25B |
|
||
Price history
+51.9% since first listed8 events — show timeline
- 2026-06-12 Listed $258,000 FSBO.com
- 2021-04-02 Sold (MLS) $173,000 GAMLS
- 2021-04-02 Sold (MLS) $173,000 FMLS
- 2021-03-04 Pending — FMLS
- 2021-02-27 Pending — GAMLS
- 2021-02-27 Contingent — FMLS
- 2021-02-24 Listed $169,900 GAMLS
- 2021-02-24 Listed $169,900 FMLS
Property tax history
+4.5%/yrLatest (2025): $2,563 · +0.2% YoY. Source: county tax records.
Cash-flow waterfall
monthlySold comps — $/sqft
last 12 mo · ≤1 miLoading sold comps…