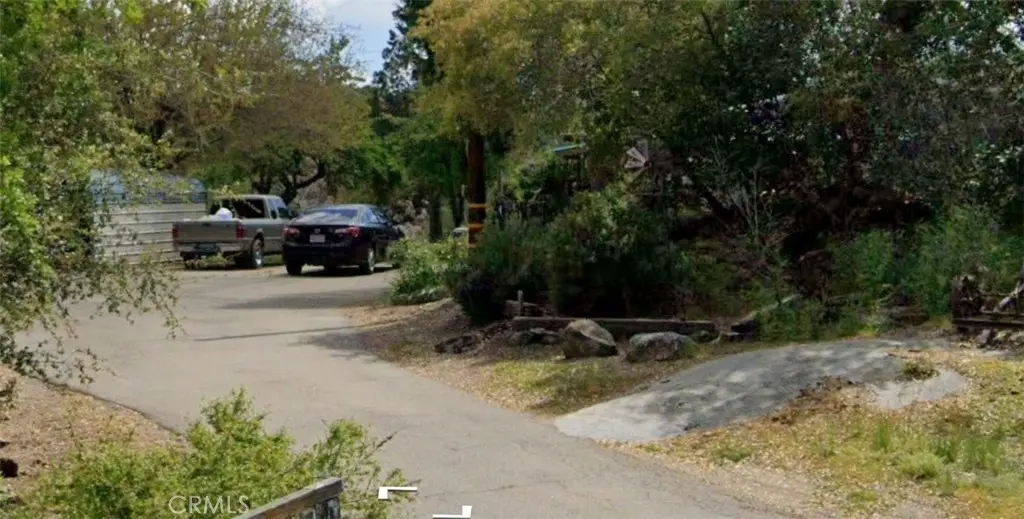
50780 Rosemary · Squaw Valley, CA
Flood risk 1/10 · Minimal
- FEMA flood zone
- X (unshaded)
- Chance of flooding over 30 yrs
- 0.0%
- Est. flood insurance / yr
- $507 – $1,088
Fire risk 10/10 · Severe
- Est. fire insurance / yr
- $659 – $1,223
Heat risk 4/10 · Minor
- Hot days now (above 98°F)
- 4 days/yr
- Hot days in 30 yrs
- 11 days/yr
Wind risk 1/10 · Minimal
- Chance of severe wind over 30 yrs
- —
Air-quality risk 10/10 · Severe
- Unhealthy air days now
- 56 days/yr
- Unhealthy air days in 30 yrs
- 63 days/yr
Risk factors via First Street. Map © Google.
Why this score? — see what drove the D grade
The composite is a weighted blend of 9 inputs, each scored 0–100. Each bar is that input's sub-score; the figure is the points it added to the 100-point composite (weight × sub-score).
- Cash flow +15.3/30.0
- ARV discount +7.5/15.0
- DSCR +4.7/10.0
- 1% rule +3.2/10.0
- Livability +3.0/5.0
- Schools +2.9/10.0
- Rent growth +2.5/5.0
- Condition / age +2.5/5.0
- Appreciation +1.2/10.0
$256,500
🖨 Deal sheet (PDF) 📄 Offer letter ✓ Due diligence
Listing remarks
Discover this property located in the scenic foothill community of Squaw Valley, offering an opportunity for owner-occupants, investors, or buyers seeking additional space and privacy. Situated on a generously sized lot, this property provides potential for outdoor use, recreation, gardening, or future improvements, subject to buyer verification and local regulations. Interior features include functional living areas with natural light and a flexible layout designed to accommodate a variety of needs. Enjoy a rural setting with convenient access to nearby amenities, outdoor recreation, and major commuting routes. Buyers are advised to independently verify all information including square foo
Key facts
- 4.1 acre lot
- 2 garage spots
- Built 1989
Property features AI
Finance
- Other: Total units: 1; Lot size source: Assessor's data; Living area source: Assessor's data; Parcel number: 19035055
- Financial info: Assessments: Unknown
Exterior
- Parking: Attached garage; Two garage spaces (two total parking spaces)
- Utilities: Well water; Septic tank
- Home design: House; Single-story; No accessory dwelling unit
- Construction: Year built per assessor; No common walls
- Exterior features: No pool; Mountainous community setting; Lot described as 2–5 units per acre
Interior
- Kitchen: Kitchen
- Bedrooms: Primary bedroom; All bedrooms located upstairs; Three bedrooms on the main level
- Bathrooms: Two full bathrooms
- Interior features: One-level home; Main-level entry; Has a view; Living room
- Laundry & utility: No laundry features listed
Neighborhood map
What this means for you Summary
Snapshot
- This is a 3-bed/2.0-bath manufactured listed at $256k.
Deal economics
- At list price, monthly cash flow is $94 ($1k/yr) — positive.
- The deal already cash-flows at list — no discount required.
- To meet the 1% rule (rent ≥ 1% of price), the offer needs to be $211k (17.9% below list).
- Recommended offer: $211k (17.9% below list) — sets the bar for 1% rule.
- Cap rate 6.7% vs local median 3.7% in Squaw Valley — top-decile yield for the area; either an underpriced asset or a hidden risk that comps aren't pricing in. Stress-test before assuming the spread holds.
Location & tenants
- Location reads 60/100 on livability (#583 in CA) — a middle-class / working-renter tenant base. Strengths: housing A+, employment A-; Watch: amenities F, commute F, cost of living F.
- Kings Canyon Joint Unified (town): math 26% / reading 43% proficiency, ranked #288 of 517 in CA (top 56%) — families likely to look elsewhere, expect single-tenant / working-renter base with shorter leases; 73% free/reduced lunch — lower-income household profile, screen leases tightly.
- Zoned schools: Dunlap Elementary (math 32% / reading 44%, grade F, #660 of 1,571 statewide, top 42%, 418 students, 72% FRL); Reedley High (math 31% / reading 69%, grade D+, #331 of 1,170 statewide, top 28%, 1,848 students, 82% FRL) — zoned schools at 77% FRL track the district average.
- Market conditions: 77 active listings in the ZIP; 2,426 units permitted in Fresno County in 2024 (296 in 5+ unit buildings).
Forward outlook
- Local home prices are declining (-3.0%/yr); year-one equity from $2k of loan paydown is wiped out by about $8k of value loss. Plan a longer hold.
- Fresno County population projected at +11% by 2050 — modest demand growth; plan on rents tracking national, not racing it.
Negotiation context
- It's been on market 23 days — a 2% lower offer ($253k) is reasonable based on typical stale-listing flexibility.
- Current owner paid $38k; list at $256k implies a 575% gain — meaningful room to come down on a strong offer.
Risks & watch-outs
- Climate carrying-cost: severe wildfire risk — expect insurance premiums to compound above CPI over the hold.
Questions for the listing agent
- Is there a deadline driving the sale (1031 exchange, divorce, estate, relocation)? That informs how much negotiation room exists.
- Schools are F-rated, which usually means shorter tenancies and higher turnover. Who's the typical renter profile here, and what's been the actual vacancy rate?
- The area grade is low — what's the realistic commute time and amenity access for the typical tenant pool here? Any planned neighborhood developments (good or bad) we should know about?
- What's the average days-on-market for RENTAL listings here right now (not sales)? A rising rental-DOM trend means longer vacancies and softer asking-rent achievability than the comps imply.
- What's the recent tenant-quality profile in this submarket — average credit score on applications, eviction rate, late-payment / NSF rate, and stable-employment percentage? A property-management company in the area should have these aggregated.
- How much new for-sale + rental construction is in the pipeline within 1–3 miles? Heavy new supply typically softens prices + rents 12–24 months out; constrained supply supports both.
Investment metrics
- 1% rule
- 0.82% ✗
- Cap rate
- 6.73%
- Cash-on-cash
- 1.58%
- DSCR
- 1.07
- GRM
- 10.1
CMA / ARV
No comps found within radius.
Projected returns pro-forma
-3.0% appreciation · 3.0% rent growth · sell at horizon
- IRR
- -13.8%
- Equity multiple
- 0.50×
- Total profit
- $-35,641
- Equity at exit
- $38,245
- IRR
- -5.1%
- Equity multiple
- 0.67×
- Total profit
- $-23,665
- Equity at exit
- $22,177
Cash invested: $71,820 (down + closing). Projections, not guarantees.
Landlord ↔ Tenant lean methodology
- Overall (STATE)
- 18 Strongly Tenant-Friendly
- State California
- 18 Strongly Tenant-Friendly · D+13
- County
- — inherits STATE
- City
- — inherits STATE
ZIP-level market 93675
- Home prices YoY
- -2.1%
- Active inventory
- 77
- Price-to-rent
- 10.1×
Monthly cashflow live
- Estimated rent
- $2,107 medium interval (Pro) →
- Mortgage (P&I)
- −$1,345
- Tax from tax record
- −$118 /mo · $1,417/yr
- Insurance
- −$107
- HOA
- −$0
- Vacancy / Maint / Mgmt
- −$442
- Net cashflow
- $94
Break-even live
Sensitivity live
| Price | -10% $240 | -5% $167 | +0% $94 | +5% $22 | +10% $-51 |
|---|---|---|---|---|---|
| Rent | -10% $-72 | -5% $11 | +0% $94 | +5% $178 | +10% $261 |
| Rate | -1.0pp $224 | -0.5pp $160 | base $94 | +0.5pp $28 | +1.0pp $-40 |
UW: 25.0% down · 7.5% · 30yr · 1.5% tax · 5.0% vac · 8.0% maint · 8.0% mgmt
Financing live
Cash to close
- Down payment
- $64,125
- Closing costs
- $7,695
- Reserves months
- —
- Total cash needed
- —
Loan-product check · same deal, 3 products live
Conventional
25% down · 7.5% · 30yr
- Down + closing
- —
- Monthly P&I
- —
- Monthly cashflow
- —
- DSCR
- —
- Eligible?
- —
Personal DTI + credit; lowest rate.
DSCR
20% down · 8.5% · 30yr
- Down + closing
- —
- Monthly P&I
- —
- Monthly cashflow
- —
- DSCR
- —
- Eligible?
- —
No personal income docs; deal must DSCR.
Hard money
10% down · 12.0% · 12mo
- Down + closing
- —
- Monthly P&I
- —
- Monthly cashflow
- —
- DSCR
- —
- Eligible?
- —
Short-term bridge; refi at stabilization.
Listing history 18 events
-
2026-06-21days on market $256,500 Active 23 DOM
-
2026-06-18days on market $256,500 Active 20 DOM
-
2026-06-17days on market $256,500 Active 19 DOM
-
2026-06-16days on market $256,500 Active 18 DOM
-
2026-06-15price $256,500 Active 17 DOM
-
2026-06-15days on market $260,000 Active 17 DOM
-
2026-06-13days on market $260,000 Active 15 DOM
-
2026-06-13days on market $260,000 Active 14 DOM
-
2026-06-10days on market $260,000 Active 12 DOM
-
2026-06-09days on market $260,000 Active 11 DOM
-
2026-06-08days on market $260,000 Active 10 DOM
-
2026-06-07days on market $260,000 Active 9 DOM
-
2026-06-03days on market $260,000 Active 5 DOM
-
2026-06-02days on market $260,000 Active 4 DOM
-
2026-06-01days on market $260,000 Active 3 DOM
-
2026-05-31days on market $260,000 Active 2 DOM
-
2026-05-18historical $260,000
-
1979-10-31soldstatus $38,000
ⓘ Source: listings_history table (triggers on properties + properties_extension) + one-shot
backfill from property_details.listing_events for pre-trigger history.
Tax reassessment forecast CA · Resets to sale price
- Current annual tax
- $1,417 · $118/mo
- Projected year-2 tax
- $1,949 · $162/mo
- Expected delta
- +$532/yr (+$44/mo · 37.6%)
ⓘ Screening estimate from a state-policy table — verify with the county assessor before closing.
Climate risk First Street
- Flood 1/10 Low FEMA zone X (unshaded) · 0% chance over 30 yrs
- Wildfire 10/10 Extreme
- Heat 4/10 Moderate 4 d/yr ≥98°F today · 11 d/yr by 30 yrs out
- Wind 1/10 Low
- Air quality 10/10 Extreme 56 unhealthy d/yr today · 63 by 30 yrs out
Nearby sold comps map
Loading sold comps map…
Walkable amenities ~0.75 mi
Loading nearby amenities…
Taxation est. · year 1
- Rental income
- $25,284
- − Mortgage interest
- −$14,368
- − Property taxes
- −$1,417
- − Insurance
- −$1,282
- − Repairs & maintenance
- −$2,023
- − Management
- −$2,023
- − Depreciation
- −$7,462
- Taxable loss
- −$3,291
- Est. tax savings @ 24.0%
- +$790
- After-tax cash flow
- $1,923/yr
For passive investors: Depreciation is non-cash, so a rental often shows a tax loss while cash-flowing — sheltering income. Rental losses are passive: they offset passive income freely, and up to $25,000/yr can offset ordinary (W-2) income if you actively participate and your MAGI is under $100k (phasing out to $0 by $150k); unused losses carry forward. On sale, claimed depreciation is recaptured at up to 25%, and gains may owe capital-gains tax (a 1031 exchange can defer both). Figures are a year-1 estimate at your 24.0% rate — not tax advice; consult a CPA.
Schools (NCES district)
- District
- Kings Canyon Joint Unified
- NCES district ID
- 0619700
- Math proficiency
- 26% ▼ -14.00%
- Reading proficiency
- 43% ▼ -9.00%
- Median HH income
- $42,406
- Composite
- 29.14/100
- National rank
- #6582
- State rank
- #288 of 517 in CA
Livability — Squaw Valley
- Score
- 60/100
- State rank
- #583
- US rank
- #18982
Category grades
Schools grade is shown separately in the Schools card above.
Census & demographics
- Census place
- Squaw Valley, CA
- City population
- 3,739
- Population (ZIP)
- 3,739
Population outlook (Fresno County) Hauer SSP2
- Today (2025)
- 1,042,971 people
- By 2030
- 1,072,198 · +2.8%
- By 2040
- 1,122,408 · +7.6%
- By 2050
- 1,157,251 · +11.0%
- By 2075
- 1,182,575 · +13.4%
- By 2100
- 1,105,899 · +6.0%
Race, ethnicity, and origin ACS 2023
- Neighborhood character
- Diverse neighborhood (Simpson 0.63)
- Race & ethnicity
- White 45% Hispanic / Latino 39% Asian 11% Two or more races 10%
- Hispanic origin (detail)
- Mexican 38%
- Common ancestry
- Serbian 1% Slovak 1%
- Foreign-born
- 22% · Canada, China
- Languages at home
- 61% English-only · Spanish 30% Other Asian/Pacific 5% Chinese 2%
Political lean MEDSL · Fresno
- 2024 margin
- Toss-up / Even · D 46.5% · R 50.9% · Other 2.6%
- 2008→2024 swing
- -6.5pp toward R · 2008: 2.1pp · 2024: -4.4pp
- All cycles
- 2024: R+4.4 2020: D+7.8 2016: D+3.9 2012: R+2.9 2008: D+2.1
Not yet ingested
- Civics
- —
Market trends
- HPI YoY
- ▼ -7.56%
- Current HPI
- 343.5472
- Rent YoY
- —
- Metro
- —
- State GDP YoY
- ▲ 3.21%
- F500 in state
- 116
Industry mix (Fortune 500 HQ in CA)
| Industry | F500 HQs | Revenue |
|---|---|---|
| Technology | 27 | $1,492B |
|
||
| Financial Services | 3 | $174B |
|
||
| Retail | 3 | $44B |
|
||
| Insurance | 3 | $26B |
|
||
| Media / Entertainment | 2 | $115B |
|
||
| Pharmaceuticals / Biotech | 2 | $62B |
|
||
Price history
+575.0% since first listed4 events — show timeline
- 2026-06-15 Price Changed $256,500 CRMLS
- 2026-05-29 Listed $260,000 CRMLS
- 2026-05-18 Coming Soon $260,000 CRMLS
- 1979-10-31 Sold (Public Records) $38,000 Public Records
Property tax history
+1.8%/yrLatest (2025): $1,417 · +2.0% YoY. Source: county tax records.
Cash-flow waterfall
monthlySold comps — $/sqft
last 12 mo · ≤1 miLoading sold comps…