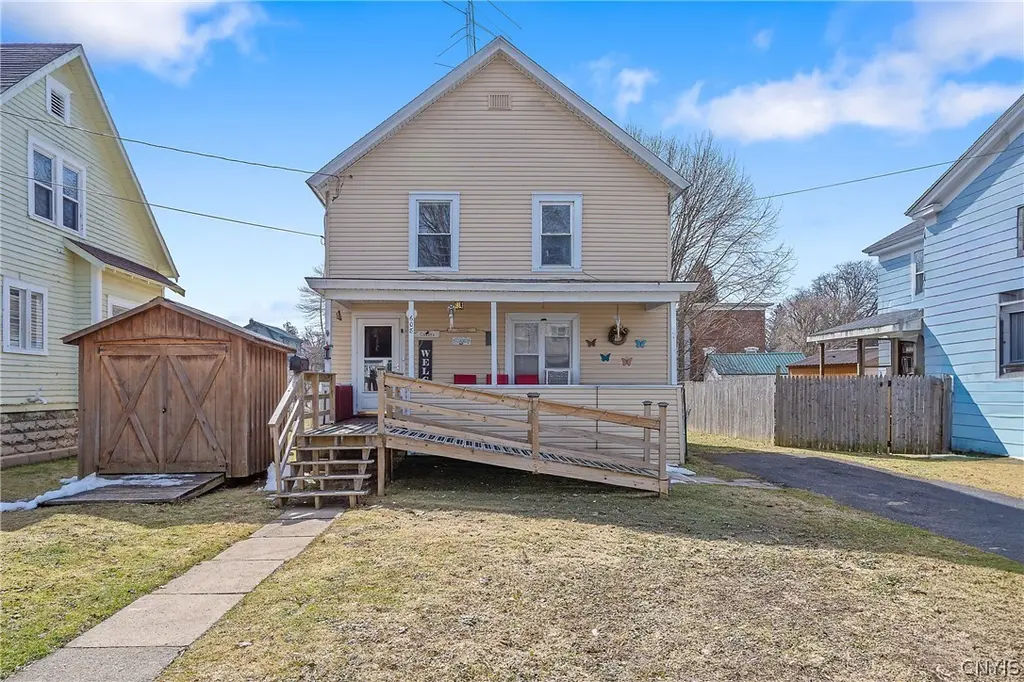
608 Seneca St · Fulton, NY
Flood risk 6/10 · Moderate
- FEMA flood zone
- X (unshaded)
- Chance of flooding over 30 yrs
- 0.74%
- Est. flood insurance / yr
- $473 – $860
Fire risk 2/10 · Minimal
- Est. fire insurance / yr
- $691 – $1,283
Heat risk 2/10 · Minimal
- Hot days now (above 95°F)
- 7 days/yr
- Hot days in 30 yrs
- 16 days/yr
Wind risk 1/10 · Minimal
- Chance of severe wind over 30 yrs
- 1.0%
Air-quality risk 2/10 · Minimal
- Unhealthy air days now
- 1 days/yr
- Unhealthy air days in 30 yrs
- 1 days/yr
Risk factors via First Street. Map © Google.
Why this score? — see what drove the C+ grade
The composite is a weighted blend of 9 inputs, each scored 0–100. Each bar is that input's sub-score; the figure is the points it added to the 100-point composite (weight × sub-score).
- Cash flow +15.3/30.0
- ARV discount +15.0/15.0
- Appreciation +8.4/10.0
- 1% rule +5.9/10.0
- DSCR +4.7/10.0
- Livability +3.1/5.0
- Schools +3.0/10.0
- Rent growth +2.5/5.0
- Condition / age +2.5/5.0
$149,900
🖨 Deal sheet (PDF) 📄 Offer letter ✓ Due diligence
Listing remarks
Welcome home to this charming 4-bedroom, 2-bath gem in the heart of Fulton! Full of warmth and character, this cute home offers spacious bedrooms, comfortable living areas, and a layout that gives everyone room to spread out. The backyard is perfect for summer nights, pets, or a little extra space to play and unwind. Conveniently located near schools, parks, shopping, and restaurants, this home is the perfect blend of comfort, charm, and value.
Key facts
- 6,716 sq ft lot
- Built 1915
- Listed 24 days
Neighborhood map
What this means for you Summary
Snapshot
- This is a 3-bed/2.0-bath single-family listed at $150k.
Deal economics
- At list price, monthly cash flow is $55 ($657/yr) — positive.
- The deal already cash-flows at list — no discount required.
- Meets the 1% rule at list price ($2k rent vs $150k).
- Recommended offer: $148k (1.5% below list) — sets the bar for market timing.
Location & tenants
- Location reads 61/100 on livability (#907 in NY) — a middle-class / working-renter tenant base. Strengths: cost of living A+, housing A+; Watch: employment D, crime F, amenities F.
- Fulton City School District (town): math 29% / reading 43% proficiency, ranked #554 of 590 in NY (top 94%) — families likely to look elsewhere, expect single-tenant / working-renter base with shorter leases.
- Zoned schools: Granby Elementary School (math 17% / reading 32%, grade F, #1,846 of 2,108 statewide, top 91%, 471 students, 70% FRL); Fulton Junior High School (math 15% / reading 34%, grade F, #611 of 729 statewide, top 88%, 500 students, 62% FRL); G Ray Bodley High School (math 83% / reading 86%, grade A, #379 of 1,100 statewide, top 36%, 976 students, 57% FRL).
- Market conditions: 116 active listings in the ZIP; 3 comparable units currently listed for rent nearby; rentals at typical pace (median 15d on market — plan ~3-4 weeks tenant-placement turnaround); 172 units permitted in Oswego County in 2024 (27 in 5+ unit buildings).
Forward outlook
- In year one you build about $11k of equity ($1k loan paydown + $10k appreciation (6.8% local appreciation)).
- Oswego County population projected at -23% by 2050 — secular population decline; favor cash flow + early exit over multi-decade hold.
- At projected returns (6.8% appreciation + 3.0% rent growth), your $42k cash investment doubles in ~4 years — after that, you're playing with house money.
- By year 4, paydown + projected appreciation supports a ~$38k cash-out refi (75% LTV) — recoverable capital for the next deal without selling this one.
Negotiation context
- It's been on market 24 days — a 2% lower offer ($148k) is reasonable based on typical stale-listing flexibility.
Risks & watch-outs
- Watch-outs: property tax is 3.1% of price; built in 1915 — expect roof / HVAC / electrical / plumbing capex.
- Climate carrying-cost: major flood risk — expect insurance premiums to compound above CPI over the hold.
Questions for the listing agent
- Built in 1915 — when were the roof, HVAC, electrical panel, plumbing, and water heater last replaced?
- Property tax is high relative to price — has the assessment been appealed recently, and will the sale trigger a re-assessment?
- Is there a deadline driving the sale (1031 exchange, divorce, estate, relocation)? That informs how much negotiation room exists.
- Schools are D-rated, which usually means shorter tenancies and higher turnover. Who's the typical renter profile here, and what's been the actual vacancy rate?
- Crime grade is F in this area — have there been break-ins, vandalism, or insurance claims at this property in the last 3 years? What carrier currently insures it and at what premium?
- What's the average days-on-market for RENTAL listings here right now (not sales)? A rising rental-DOM trend means longer vacancies and softer asking-rent achievability than the comps imply.
- What's the recent tenant-quality profile in this submarket — average credit score on applications, eviction rate, late-payment / NSF rate, and stable-employment percentage? A property-management company in the area should have these aggregated.
- How much new for-sale + rental construction is in the pipeline within 1–3 miles? Heavy new supply typically softens prices + rents 12–24 months out; constrained supply supports both.
Investment metrics
- 1% rule
- 1.09% ✓
- Cap rate
- 6.73%
- Cash-on-cash
- 1.56%
- DSCR
- 1.07
- GRM
- 7.6
CMA / ARV
- ARV (on-the-fly)
- $184,490
- Comps found
- 12
Show comp detail 12 sales within ~0.75 mi
| Address | Dist | Beds/Ba | Sqft | Sold | Price | $/sf | Match |
|---|---|---|---|---|---|---|---|
| 608 Seneca St | 0.00mi | 4/2.0 (+1) | 1,942 (0%) | 0mo | $149,900 | $77 | 95 |
| 409 Seneca St | 0.17mi | 4/1.0 (+1) | 1,726 (-11%) | 2mo | $111,300 | $64 | 63 |
| 205 S 4th St | 0.42mi | 4/1.5 (+1) | 2,004 (+3%) | 8mo | $215,000 | $107 | 62 |
| 515 Highland St | 0.39mi | 4/2.0 (+1) | 1,974 (+2%) | 15mo | $80,000 | $41 | 62 |
| 614 E Broadway St | 0.47mi | 4/2.5 (+1) | 1,920 (-1%) | 11mo | $185,000 | $96 | 60 |
| 1021 Cayuga St | 0.35mi | 3/1.0 | 1,743 (-10%) | 3mo | $95,000 | $55 | 60 |
| 17 N 5th St | 0.11mi | 4/2.0 (+1) | 1,650 (-15%) | 7mo | $192,000 | $116 | 59 |
| 264 S 5th St | 0.48mi | 3/3.0 | 2,034 (+5%) | 10mo | $193,500 | $95 | 58 |
| 890 Cayuga St | 0.29mi | 4/1.5 (+1) | 1,716 (-12%) | 4mo | $110,000 | $64 | 56 |
| 368 S 7th St | 0.57mi | 4/1.5 (+1) | 1,842 (-5%) | 3mo | $162,000 | $88 | 55 |
| 362 S 4th St | 0.63mi | 4/1.5 (+1) | 1,812 (-7%) | 8mo | $180,000 | $99 | 46 |
| 306 Academy St | 0.48mi | 4/1.5 (+1) | 2,128 (+10%) | 14mo | $220,000 | $103 | 43 |
Match score weights: distance 35% · size 25% · config 20% · recency 20%. Top-matched comps best support the ARV.
Projected returns pro-forma
6.75% appreciation · 3.0% rent growth · sell at horizon
- IRR
- 18.4%
- Equity multiple
- 2.28×
- Total profit
- $53,648
- Equity at exit
- $101,397
- IRR
- 17.7%
- Equity multiple
- 4.67×
- Total profit
- $153,903
- Equity at exit
- $190,404
Cash invested: $41,972 (down + closing). Projections, not guarantees.
Landlord ↔ Tenant lean methodology
- Overall (STATE)
- 15 Strongly Tenant-Friendly
- State New York
- 15 Strongly Tenant-Friendly · D+10
- County
- — inherits STATE
- City
- — inherits STATE
ZIP-level market 13069
- Home prices YoY
- 2.3%
- Active inventory
- 116
- Price-to-rent
- 7.6×
Monthly cashflow live
- Estimated rent
- $1,636 medium interval (Pro) →
- Mortgage (P&I)
- −$786
- Tax from tax record
- −$389 /mo · $4,670/yr
- Insurance
- −$62
- HOA
- −$0
- Vacancy / Maint / Mgmt
- −$344
- Net cashflow
- $55
Break-even live
Sensitivity live
| Price | -10% $140 | -5% $97 | +0% $55 | +5% $12 | +10% $-30 |
|---|---|---|---|---|---|
| Rent | -10% $-75 | -5% $-10 | +0% $55 | +5% $119 | +10% $184 |
| Rate | -1.0pp $130 | -0.5pp $93 | base $55 | +0.5pp $16 | +1.0pp $-24 |
UW: 25.0% down · 7.5% · 30yr · 1.5% tax · 5.0% vac · 8.0% maint · 8.0% mgmt
Financing live
Cash to close
- Down payment
- $37,475
- Closing costs
- $4,497
- Reserves months
- —
- Total cash needed
- —
Loan-product check · same deal, 3 products live
Conventional
25% down · 7.5% · 30yr
- Down + closing
- —
- Monthly P&I
- —
- Monthly cashflow
- —
- DSCR
- —
- Eligible?
- —
Personal DTI + credit; lowest rate.
DSCR
20% down · 8.5% · 30yr
- Down + closing
- —
- Monthly P&I
- —
- Monthly cashflow
- —
- DSCR
- —
- Eligible?
- —
No personal income docs; deal must DSCR.
Hard money
10% down · 12.0% · 12mo
- Down + closing
- —
- Monthly P&I
- —
- Monthly cashflow
- —
- DSCR
- —
- Eligible?
- —
Short-term bridge; refi at stabilization.
Rent comps 3 comps
| Address | Beds | Baths | Sqft | Rent | $/sqft | DOM | Units | Dist |
|---|---|---|---|---|---|---|---|---|
| 303 S 5th St Fulton, NY | 4.0 | 1.5 | 1800 | $1,850 | $1.03 | 15d | 1 | 0.49mi |
| 115 W 1st St S Unit 2 Fulton, NY | 2.0 | 1.0 | 1958 | $1,400 | $0.72 | 15d | 1 | 0.74mi |
| 262 W 4th St S Unit 1 Fulton, NY | 3.0 | 1.0 | 1316 | $1,500 | $1.14 | 45d | 1 | 1.04mi |
Listing history 2 events
-
2026-04-21status Pending
-
2026-03-28$149,900 Active
ⓘ Source: listings_history table (triggers on properties + properties_extension) + one-shot
backfill from property_details.listing_events for pre-trigger history.
Tax reassessment forecast NY · Partial reset (capped growth)
- Current annual tax
- $4,670 · $389/mo
- Projected year-2 tax
- $4,670 · $389/mo
- Expected delta
- $0/yr ($0/mo · 0.0%)
ⓘ Screening estimate from a state-policy table — verify with the county assessor before closing.
Climate risk First Street
- Flood 6/10 Major FEMA zone X (unshaded) · 74% chance over 30 yrs
- Wildfire 2/10 Low
- Heat 2/10 Low 7 d/yr ≥95°F today · 16 d/yr by 30 yrs out
- Wind 1/10 Low 100% chance of damaging wind over 30 yrs
- Air quality 2/10 Low 1 unhealthy d/yr today · 1 by 30 yrs out
Nearby sold comps map
Loading sold comps map…
Walkable amenities ~0.75 mi
Loading nearby amenities…
Taxation est. · year 1
- Rental income
- $19,633
- − Mortgage interest
- −$8,397
- − Property taxes
- −$4,670
- − Insurance
- −$750
- − Repairs & maintenance
- −$1,571
- − Management
- −$1,571
- − Depreciation
- −$4,361
- Taxable loss
- −$1,686
- Est. tax savings @ 24.0%
- +$405
- After-tax cash flow
- $1,061/yr
For passive investors: Depreciation is non-cash, so a rental often shows a tax loss while cash-flowing — sheltering income. Rental losses are passive: they offset passive income freely, and up to $25,000/yr can offset ordinary (W-2) income if you actively participate and your MAGI is under $100k (phasing out to $0 by $150k); unused losses carry forward. On sale, claimed depreciation is recaptured at up to 25%, and gains may owe capital-gains tax (a 1031 exchange can defer both). Figures are a year-1 estimate at your 24.0% rate — not tax advice; consult a CPA.
Schools (NCES district)
- District
- Fulton City School District
- NCES district ID
- 3611700
- Math proficiency
- 29% ▼ -11.00%
- Reading proficiency
- 43% ▲ 5.00%
- Median HH income
- $43,337
- Composite
- 30.49/100
- National rank
- #6220
- State rank
- #554 of 590 in NY
Livability — Fulton
- Score
- 61/100
- State rank
- #907
- US rank
- #17723
Category grades
Schools grade is shown separately in the Schools card above.
Census & demographics
- Census place
- Fulton, NY
- Population (ZIP)
- 23,176
Population outlook (Oswego County) Hauer SSP2
- Today (2025)
- 114,465 people
- By 2030
- 109,968 · -3.9%
- By 2040
- 99,205 · -13.3%
- By 2050
- 87,979 · -23.1%
- By 2075
- 65,100 · -43.1%
- By 2100
- 47,117 · -58.8%
Race, ethnicity, and origin ACS 2023
- Neighborhood character
- Predominantly White (93%)
- Race & ethnicity
- White 93% Hispanic / Latino 4% Two or more races 3%
- Common ancestry
- Lithuanian 6% Romanian 6% Iranian 2%
- Foreign-born
- 2% · Canada
- Languages at home
- 96% English-only · Spanish 2% German/W. Germanic 1%
Political lean MEDSL · Oswego
- 2024 margin
- Strong R (+24.2) · D 37.9% · R 62.1%
- 2008→2024 swing
- -26.6pp toward R · 2008: 2.5pp · 2024: -24.2pp
- All cycles
- 2024: R+24.2 2020: R+20.2 2016: R+23.2 2012: D+7.9 2008: D+2.5
Not yet ingested
- Civics
- —
Market trends
- HPI YoY
- ▲ 6.75%
- Current HPI
- 304.443
- Rent YoY
- —
- Metro
- —
- State GDP YoY
- ▲ 2.60%
- F500 in state
- 92
Industry mix (Fortune 500 HQ in NY)
| Industry | F500 HQs | Revenue |
|---|---|---|
| Financial Services | 10 | $950B |
|
||
| Consumer Goods | 9 | $162B |
|
||
| Insurance | 4 | $225B |
|
||
| Telecommunications | 2 | $144B |
|
||
| Pharmaceuticals | 2 | $112B |
|
||
| Media / Entertainment | 2 | $69B |
|
||
Price history
2 events — show timeline
- 2026-04-21 Pending — CNYIS
- 2026-03-28 Listed $149,900 CNYIS
Property tax history
+7.4%/yrLatest (2025): $4,670 · +2.2% YoY. Source: county tax records.
Cash-flow waterfall
monthlySold comps — $/sqft
last 12 mo · ≤1 miLoading sold comps…