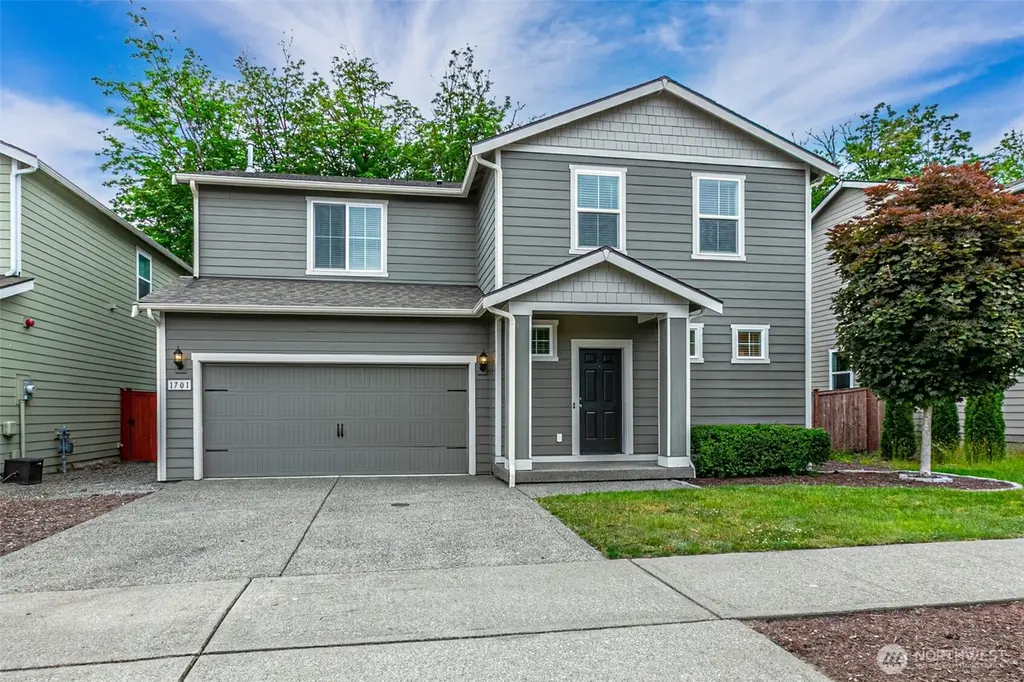
1701 Butler Ct NW · Olympia, WA
Flood risk 1/10 · Minimal
- FEMA flood zone
- X (unshaded)
- Chance of flooding over 30 yrs
- 0.0%
- Est. flood insurance / yr
- $507 – $1,088
Fire risk 2/10 · Minimal
- Est. fire insurance / yr
- $604 – $1,122
Heat risk 3/10 · Minor
- Hot days now (above 88°F)
- 7 days/yr
- Hot days in 30 yrs
- 15 days/yr
Wind risk 1/10 · Minimal
- Chance of severe wind over 30 yrs
- —
Air-quality risk 6/10 · Moderate
- Unhealthy air days now
- 7 days/yr
- Unhealthy air days in 30 yrs
- 7 days/yr
Risk factors via First Street. Map © Google.
Why this score? — see what drove the D grade
The composite is a weighted blend of 9 inputs, each scored 0–100. Each bar is that input's sub-score; the figure is the points it added to the 100-point composite (weight × sub-score).
- Appreciation +10.0/10.0
- ARV discount +8.8/15.0
- Schools +6.2/10.0
- Cash flow +4.8/30.0
- Livability +4.2/5.0
- Rent growth +3.3/5.0
- Condition / age +2.5/5.0
- 1% rule +0.2/10.0
- DSCR +0.0/10.0
$520,000
🖨 Deal sheet 📄 Offer letter ✓ Due diligence
Listing remarks
Move right into this charming 1,860± sq ft home featuring all new interior paint throughout, creating a fresh and modern feel. The open main living area is ideal for entertaining, while the spacious kitchen flows seamlessly into the great room. Upstairs you'll find generous bedrooms, including a large primary suite with an ensuite bath and walk-in closet. Situated in a desirable Olympia neighborhood close to everyday amenities and commuter routes. Conveniently located near shopping, dining, parks, and schools, this home combines comfort, style, and convenience
Key facts
- Spacious kitchen
- Great room
- New interior paint
Tags
Property features AI
Finance
- Financial info: Financing options: Cash, Conventional, FHA, USDA, VA
- HOA & community: Evergreen Pointe HOA; HOA dues approximately $168.81 quarterly
Exterior
- Parking: Attached carport; Covered parking for 2 vehicles; 2 carport spaces
- Security: Fully fenced yard
- Utilities: Public water (City of Olympia); Sewer connected (City of Olympia); Electric service by PSE; Natural gas energy source
- Home design: Single-family residence; Two stories; Entry at main level; Built on lot; Very good condition
- Construction: Built in 2016 (effective year); Standard frame construction; Wood construction materials; Composition roof; Poured concrete foundation
- Exterior features: Wood products exterior; Patio; Cable TV available; Fenced - fully; Cul-de-sac location; Dead-end street; Paved driveway/streets; Sidewalks; Has view; Level to partial slope topography
Interior
- Kitchen: Dishwasher; Garbage disposal; Microwave; Refrigerator; Stove/Range
- Bedrooms: 3 bedrooms (all on upper level)
- Flooring: Engineered hardwood
- Bathrooms: 2 full bathrooms; 1 half bathroom; 2 bathtubs; 2 showers
- Heating & cooling: Forced air heating; No central cooling
- Interior features: Ceiling fan(s); Dining room; Walk-in closet(s); Fully fenced
Neighborhood map
What this means for you Summary
Snapshot
- This is a 3-bed/2.5-bath single-family listed at $520k.
Deal economics
- At list price, monthly cash flow is $-1k ($-15k/yr) — negative.
- To cash-flow at today's rent, offer at most $295k (43.3% below list).
- To meet the 1% rule (rent ≥ 1% of price), the offer needs to be $273k (47.6% below list).
- Recommended offer: $273k (47.6% below list) — sets the bar for 1% rule.
- Cap rate 3.4% vs local median 2.4% in Olympia — top-decile yield for the area; either an underpriced asset or a hidden risk that comps aren't pricing in. Stress-test before assuming the spread holds.
Location & tenants
- Location reads 83/100 on livability (#58 in WA, #1,036 nationally) — a professional / high-income tenant draw. Strengths: amenities A+, commute A+, health & safety A+; Watch: crime F, cost of living D-.
- Olympia School District (urban): math 66% / reading 75% proficiency, ranked #17 of 291 in WA (top 6%) — strong family-tenant draw, lease renewals of 3-5y typical.
- Market conditions: Rents rising (+3.2%/yr); 304 active listings in the ZIP; 4 comparable units currently listed for rent nearby; rentals lingering (median 44d on market — plan ~5-8 weeks vacancy on turnover, expect pricing pressure); 50% of comp listings sitting > 30 days — soft ceiling on asking rent; solid renter incomes; 1,222 units permitted in Thurston County in 2024 (508 in 5+ unit buildings).
- This rent runs 35% of the median local income ($92k/yr) — at the standard rent-burdened threshold; future hikes will face affordability resistance.
Forward outlook
- In year one you build about $56k of equity ($4k loan paydown + $52k appreciation (10.0% local appreciation)).
- Thurston County population projected at +27% by 2050 — long-run rental-demand tailwind backs the buy-and-hold thesis.
- By year 2, paydown + projected appreciation supports a ~$89k cash-out refi (75% LTV) — recoverable capital for the next deal without selling this one.
Negotiation context
- It's been on market 15 days — a 2% lower offer ($512k) is reasonable based on typical stale-listing flexibility.
- 7 sale attempts since 9y ago with the ask held roughly flat each time — persistent listings suggest the price (not the market) is what's stuck; bring a comps-based counter.
- Current owner paid $420k; 24% above their basis — modest negotiation headroom, anchor on the comps not their cost.
Questions for the listing agent
- What do current leases actually rent for vs. the listed asking? Can we see a recent rent roll and the last 12 months of T-12 income?
- What does the HOA fee cover, when was the last increase, and are there any pending special assessments or reserve-fund shortfalls?
- Is there a deadline driving the sale (1031 exchange, divorce, estate, relocation)? That informs how much negotiation room exists.
- Schools are A-rated — typically a magnet for longer-tenancy family renters. What's the average tenant stay here, and is there a school-zone premium baked into asking?
- Crime grade is F in this area — have there been break-ins, vandalism, or insurance claims at this property in the last 3 years? What carrier currently insures it and at what premium?
- The area grade is low — what's the realistic commute time and amenity access for the typical tenant pool here? Any planned neighborhood developments (good or bad) we should know about?
- What's the average days-on-market for RENTAL listings here right now (not sales)? A rising rental-DOM trend means longer vacancies and softer asking-rent achievability than the comps imply.
- What's the recent tenant-quality profile in this submarket — average credit score on applications, eviction rate, late-payment / NSF rate, and stable-employment percentage? A property-management company in the area should have these aggregated.
- How much new for-sale + rental construction is in the pipeline within 1–3 miles? Heavy new supply typically softens prices + rents 12–24 months out; constrained supply supports both.
Investment metrics
- 1% rule
- 0.52% ✗
- Cap rate
- 3.35%
- Cash-on-cash
- -10.50%
- DSCR
- 0.53
- GRM
- 15.9
CMA / ARV
- ARV (on-the-fly)
- $535,680
- Comps found
- 12
Show comp detail 12 sales within ~0.75 mi
| Address | Dist | Beds/Ba | Sqft | Sold | Price | $/sf | Match |
|---|---|---|---|---|---|---|---|
| 4405 Hammersley Way NW | 0.12mi | 3/2.0 | 1,680 (-10%) | 4mo | $535,000 | $318 | 73 |
| 2210 Cooper Crest St NW | 0.70mi | 3/2.5 | 1,894 (+2%) | 16mo | $540,000 | $285 | 51 |
| 4406 Hammersley Way NW | 0.10mi | 3/2.0 | 1,600 (-14%) | 23mo | $525,000 | $328 | 51 |
| 1615 Easthill Ct NW | 0.75mi | 3/2.0 | 1,999 (+8%) | 1mo | $575,000 | $288 | 49 |
| 1734 Medallion Loop NW | 0.67mi | 3/2.5 | 1,786 (-4%) | 16mo | $460,000 | $258 | 48 |
| 1815 Cameo Ct NW | 0.74mi | 3/2.0 | 1,938 (+4%) | 14mo | $678,600 | $350 | 45 |
| 2319 Crestwood Pl NW | 0.61mi | 4/2.5 (+1) | 2,078 (+12%) | 5mo | $505,000 | $243 | 42 |
| 4327 5th Ave NW | 0.74mi | 4/2.5 (+1) | 1,924 (+3%) | 16mo | $517,000 | $269 | 42 |
| 2304 Cooper Crest Pl NW | 0.69mi | 4/2.5 (+1) | 2,068 (+11%) | 6mo | $500,000 | $242 | 40 |
| 3922 Hillview Ct NW | 0.38mi | 3/2.0 | 1,616 (-13%) | 23mo | $540,000 | $334 | 39 |
| 4038 11th Ave NW | 0.66mi | 2/2.0 (-1) | 1,752 (-6%) | 18mo | $541,000 | $309 | 38 |
| 4405 5th Ave NW | 0.74mi | 4/2.5 (+1) | 1,968 (+6%) | 18mo | $512,000 | $260 | 36 |
Match score weights: distance 35% · size 25% · config 20% · recency 20%. Top-matched comps best support the ARV.
Projected returns pro-forma
10.0% appreciation · 3.16% rent growth · sell at horizon
- IRR
- 16.9%
- Equity multiple
- 2.39×
- Total profit
- $202,419
- Equity at exit
- $468,457
- IRR
- 16.1%
- Equity multiple
- 5.54×
- Total profit
- $660,694
- Equity at exit
- $1,010,246
Cash invested: $145,600 (down + closing). Projections, not guarantees.
Landlord ↔ Tenant lean methodology
- Overall (STATE)
- 28 Tenant-Leaning
- State Washington
- 28 Tenant-Leaning · D+8
- County
- — inherits STATE
- City
- — inherits STATE
ZIP-level market 98502
- Home prices YoY
- 1.8%
- Rents YoY
- 3.2%
- Active inventory
- 304
- Price-to-rent
- 15.9×
Monthly cashflow live
- Estimated rent
- $2,725 medium interval (Pro) →
- Mortgage (P&I)
- −$2,727
- Tax from tax record
- −$428 /mo · $5,132/yr
- Insurance
- −$217
- HOA
- −$56
- Vacancy / Maint / Mgmt
- −$572
- Net cashflow
- $-1,274
Break-even live
UW: 25.0% down · 7.5% · 30yr · 1.5% tax · 5.0% vac · 8.0% maint · 8.0% mgmt
Financing live
Cash to close
- Down payment
- $130,000
- Closing costs
- $15,600
- Reserves months
- —
- Total cash needed
- —
Loan-product check · same deal, 3 products live
Conventional
25% down · 7.5% · 30yr
- Down + closing
- —
- Monthly P&I
- —
- Monthly cashflow
- —
- DSCR
- —
- Eligible?
- —
Personal DTI + credit; lowest rate.
DSCR
20% down · 8.5% · 30yr
- Down + closing
- —
- Monthly P&I
- —
- Monthly cashflow
- —
- DSCR
- —
- Eligible?
- —
No personal income docs; deal must DSCR.
Hard money
10% down · 12.0% · 12mo
- Down + closing
- —
- Monthly P&I
- —
- Monthly cashflow
- —
- DSCR
- —
- Eligible?
- —
Short-term bridge; refi at stabilization.
Rent comps 4 comps
| Address | Beds | Baths | Sqft | Rent | $/sqft | DOM | Units | Dist |
|---|---|---|---|---|---|---|---|---|
| 4407 Goldcrest Dr NW Olympia, WA | 4.0 | 2.5 | 2615 | $2,950 | $1.13 | 43d | 1 | 0.15mi |
| 1901 Hudson St NW Olympia, WA | 3.0 | 2.5 | 1705 | $2,700 | $1.58 | 13d | 1 | 0.18mi |
| 5004 4th Way SW Olympia, WA | 2.0–3.0 | 2.0–2.5 | 1271 | $2,645 | $2.08 | 13d | 5 | 1.06mi |
| 4611 Greenwood Dr SW Olympia, WA | 3.0 | 3.0 | 1448 | $2,495 | $1.72 | 43d | 1 | 1.19mi |
HOA detail
- Monthly dues
- $56 · $672/yr
Listing history 12 events
-
2026-06-18days on market $520,000 Active 15 DOM
-
2026-06-17days on market $520,000 Active 14 DOM
-
2026-06-16days on market $520,000 Active 13 DOM
-
2026-06-15days on market $520,000 Active 12 DOM
-
2026-06-14days on market $520,000 Active 10 DOM
-
2026-06-13days on market $520,000 Active 9 DOM
-
2026-06-10days on market $520,000 Active 7 DOM
-
2026-06-09days on market $520,000 Active 6 DOM
-
2026-06-08days on market $520,000 Active 5 DOM
-
2026-06-07days on market $520,000 Active 4 DOM
-
2026-06-05remarks 566-char remark
-
2026-06-05$520,000 Active 1 DOM
ⓘ Source: listings_history table (triggers on properties + properties_extension) + one-shot
backfill from property_details.listing_events for pre-trigger history.
Tax reassessment forecast WA · Resets to sale price
- Current annual tax
- $5,132 · $428/mo
- Projected year-2 tax
- $5,132 · $428/mo
- Expected delta
- $0/yr ($0/mo · 0.0%)
ⓘ Screening estimate from a state-policy table — verify with the county assessor before closing.
Climate risk First Street
- Flood 1/10 Low FEMA zone X (unshaded) · 0% chance over 30 yrs
- Wildfire 2/10 Low
- Heat 3/10 Moderate 7 d/yr ≥88°F today · 15 d/yr by 30 yrs out
- Wind 1/10 Low
- Air quality 6/10 Major 7 unhealthy d/yr today · 7 by 30 yrs out
Nearby sold comps map
Loading sold comps map…
Walkable amenities ~0.75 mi
Loading nearby amenities…
Taxation est. · year 1
- Rental income
- $32,703
- − Mortgage interest
- −$29,128
- − Property taxes
- −$5,132
- − Insurance
- −$2,600
- − Repairs & maintenance
- −$2,616
- − Management
- −$2,616
- − HOA
- −$672
- − Depreciation
- −$15,127
- Taxable loss
- −$25,189
- Est. tax savings @ 24.0%
- +$6,045
- After-tax cash flow
- $-9,247/yr
For passive investors: Depreciation is non-cash, so a rental often shows a tax loss while cash-flowing — sheltering income. Rental losses are passive: they offset passive income freely, and up to $25,000/yr can offset ordinary (W-2) income if you actively participate and your MAGI is under $100k (phasing out to $0 by $150k); unused losses carry forward. On sale, claimed depreciation is recaptured at up to 25%, and gains may owe capital-gains tax (a 1031 exchange can defer both). Figures are a year-1 estimate at your 24.0% rate — not tax advice; consult a CPA.
Schools (NCES district)
- District
- Olympia School District
- NCES district ID
- 5306180
- Math proficiency
- 66% ▼ -2.00%
- Reading proficiency
- 75% ▼ -2.00%
- Median HH income
- $63,852
- Composite
- 62.27/100
- National rank
- #1438
- State rank
- #17 of 291 in WA
Livability — Olympia
- Score
- 83/100
- State rank
- #58
- US rank
- #1036
Category grades
Schools grade is shown separately in the Schools card above.
Census & demographics
- Census place
- Olympia, WA
- County
- Thurston County · 269,345 people
- City population
- 98,428
- Metro
- Olympia-Lacey-Tumwater, WA
- Population (ZIP)
- 35,398
- Household income
- $92,207
- Rent vs Own
- Severe rent burden
- 1811.0
Population outlook (Thurston County) Hauer SSP2
- Today (2025)
- 308,239 people
- By 2030
- 326,483 · +5.9%
- By 2040
- 359,890 · +16.8%
- By 2050
- 391,800 · +27.1%
- By 2075
- 468,024 · +51.8%
- By 2100
- 519,890 · +68.7%
Race, ethnicity, and origin ACS 2023
- Neighborhood character
- Predominantly White (71%)
- Race & ethnicity
- White 71% Two or more races 13% Hispanic / Latino 11% Asian 6% Black 3% Native American 1%
- Hispanic origin (detail)
- Mexican 3% Puerto Rican 4%
- Common ancestry
- Italian 5% Portuguese 4% Iranian 3%
- Foreign-born
- 8% · Vietnam, Canada, China
- Languages at home
- 90% English-only · Spanish 3% Vietnamese 2% Other Asian/Pacific 1%
Political lean MEDSL · Thurston
- 2024 margin
- Strong D (+20.4) · D 58.5% · R 38.1% · Other 3.5%
- 2008→2024 swing
- -1.3pp toward R · 2008: 21.7pp · 2024: 20.4pp
- All cycles
- 2024: D+20.4 2020: D+18.6 2016: D+15.4 2012: D+19.0 2008: D+21.7
Not yet ingested
- Civics
- —
Market trends
- HPI YoY
- ▲ 18.49%
- Current HPI
- 1056.49
- Rent YoY
- ▲ 3.16%
- Metro
- Olympia-Lacey-Tumwater, WA
- State GDP YoY
- ▲ 4.65%
- F500 in state
- 22
Industry mix (Fortune 500 HQ in WA)
| Industry | F500 HQs | Revenue |
|---|---|---|
| Retail | 2 | $269B |
|
||
| Technology / Retail | 1 | $638B |
|
||
| Technology | 1 | $245B |
|
||
| Telecommunications | 1 | $38B |
|
||
| Food / Beverage | 1 | $36B |
|
||
| Automotive / Trucks | 1 | $34B |
|
||
Price history
-86.9% since first listed16 events — show timeline
- 2026-06-03 Listed $520,000 NWMLS as Distributed by MLS Grid
- 2021-10-14 Sold (MLS) $420,000 NWMLS as Distributed by MLS Grid
- 2021-09-23 Pending — NWMLS as Distributed by MLS Grid
- 2021-09-22 Listed $419,900 NWMLS as Distributed by MLS Grid
- 2017-08-14 Sold (MLS) $302,900 NWMLS as Distributed by MLS Grid
- 2017-06-28 Pending — NWMLS as Distributed by MLS Grid
- 2017-06-16 Relisted — NWMLS as Distributed by MLS Grid
- 2017-06-06 Pending — NWMLS as Distributed by MLS Grid
- 2017-05-25 Relisted — NWMLS as Distributed by MLS Grid
- 2017-05-25 Pending — NWMLS as Distributed by MLS Grid
- 2017-05-12 Relisted — NWMLS as Distributed by MLS Grid
- 2017-03-30 Pending — NWMLS as Distributed by MLS Grid
- 2017-03-23 Relisted — NWMLS as Distributed by MLS Grid
- 2017-03-02 Pending — NWMLS as Distributed by MLS Grid
- 2017-02-16 Listed $305,900 NWMLS as Distributed by MLS Grid
- 2015-08-26 Sold (Public Records) $3,960,000 Public Records
Property tax history
+21.1%/yrLatest (2026): $5,132 · +5.7% YoY. Source: county tax records.
Cash-flow waterfall
monthlySold comps — $/sqft
last 12 mo · ≤1 miLoading sold comps…