 7-Plex
1704 N Ash St · Spokane, WA
Flood risk 1/10 · Minimal
- FEMA flood zone
- X (unshaded)
- Chance of flooding over 30 yrs
- 0.0%
- Est. flood insurance / yr
- $473 – $860
Fire risk 5/10 · Moderate
- Est. fire insurance / yr
- $604 – $1,122
Heat risk 3/10 · Minor
- Hot days now (above 94°F)
- 7 days/yr
- Hot days in 30 yrs
- 15 days/yr
Wind risk 1/10 · Minimal
- Chance of severe wind over 30 yrs
- —
Air-quality risk 10/10 · Severe
- Unhealthy air days now
- 19 days/yr
- Unhealthy air days in 30 yrs
- 21 days/yr
Risk factors via First Street. Map © Google.
Why this score? — see what drove the B grade
The composite is a weighted blend of 9 inputs, each scored 0–100. Each bar is that input's sub-score; the figure is the points it added to the 100-point composite (weight × sub-score).
- Cash flow +30.0/30.0
- 1% rule +10.0/10.0
- DSCR +10.0/10.0
- ARV discount +7.5/15.0
- Schools +4.6/10.0
- Livability +4.0/5.0
- Rent growth +3.3/5.0
- Condition / age +2.5/5.0
- Appreciation +0.0/10.0
$520,000
🖨 Deal sheet (PDF) 📄 Offer letter ✓ Due diligence
Multi-family units
County records classify this as Multi-Family (5+ Unit). Listing-text estimate: 7 units. confirmed
5+ unit building — per-unit beds/baths from public records are typically unavailable; the breakdown below (if shown) is an estimate from the listing text.
Listing remarks MLS
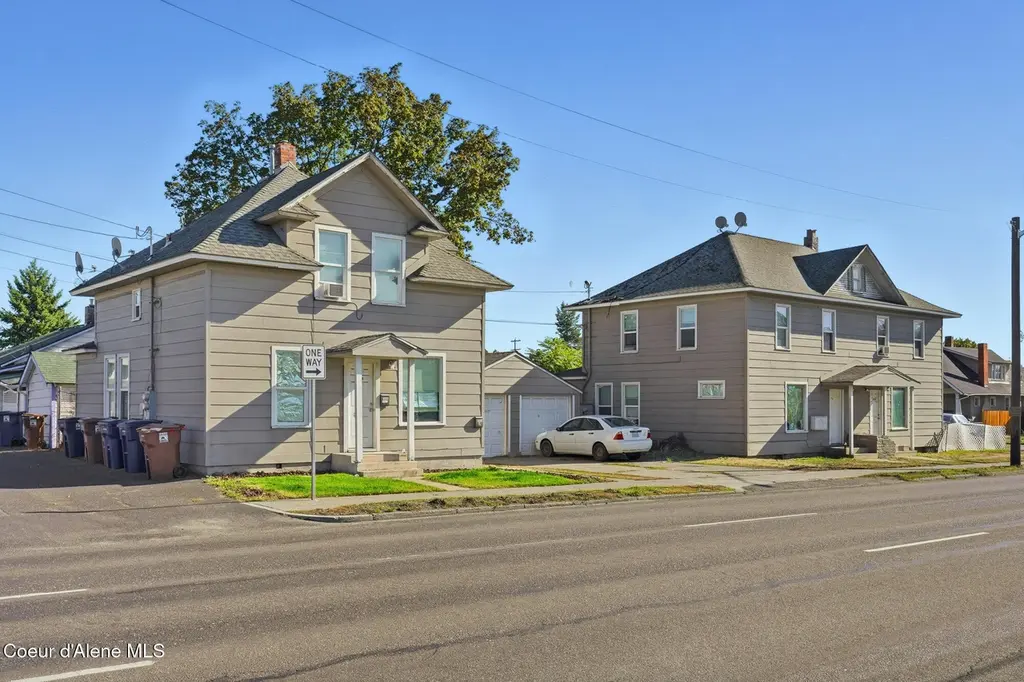
Ash Apartments is a well-located 7-unit value-add apartment community in Spokane's West Central neighborhood, offering immediate cash flow with a clear path to enhanced long-term returns through light interior upgrades and operational improvements. The property consists of two charming buildings and has benefited from nearly $115,000 in recent capital improvements including new electrical service and panels, upgraded windows, new siding and exterior paint, interior paint, LVP flooring, and a new furnace, significantly reducing near-term capital needs. The asset is ideally positioned for continued income growth through updated interiors and refreshed common areas, and its proximity to Downtown Spokane, Gonzaga University, transit, parks, and major employers supports strong and durable rental demand, making it an attractive opportunity for investors seeking a stabilized core holding with meaningful upside.
Key facts
- New furnace
- New siding
- New windows
Tags
Property features AI
Finance
- Other: Coin-op laundry amenity for residents
- Financial info: Property listed for cash or conventional financing; Total of 7 units in the building; Gross scheduled income approximately $73,732 annually; Gross adjusted income approximately $70,100 annually; Total monthly income reported about $5,249; Net operating income approximately $37,948; Total annual expenses approximately $32,152; Typical annual expenses listed: fuel $2,559; electric $2,559; insurance $2,270; other expenses $17,660; Gross rent multiplier about 7.05; Reported vacancy rate around 4%
Exterior
- Parking: Detached or on-site garage space for 2 vehicles (900 sq ft garage reported)
- Utilities: Electric energy source; Public water (City of Spokane); Sewer connected (City of Spokane); Power provided by Avista
- Home design: Multi-family residential income property; Property subtype: Multi Family (5-9 units style code); Two-story building; Built circa 1911 (effective year)
- Construction: Wood construction; Composition roof; Poured concrete foundation; Effective year built 1911
- Exterior features: Wood exterior; Corner lot with alley access; Curbs, paved streets and sidewalks; Has a view
Interior
- Kitchen: Each unit includes a range/oven; Most units include a refrigerator; Dishwashers not provided in units
- Bedrooms: Up to 8 possible bedrooms across the property; Unit mix includes one 2-bedroom unit and six 1-bedroom units
- Flooring: Laminate flooring in portions of the building; Carpet in portions of the building
- Bathrooms: Each unit features 1 bathroom
- Heating & cooling: Forced air heating; No cooling system reported
- Interior features: Laminate and carpet flooring; Forced air heating; No central cooling
- Laundry & utility: Coin-operated laundry available (on-site); Individual units do not include washer/dryer hookups
Neighborhood map
What this means for you Summary
Snapshot
- This is a 7 × 8-bed/7.0-bath units multifamily listed at $520k.
Deal economics
- At list price, monthly cash flow is $6k ($69k/yr) — positive. Per door: $825/mo.
- The deal already cash-flows at list — no discount required.
- Meets the 1% rule at list price ($11k rent vs $520k).
- Recommended offer: $458k (12.0% below list) — sets the bar for market timing.
- Cap rate 19.6% vs local median 3.2% in Spokane — top-decile yield for the area; either an underpriced asset or a hidden risk that comps aren't pricing in. Stress-test before assuming the spread holds.
Location & tenants
- Location reads 80/100 on livability (#93 in WA, #1,822 nationally) — a professional / high-income tenant draw. Strengths: amenities A+, commute A+, housing A+; Watch: crime F.
- Spokane School District (urban): math 47% / reading 58% proficiency, ranked #136 of 291 in WA (top 47%) — acceptable for families but not a draw, mixed tenant base, ~2y average lease.
- Market conditions: Rents rising (+3.2%/yr); 324 active listings in the ZIP; 18 comparable units currently listed for rent nearby; rentals at typical pace (median 24d on market — plan ~3-4 weeks tenant-placement turnaround); solid renter incomes; 3,608 units permitted in Spokane County in 2024 (1,792 in 5+ unit buildings).
- At $11,491/mo this rent would consume 178% of the median local household income ($77k/yr) (locally 965% of renters already pay >50% of income on rent) — very limited rent-growth headroom before tenants either downsize or default.
Forward outlook
- Local home prices are declining (-3.0%/yr); year-one equity from $4k of loan paydown is wiped out by about $16k of value loss. Plan a longer hold.
- Spokane County population projected at +13% by 2050 — modest demand growth; plan on rents tracking national, not racing it.
- At projected returns (-3.0% appreciation + 3.2% rent growth), your $146k cash investment doubles in ~3 years — after that, you're playing with house money.
Negotiation context
- It's been on market 162 days — a 12% lower offer ($458k) is reasonable based on typical stale-listing flexibility.
- 11 sale attempts since 26y ago with the ask held roughly flat each time — persistent listings suggest the price (not the market) is what's stuck; bring a comps-based counter.
- Current owner paid $169k; list at $520k implies a 208% gain — meaningful room to come down on a strong offer.
Risks & watch-outs
- Watch-outs: built in 1911 — expect roof / HVAC / electrical / plumbing capex.
- Climate carrying-cost: moderate wildfire risk — expect insurance premiums to compound above CPI over the hold.
Questions for the listing agent
- It's been on market 162 days. Have you received any prior offers? Is the seller open to a 12% concession, seller financing, or rate buy-down credit?
- Can we see the unit-by-unit rent roll, current vacancy, and any below-market leases? What's the average tenancy length?
- What capital expenditures (roof, boiler, parking lot, exteriors) have been made in the last 5 years, and what's planned in the next 2?
- Built in 1911 — when were the roof, HVAC, electrical panel, plumbing, and water heater last replaced?
- Why hasn't it sold? Are there any deal-killer items the seller is aware of (foundation, flood, title, zoning, code violations)?
- Is there a deadline driving the sale (1031 exchange, divorce, estate, relocation)? That informs how much negotiation room exists.
- Schools are B-rated — typically a magnet for longer-tenancy family renters. What's the average tenant stay here, and is there a school-zone premium baked into asking?
- Crime grade is F in this area — have there been break-ins, vandalism, or insurance claims at this property in the last 3 years? What carrier currently insures it and at what premium?
- What's the average days-on-market for RENTAL listings here right now (not sales)? A rising rental-DOM trend means longer vacancies and softer asking-rent achievability than the comps imply.
- What's the recent tenant-quality profile in this submarket — average credit score on applications, eviction rate, late-payment / NSF rate, and stable-employment percentage? A property-management company in the area should have these aggregated.
- How much new apartment / multifamily construction is in the pipeline within 1–3 miles? Heavy new supply (>2% of stock underway) typically softens rents 12–24 months out; light construction supports rent growth.
Investment metrics
- 1% rule
- 2.21% ✓
- Cap rate
- 19.61%
- Cash-on-cash
- 47.57%
- DSCR
- 3.12
- GRM
- 3.8
CMA / ARV
- ARV (on-the-fly)
- $162,582
- Comps found
- 1
Show comp detail 1 sale within ~0.75 mi
| Address | Dist | Beds/Ba | Sqft | Sold | Price | $/sf | Match |
|---|---|---|---|---|---|---|---|
| 2007 N Wall St | 0.71mi | 2/1.0 (-1) | 1,154 (+4%) | 16mo | $170,000 | $147 | 37 |
Match score weights: distance 35% · size 25% · config 20% · recency 20%. Top-matched comps best support the ARV.
Projected returns pro-forma
-3.0% appreciation · 3.23% rent growth · sell at horizon
- IRR
- 45.2%
- Equity multiple
- 2.96×
- Total profit
- $286,048
- Equity at exit
- $77,534
- IRR
- 51.2%
- Equity multiple
- 6.04×
- Total profit
- $733,466
- Equity at exit
- $44,960
Cash invested: $145,600 (down + closing). Projections, not guarantees.
Landlord ↔ Tenant lean methodology
- Overall (STATE)
- 28 Tenant-Leaning
- State Washington
- 28 Tenant-Leaning · D+8
- County
- — inherits STATE
- City
- — inherits STATE
ZIP-level market 99205
- Rents YoY
- 3.2%
- Active inventory
- 324
- Price-to-rent
- 26.4×
Monthly cashflow live
- Estimated rent
- $11,491 medium interval (Pro) →
- Mortgage (P&I)
- −$2,727
- Tax from tax record
- −$362 /mo · $4,342/yr
- Insurance
- −$217
- HOA
- −$0
- Vacancy / Maint / Mgmt
- −$2,413
- Net cashflow
- $5,772
Break-even live
Sensitivity live
| Price | -10% $6,067 | -5% $5,920 | +0% $5,772 | +5% $5,625 | +10% $5,478 |
|---|---|---|---|---|---|
| Rent | -10% $4,865 | -5% $5,319 | +0% $5,772 | +5% $6,226 | +10% $6,680 |
| Rate | -1.0pp $6,034 | -0.5pp $5,905 | base $5,772 | +0.5pp $5,638 | +1.0pp $5,501 |
7-unit breakdown (identical units grouped — click to expand)
| Units | Beds | Baths | Est. rent |
|---|---|---|---|
| 7× units | 8 | 7 | $11,494 |
| #1 | 8 | 7 | $1,642 |
| #2 | 8 | 7 | $1,642 |
| #3 | 8 | 7 | $1,642 |
| #4 | 8 | 7 | $1,642 |
| #5 | 8 | 7 | $1,642 |
| #6 | 8 | 7 | $1,642 |
| #7 | 8 | 7 | $1,642 |
| Total (7 units) | $11,491 | ||
UW: 25.0% down · 7.5% · 30yr · 1.5% tax · 5.0% vac · 8.0% maint · 8.0% mgmt
Financing live
Cash to close
- Down payment
- $130,000
- Closing costs
- $15,600
- Reserves months
- —
- Total cash needed
- —
Loan-product check · same deal, 3 products live
Conventional
25% down · 7.5% · 30yr
- Down + closing
- —
- Monthly P&I
- —
- Monthly cashflow
- —
- DSCR
- —
- Eligible?
- —
Personal DTI + credit; lowest rate.
DSCR
20% down · 8.5% · 30yr
- Down + closing
- —
- Monthly P&I
- —
- Monthly cashflow
- —
- DSCR
- —
- Eligible?
- —
No personal income docs; deal must DSCR.
Hard money
10% down · 12.0% · 12mo
- Down + closing
- —
- Monthly P&I
- —
- Monthly cashflow
- —
- DSCR
- —
- Eligible?
- —
Short-term bridge; refi at stabilization.
Rent comps 18 comps
| Address | Beds | Baths | Sqft | Rent | $/sqft | DOM | Units | Dist |
|---|---|---|---|---|---|---|---|---|
| 1611 W Augusta Ave Spokane, WA | 3.0 | 3.0 | 1477 | $1,995 | $1.35 | 24d | 1 | 0.04mi |
| 1802 W Sharp Ave Spokane, WA | 2.0 | 1.0 | 895 | $1,195 | $1.34 | 24d | 1 | 0.28mi |
| 1515 W Sharp Ave Spokane, WA | 2.0 | 1.0 | 720 | $895 | $1.24 | 24d | 1 | 0.33mi |
| 1718 W Boone Ave Unit 4 Spokane, WA | 2.0 | 1.0 | 780 | $1,250 | $1.60 | 14d | 1 | 0.33mi |
| 1318 W Mallon Ave Unit 302 Spokane, WA | 2.0 | 1.0 | 750 | $1,150 | $1.53 | 24d | 1 | 0.57mi |
| 1310 W College Ave Spokane, WA | 2.0 | 2.0 | 805 | $1,890 | $2.35 | 24d | 1 | 0.68mi |
| 1916 N Wall St Unit 1924 Spokane, WA | 2.0 | 1.5 | 1170 | $1,750 | $1.50 | 14d | 1 | 0.74mi |
| 2612 W Dean Ave Spokane, WA | 2.0 | 1.0 | 1181 | $2,400 | $2.03 | 14d | 1 | 0.77mi |
| 1224 W Riverside Ave Unit 808 Spokane, WA | 2.0 | 1.5 | 935 | $2,250 | $2.41 | 24d | 1 | 1.06mi |
| 2136 W Riverside Ave Spokane, WA | 2.0 | 1.0 | 590 | $1,300 | $2.20 | 14d | 9 | 1.11mi |
| 3027 W Cleveland Ave Spokane, WA | 3.0 | 2.0 | 1100 | $2,500 | $2.27 | 14d | 1 | 1.18mi |
| 155 S Oak St Spokane, WA | 1.0–2.0 | 1.0 | 825 | $1,180 | $1.43 | 24d | 1 | 1.27mi |
| 7 S Howard St Unit 406 Spokane, WA | 2.0 | 2.0 | 1072 | $1,950 | $1.82 | 24d | 1 | 1.35mi |
| 2315 W 2nd Ave Spokane, WA | 1.0–2.0 | 1.0 | 669 | $1,399 | $2.09 | 24d | 2 | 1.37mi |
| 101 S Stevens St Unit 303 Spokane, WA | 2.0 | 1.0 | 975 | $1,600 | $1.64 | 24d | 1 | 1.42mi |
| 206 W Riverside Ave Spokane, WA | 2.0 | 1.0–2.0 | 649 | $1,775 | $2.73 | 14d | 11 | 1.47mi |
| 714 W Kiernan Ave Unit A Spokane, WA | 2.0 | 1.0 | 1160 | $1,195 | $1.03 | 24d | 1 | 1.48mi |
| 139 W Gray Ct Unit 110 Spokane, WA | 2.0 | 1.0 | 935 | $1,295 | $1.39 | 24d | 1 | 1.48mi |
Listing history 37 events
-
2026-06-18days on market $520,000 Active 162 DOM
-
2026-06-17days on market $520,000 Active 161 DOM
-
2026-06-16days on market $520,000 Active 160 DOM
-
2026-06-15days on market $520,000 Active 159 DOM
-
2026-06-14days on market $520,000 Active 157 DOM
-
2026-06-10days on market $520,000 Active 154 DOM
-
2026-06-09days on market $520,000 Active 153 DOM
-
2026-06-08days on market $520,000 Active 152 DOM
-
2026-06-07days on market $520,000 Active 151 DOM
-
2026-06-03days on market $520,000 Active 147 DOM
-
2026-06-02days on market $520,000 Active 146 DOM
-
2026-06-01days on market $520,000 Active 145 DOM
-
2026-05-31days on market $520,000 Active 144 DOM
-
2026-05-31days on market $520,000 Active 143 DOM
-
2026-05-13$520,000 Active 917-char remark
Show marketing remark (917 chars)
Ash Apartments is a well-located 7-unit value-add apartment community in Spokane's West Central neighborhood, offering immediate cash flow with a clear path to enhanced long-term returns through light interior upgrades and operational improvements. The property consists of two charming buildings and has benefited from nearly $115,000 in recent capital improvements including new electrical service and panels, upgraded windows, new siding and exterior paint, interior paint, LVP flooring, and a new furnace, significantly reducing near-term capital needs. The asset is ideally positioned for continued income growth through updated interiors and refreshed common areas, and its proximity to Downtown Spokane, Gonzaga University, transit, parks, and major employers supports strong and durable rental demand, making it an attractive opportunity for investors seeking a stabilized core holding with meaningful upside.
-
2026-03-13$520,000 Active 923-char remark
Show marketing remark (923 chars)
Ash Apartments is a well-located 7-unit value-add apartment community in Spokane’s West Central neighborhood, offering immediate cash flow with a clear path to enhanced long-term returns through light interior upgrades and operational improvements. The property consists of two charming buildings and has benefited from nearly $115,000 in recent capital improvements including new electrical service and panels, upgraded windows, new siding and exterior paint, interior paint, LVP flooring, and a new furnace, significantly reducing near-term capital needs. The asset is ideally positioned for continued income growth through updated interiors and refreshed common areas, and its proximity to Downtown Spokane, Gonzaga University, transit, parks, and major employers supports strong and durable rental demand, making it an attractive opportunity for investors seeking a stabilized core holding with meaningful upside.
-
2026-03-12price $520,000
-
2026-01-07$550,000 Active
-
2024-01-13historical $900
-
2023-12-13$900
-
2013-05-15soldstatus $169,000
-
2008-10-01historical
-
2008-08-16$235,000
-
2008-04-29historical
-
2008-03-28$225,000
-
2008-01-01historical
-
2007-10-31$230,000
-
2007-07-17historical
-
2007-06-16$245,000
-
2007-04-01historical
-
2007-01-30$275,000
-
2002-12-17soldstatus $110,010
-
2002-12-13soldstatus $110,010
-
2001-09-21$107,000
-
2000-12-22historical
-
2000-05-22$119,850
-
1992-09-24soldstatus $128,000
ⓘ Source: listings_history table (triggers on properties + properties_extension) + one-shot
backfill from property_details.listing_events for pre-trigger history.
Tax reassessment forecast WA · Resets to sale price
- Current annual tax
- $4,342 · $362/mo
- Projected year-2 tax
- $5,096 · $425/mo
- Expected delta
- +$754/yr (+$63/mo · 17.4%)
ⓘ Screening estimate from a state-policy table — verify with the county assessor before closing.
Climate risk First Street
- Flood 1/10 Low FEMA zone X (unshaded) · 0% chance over 30 yrs
- Wildfire 5/10 Major
- Heat 3/10 Moderate 7 d/yr ≥94°F today · 15 d/yr by 30 yrs out
- Wind 1/10 Low
- Air quality 10/10 Extreme 19 unhealthy d/yr today · 21 by 30 yrs out
Nearby sold comps map
Loading sold comps map…
Walkable amenities ~0.75 mi
Loading nearby amenities…
Taxation est. · year 1
- Rental income
- $137,892
- − Mortgage interest
- −$29,128
- − Property taxes
- −$4,342
- − Insurance
- −$2,600
- − Repairs & maintenance
- −$11,031
- − Management
- −$11,031
- − Depreciation
- −$15,127
- Taxable income
- $64,632
- Est. tax owed @ 24.0%
- −$15,512
- After-tax cash flow
- $53,758/yr
For passive investors: Depreciation is non-cash, so a rental often shows a tax loss while cash-flowing — sheltering income. Rental losses are passive: they offset passive income freely, and up to $25,000/yr can offset ordinary (W-2) income if you actively participate and your MAGI is under $100k (phasing out to $0 by $150k); unused losses carry forward. On sale, claimed depreciation is recaptured at up to 25%, and gains may owe capital-gains tax (a 1031 exchange can defer both). Figures are a year-1 estimate at your 24.0% rate — not tax advice; consult a CPA.
Schools (NCES district)
- District
- Spokane School District
- NCES district ID
- 5308250
- Math proficiency
- 47% ▲ 1.00%
- Reading proficiency
- 58% ▲ 1.00%
- Median HH income
- $43,187
- Composite
- 46.1/100
- National rank
- #5477
- State rank
- #136 of 291 in WA
Livability — Spokane
- Score
- 80/100
- State rank
- #93
- US rank
- #1822
Category grades
Schools grade is shown separately in the Schools card above.
Census & demographics
- Census place
- Spokane, WA
- County
- Spokane County · 496,401 people
- City population
- 298,820
- Metro
- Spokane-Spokane Valley, WA
- Population (ZIP)
- 43,169
- Household income
- $77,374
- Rent vs Own
- Severe rent burden
- 965.0
Population outlook (Spokane County) Hauer SSP2
- Today (2025)
- 531,314 people
- By 2030
- 549,278 · +3.4%
- By 2040
- 577,822 · +8.8%
- By 2050
- 598,188 · +12.6%
- By 2075
- 630,744 · +18.7%
- By 2100
- 622,360 · +17.1%
Race, ethnicity, and origin ACS 2023
- Neighborhood character
- Predominantly White (81%)
- Race & ethnicity
- White 81% Two or more races 10% Hispanic / Latino 7% Asian 2% Black 1% Native American 1%
- Hispanic origin (detail)
- Mexican 4%
- Common ancestry
- Portuguese 5% Slovak 3% Romanian 2%
- Foreign-born
- 3% · Canada, Philippines
- Languages at home
- 94% English-only · Spanish 2% Other Asian/Pacific 1% Russian/Polish/Slavic 1%
Political lean MEDSL · Spokane
- 2024 margin
- Toss-up / Even · D 46.0% · R 51.0% · Other 3.0%
- 2008→2024 swing
- -3.8pp toward R · 2008: -1.1pp · 2024: -5.0pp
- All cycles
- 2024: R+5.0 2020: R+4.3 2016: R+8.3 2012: R+6.3 2008: R+1.1
Not yet ingested
- Civics
- —
Market trends
- HPI YoY
- ▼ -475.69%
- Current HPI
- 377.1519
- Rent YoY
- ▲ 3.23%
- Metro
- Spokane-Spokane Valley, WA
- State GDP YoY
- ▲ 4.65%
- F500 in state
- 22
Industry mix (Fortune 500 HQ in WA)
| Industry | F500 HQs | Revenue |
|---|---|---|
| Retail | 2 | $269B |
|
||
| Technology / Retail | 1 | $638B |
|
||
| Technology | 1 | $245B |
|
||
| Telecommunications | 1 | $38B |
|
||
| Food / Beverage | 1 | $36B |
|
||
| Automotive / Trucks | 1 | $34B |
|
||
Price history
+306.2% since first listed23 events — show timeline
- 2026-05-13 Listed $520,000 CDAMLS
- 2026-03-13 Listed $520,000 SPOKANEMLS as Distributed by MLS Grid
- 2026-03-12 Price Changed $520,000 NWMLS as Distributed by MLS Grid
- 2026-01-07 Listed $550,000 NWMLS as Distributed by MLS Grid
- 2024-01-13 Rental Removed $900 APPFOLIO
- 2023-12-13 Listed for Rent $900 APPFOLIO
- 2013-05-15 Sold (Public Records) $169,000 Public Records
- 2008-10-01 Listing Removed — SPOKANEMLS as Distributed by MLS Grid
- 2008-08-16 Listed $235,000 SPOKANEMLS as Distributed by MLS Grid
- 2008-04-29 Listing Removed — SPOKANEMLS as Distributed by MLS Grid
- 2008-03-28 Listed $225,000 SPOKANEMLS as Distributed by MLS Grid
- 2008-01-01 Listing Removed — SPOKANEMLS as Distributed by MLS Grid
- 2007-10-31 Listed $230,000 SPOKANEMLS as Distributed by MLS Grid
- 2007-07-17 Listing Removed — SPOKANEMLS as Distributed by MLS Grid
- 2007-06-16 Listed $245,000 SPOKANEMLS as Distributed by MLS Grid
- 2007-04-01 Listing Removed — SPOKANEMLS as Distributed by MLS Grid
- 2007-01-30 Listed $275,000 SPOKANEMLS as Distributed by MLS Grid
- 2002-12-17 Sold (MLS) $110,010 SPOKANEMLS as Distributed by MLS Grid
- 2002-12-13 Sold (Public Records) $110,010 Public Records
- 2001-09-21 Listed $107,000 SPOKANEMLS as Distributed by MLS Grid
- 2000-12-22 Listing Removed — SPOKANEMLS as Distributed by MLS Grid
- 2000-05-22 Listed $119,850 SPOKANEMLS as Distributed by MLS Grid
- 1992-09-24 Sold (Public Records) $128,000 Public Records
Property tax history
+5.1%/yrLatest (2026): $4,342 · -4.5% YoY. Source: county tax records.
Cash-flow waterfall
monthlySold comps — $/sqft
last 12 mo · ≤1 miLoading sold comps…