1059 Holley St · Loxley, AL
Flood risk 1/10 · Minimal
- FEMA flood zone
- X (unshaded)
- Chance of flooding over 30 yrs
- 0.0%
- Est. flood insurance / yr
- $507 – $1,088
Fire risk 2/10 · Minimal
- Est. fire insurance / yr
- $916 – $1,700
Heat risk 9/10 · Severe
- Hot days now (above 105°F)
- 7 days/yr
- Hot days in 30 yrs
- 21 days/yr
Wind risk 9/10 · Severe
- Chance of severe wind over 30 yrs
- 99.0%
Air-quality risk 4/10 · Minor
- Unhealthy air days now
- 3 days/yr
- Unhealthy air days in 30 yrs
- 5 days/yr
Risk factors via First Street. Map © Google.
Why this score? — see what drove the B grade
The composite is a weighted blend of 9 inputs, each scored 0–100. Each bar is that input's sub-score; the figure is the points it added to the 100-point composite (weight × sub-score).
- Cash flow +28.5/30.0
- ARV discount +15.0/15.0
- DSCR +10.0/10.0
- 1% rule +7.9/10.0
- Schools +3.9/10.0
- Livability +3.3/5.0
- Condition / age +2.8/5.0
- Rent growth +2.5/5.0
- Appreciation +0.0/10.0
$139,900
🖨 Deal sheet 📄 Offer letter ✓ Due diligence
Listing remarks
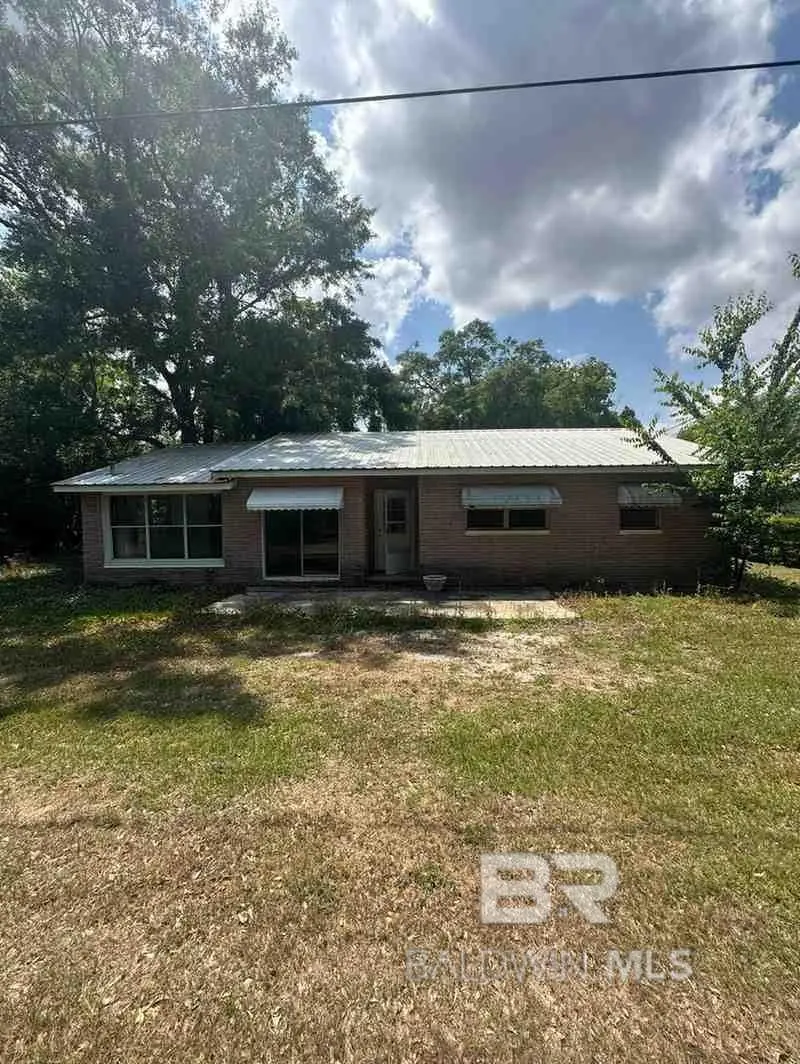
PRIME LIVE/WORK OPPORTUNITY IN THE HEART OF LOXLEY!3BR/1.5BA brick home with a durable metal roof, ideally located in a high-visibility area. This unique property offers the perfect setup for a small business, office space, or mixed-use investment. The home is in overall good condition but could benefit from some TLC—making it a great value-add opportunity to customize for your needs. Solid brick construction and a functional layout provide a foundation whether you’re looking to renovate for business use, rental income, or a combination of both. Positioned in the center of Loxley, this property offers excellent potential for entrepreneurs and investors alike. Don’t miss th
Key facts
- Flexible property
- Functional layout
- Commercial zoning
Tags
Property features AI
Finance
- Other: Whole/full ownership
- HOA & community: No transfer fees; Community features: other
Exterior
- Parking: See remarks for parking information
- Utilities: Utilities: see remarks
- Home design: One-story residence; Resale property
- Construction: Brick construction; Metal roof; Slab foundation; Built area recorded as 1,458 square feet (assessor)
- Exterior features: See remarks for lot and other exterior details; Other waterfront features (see remarks)
Interior
- Kitchen: Other appliances (see remarks)
- Flooring: Other floors (see remarks)
- Bathrooms: 1 full bathroom
- Heating & cooling: Heating present (see remarks for details)
- Interior features: No fireplace; See remarks for additional interior details
Neighborhood map
What this means for you Summary
Snapshot
- This is a 3-bed/1.0-bath single-family listed at $140k. Condition is rated average.
Deal economics
- At list price, monthly cash flow is $459 ($6k/yr) — positive.
- The deal already cash-flows at list — no discount required.
- Meets the 1% rule at list price ($2k rent vs $140k).
- Recommended offer: $136k (3.0% below list) — sets the bar for market timing.
- Cap rate 10.2% vs local median 4.1% in Loxley — top-decile yield for the area; either an underpriced asset or a hidden risk that comps aren't pricing in. Stress-test before assuming the spread holds.
Location & tenants
- Location reads 66/100 on livability (#95 in AL) — a middle-class / working-renter tenant base. Strengths: housing A+, cost of living A, employment B; Watch: crime D, amenities F, commute F.
- Baldwin County (rural): math 33% / reading 57% proficiency, ranked #18 of 129 in AL (top 14%) — families likely to look elsewhere, expect single-tenant / working-renter base with shorter leases.
- Zoned schools: Loxley Elementary School (math 22% / reading 49%, grade F, #288 of 627 statewide, top 46%, 482 students, 65% FRL); Central Baldwin Middle School (math 17% / reading 49%, grade F, #101 of 257 statewide, top 40%, 757 students, 74% FRL); Baldwin County High School (math 19% / reading 27%, grade F, #140 of 305 statewide, top 46%, 1,039 students, 66% FRL) — zoned schools average 68% FRL vs 38% district-wide (30 pts higher); higher-poverty schools than district average — tighter screening recommended.
- Zoned-school proficiency averages 30% at this address vs 45% district-wide (-14 pts) — the specific schools serving this property underperform the Baldwin County average; the district grade overstates school quality for this exact location.
- Market conditions: 166 active listings in the ZIP; 3,883 units permitted in Baldwin County in 2024 (481 in 5+ unit buildings).
Forward outlook
- Local home prices are declining (-3.0%/yr); year-one equity from $967 of loan paydown is wiped out by about $4k of value loss. Plan a longer hold.
- Baldwin County population projected at +42% by 2050 — long-run rental-demand tailwind backs the buy-and-hold thesis.
- At projected returns (-3.0% appreciation + 3.0% rent growth), your $39k cash investment doubles in ~9 years — after that, you're playing with house money.
Negotiation context
- It's been on market 43 days — a 3% lower offer ($136k) is reasonable based on typical stale-listing flexibility.
Risks & watch-outs
- Watch-outs: built in 1957 — expect roof / HVAC / electrical / plumbing capex.
- Climate carrying-cost: severe wind risk, 99% chance of damaging wind over 30y; extreme-heat days projected 7→21/yr by 2055 (HVAC capex compounding) — expect insurance premiums to compound above CPI over the hold.
Questions for the listing agent
- It's been on market 43 days. Have you received any prior offers? Is the seller open to a 3% concession, seller financing, or rate buy-down credit?
- Built in 1957 — when were the roof, HVAC, electrical panel, plumbing, and water heater last replaced?
- Is there a deadline driving the sale (1031 exchange, divorce, estate, relocation)? That informs how much negotiation room exists.
- Schools are D-rated, which usually means shorter tenancies and higher turnover. Who's the typical renter profile here, and what's been the actual vacancy rate?
- Crime grade is D in this area — have there been break-ins, vandalism, or insurance claims at this property in the last 3 years? What carrier currently insures it and at what premium?
- What's the average days-on-market for RENTAL listings here right now (not sales)? A rising rental-DOM trend means longer vacancies and softer asking-rent achievability than the comps imply.
- What's the recent tenant-quality profile in this submarket — average credit score on applications, eviction rate, late-payment / NSF rate, and stable-employment percentage? A property-management company in the area should have these aggregated.
- How much new for-sale + rental construction is in the pipeline within 1–3 miles? Heavy new supply typically softens prices + rents 12–24 months out; constrained supply supports both.
Investment metrics
- 1% rule
- 1.29% ✓
- Cap rate
- 10.23%
- Cash-on-cash
- 14.07%
- DSCR
- 1.63
- GRM
- 6.5
CMA / ARV
- ARV (on-the-fly)
- $252,234
- Comps found
- 9
Show comp detail 9 sales within ~0.75 mi
| Address | Dist | Beds/Ba | Sqft | Sold | Price | $/sf | Match |
|---|---|---|---|---|---|---|---|
| 2022 W Union Ave | 0.37mi | 3/2.0 | 1,560 (+7%) | 2mo | $294,500 | $189 | 65 |
| 1059 N Alabama St | 0.18mi | 3/2.0 | 1,532 (+5%) | 18mo | $195,000 | $127 | 64 |
| 2018 W Union Ave | 0.37mi | 3/2.0 | 1,560 (+7%) | 8mo | $300,000 | $192 | 60 |
| 3154 S Holley St | 0.23mi | 3/2.0 | 1,329 (-9%) | 14mo | $240,000 | $181 | 59 |
| 4165 W Relham Dr | 0.42mi | 3/1.0 | 1,355 (-7%) | 14mo | $175,000 | $129 | 57 |
| 83 Fincher Ln | 0.55mi | 4/2.0 (+1) | 1,382 (-5%) | 2mo | $239,000 | $173 | 55 |
| 1103 N Cedar St | 0.23mi | 3/1.0 | 1,280 (-12%) | 19mo | $139,500 | $109 | 53 |
| 120 W Northgate Dr | 0.58mi | 3/2.0 | 1,269 (-13%) | 1mo | $219,000 | $173 | 47 |
| 15364 County Road 66 | 0.65mi | 3/2.0 | 1,665 (+14%) | 10mo | $260,000 | $156 | 34 |
Match score weights: distance 35% · size 25% · config 20% · recency 20%. Top-matched comps best support the ARV.
Projected returns pro-forma
-3.0% appreciation · 3.0% rent growth · sell at horizon
- IRR
- 4.4%
- Equity multiple
- 1.17×
- Total profit
- $6,603
- Equity at exit
- $20,860
- IRR
- 13.9%
- Equity multiple
- 2.11×
- Total profit
- $43,518
- Equity at exit
- $12,096
Cash invested: $39,172 (down + closing). Projections, not guarantees.
Landlord ↔ Tenant lean methodology
- Overall (STATE)
- 90 Strongly Landlord-Friendly
- State Alabama
- 90 Strongly Landlord-Friendly · R+15
- County
- — inherits STATE
- City
- — inherits STATE
ZIP-level market 36551
- Home prices YoY
- -19.6%
- Active inventory
- 166
- Price-to-rent
- 6.5×
Monthly cashflow live
- Estimated rent
- $1,805 medium interval (Pro) →
- Mortgage (P&I)
- −$734
- Tax est. 1.5%
- −$175 /mo · $2,098/yr
- Insurance
- −$58
- HOA
- −$0
- Vacancy / Maint / Mgmt
- −$379
- Net cashflow
- $459
Break-even live
UW: 25.0% down · 7.5% · 30yr · 1.5% tax · 5.0% vac · 8.0% maint · 8.0% mgmt
Financing live
Cash to close
- Down payment
- $34,975
- Closing costs
- $4,197
- Reserves months
- —
- Total cash needed
- —
Loan-product check · same deal, 3 products live
Conventional
25% down · 7.5% · 30yr
- Down + closing
- —
- Monthly P&I
- —
- Monthly cashflow
- —
- DSCR
- —
- Eligible?
- —
Personal DTI + credit; lowest rate.
DSCR
20% down · 8.5% · 30yr
- Down + closing
- —
- Monthly P&I
- —
- Monthly cashflow
- —
- DSCR
- —
- Eligible?
- —
No personal income docs; deal must DSCR.
Hard money
10% down · 12.0% · 12mo
- Down + closing
- —
- Monthly P&I
- —
- Monthly cashflow
- —
- DSCR
- —
- Eligible?
- —
Short-term bridge; refi at stabilization.
Listing history 7 events
-
2026-06-19days on market $139,900 Active 43 DOM
-
2026-06-18days on market $139,900 Active 42 DOM
-
2026-06-17days on market $139,900 Active 41 DOM
-
2026-06-16days on market $139,900 Active 40 DOM
-
2026-06-15days on market $139,900 Active 39 DOM
-
2026-06-14remarks 681-char remark
-
2026-06-14$139,900 Active 37 DOM
ⓘ Source: listings_history table (triggers on properties + properties_extension) + one-shot
backfill from property_details.listing_events for pre-trigger history.
Climate risk First Street
- Flood 1/10 Low FEMA zone X (unshaded) · 0% chance over 30 yrs
- Wildfire 2/10 Low
- Heat 9/10 Extreme 7 d/yr ≥105°F today · 21 d/yr by 30 yrs out
- Wind 9/10 Extreme 99% chance of damaging wind over 30 yrs
- Air quality 4/10 Moderate 3 unhealthy d/yr today · 5 by 30 yrs out
Nearby sold comps map
Loading sold comps map…
Walkable amenities ~0.75 mi
Loading nearby amenities…
Taxation est. · year 1
- Rental income
- $21,661
- − Mortgage interest
- −$7,837
- − Property taxes
- −$2,098
- − Insurance
- −$700
- − Repairs & maintenance
- −$1,733
- − Management
- −$1,733
- − Depreciation
- −$4,070
- Taxable income
- $3,491
- Est. tax owed @ 24.0%
- −$838
- After-tax cash flow
- $4,672/yr
For passive investors: Depreciation is non-cash, so a rental often shows a tax loss while cash-flowing — sheltering income. Rental losses are passive: they offset passive income freely, and up to $25,000/yr can offset ordinary (W-2) income if you actively participate and your MAGI is under $100k (phasing out to $0 by $150k); unused losses carry forward. On sale, claimed depreciation is recaptured at up to 25%, and gains may owe capital-gains tax (a 1031 exchange can defer both). Figures are a year-1 estimate at your 24.0% rate — not tax advice; consult a CPA.
Condition & rehab AI · 12 photos
This 3-bedroom, 1-bathroom home in Loxley, AL, offers a solid foundation for a prime live/work opportunity. While in average condition, it requires moderate repairs and maintenance to enhance its resale and rental value.
Repairs flagged
- Minor exterior paint — some wear
- Minor interior paint — simple paint
- Moderate HVAC system — basic ceiling fan
Value-add opportunities
- Both paint exterior and interior — enhances curb appeal and interior aesthetics
- Both upgrade HVAC system — improves comfort and energy efficiency
- Both landscaping — enhances curb appeal and property value
Renovation cost estimate screening
| Repair item | Severity | Est. cost |
|---|---|---|
| exterior paint · some wear | Minor | $500–3,000 |
| interior paint · simple paint | Minor | $500–3,000 |
| HVAC system · basic ceiling fan | Moderate | $3,000–15,000 |
| Total estimated repair cost · 3 items | $4,000–21,000 |
Value-add ROI direction
- Both paint exterior and interior — enhances curb appeal and interior aesthetics ↑
- Both upgrade HVAC system — improves comfort and energy efficiency ↑
- Both landscaping — enhances curb appeal and property value ↑
ⓘ Cost ranges are severity-bucket heuristics (US national rule-of-thumb). Get contractor quotes + a written scope before underwriting a rehab budget.
Schools (NCES district)
- District
- Baldwin County
- NCES district ID
- 0100270
- Math proficiency
- 33% ▼ -26.00%
- Reading proficiency
- 57% ▲ 1.00%
- Median HH income
- $50,677
- Composite
- 38.61/100
- National rank
- #4157
- State rank
- #18 of 129 in AL
Livability — Loxley
- Score
- 66/100
- State rank
- #95
- US rank
- #11346
Category grades
Schools grade is shown separately in the Schools card above.
Census & demographics
- Census place
- Loxley, AL
- Population (ZIP)
- 12,915
Population outlook (Baldwin County) Hauer SSP2
- Today (2025)
- 248,264 people
- By 2030
- 270,315 · +8.9%
- By 2040
- 312,967 · +26.1%
- By 2050
- 352,262 · +41.9%
- By 2075
- 438,841 · +76.8%
- By 2100
- 487,736 · +96.5%
Race, ethnicity, and origin ACS 2023
- Neighborhood character
- Predominantly White (75%)
- Race & ethnicity
- White 75% Black 15% Hispanic / Latino 6% Two or more races 3% Asian 1%
- Hispanic origin (detail)
- Mexican 3% Puerto Rican 2%
- Common ancestry
- Italian 1% Lithuanian 1% Slovak 1%
- Foreign-born
- 1%
- Languages at home
- 98% English-only · Spanish 1% German/W. Germanic 1%
Political lean MEDSL · Baldwin
- 2024 margin
- Solid R (+58.2) · D 20.5% · R 78.7%
- 2008→2024 swing
- -6.7pp toward R · 2008: -51.5pp · 2024: -58.2pp
- All cycles
- 2024: R+58.2 2020: R+53.8 2016: R+57.8 2012: R+55.8 2008: R+51.5
Not yet ingested
- Civics
- —
Market trends
- HPI YoY
- ▼ -71.18%
- Current HPI
- 291.8584
- Rent YoY
- —
- Metro
- —
- State GDP YoY
- ▲ 2.94%
- F500 in state
- 4
Industry mix (Fortune 500 HQ in AL)
| Industry | F500 HQs | Revenue |
|---|---|---|
| Financial Services | 1 | $8B |
|
||
| Healthcare | 1 | $5B |
|
||
Price history
-6.7% since first listed2 events — show timeline
- 2026-05-18 Price Changed $139,900 BCAR
- 2026-05-07 Listed $149,900 BCAR
Cash-flow waterfall
monthlySold comps — $/sqft
last 12 mo · ≤1 miLoading sold comps…