106 Forest Ave · Weaver, AL
Flood risk 1/10 · Minimal
- FEMA flood zone
- X (unshaded)
- Chance of flooding over 30 yrs
- 0.0%
- Est. flood insurance / yr
- $507 – $1,088
Fire risk 5/10 · Moderate
- Est. fire insurance / yr
- $916 – $1,700
Heat risk 6/10 · Moderate
- Hot days now (above 106°F)
- 7 days/yr
- Hot days in 30 yrs
- 19 days/yr
Wind risk 5/10 · Moderate
- Chance of severe wind over 30 yrs
- 25.0%
Air-quality risk 3/10 · Minor
- Unhealthy air days now
- 2 days/yr
- Unhealthy air days in 30 yrs
- 3 days/yr
Risk factors via First Street. Map © Google.
Why this score? — see what drove the C grade
The composite is a weighted blend of 9 inputs, each scored 0–100. Each bar is that input's sub-score; the figure is the points it added to the 100-point composite (weight × sub-score).
- Cash flow +24.9/30.0
- DSCR +8.1/10.0
- ARV discount +7.5/15.0
- 1% rule +6.5/10.0
- Livability +3.2/5.0
- Schools +2.9/10.0
- Rent growth +2.5/5.0
- Condition / age +2.2/5.0
- Appreciation +0.0/10.0
$85,500
🖨 Deal sheet 📄 Offer letter ✓ Due diligence
Listing remarks MLS
INVESTMENT OPPORTUNITY! Great Rental History! Start your PORTFOLIO now your future is now!
Key facts
- 0.81 acre lot
- Built 1955
- Listed 100 days
Neighborhood map
What this means for you Summary
Snapshot
- This is a 2-bed/2.0-bath other listed at $86k. Condition is rated fair.
Deal economics
- At list price, monthly cash flow is $184 ($2k/yr) — positive.
- The deal already cash-flows at list — no discount required.
- Meets the 1% rule at list price ($981 rent vs $86k).
- Recommended offer: $78k (9.0% below list) — sets the bar for market timing.
- Cap rate 8.9% vs local median 6.6% in Weaver — top-decile yield for the area; either an underpriced asset or a hidden risk that comps aren't pricing in. Stress-test before assuming the spread holds.
Location & tenants
- Location reads 63/100 on livability (#195 in AL) — a middle-class / working-renter tenant base. Strengths: cost of living A+, housing A+; Watch: employment C-, schools D-, amenities F.
- Calhoun County (rural): math 19% / reading 49% proficiency, ranked #46 of 129 in AL (top 36%) — families likely to look elsewhere, expect single-tenant / working-renter base with shorter leases.
- Market conditions: 30 active listings in the ZIP; 135 units permitted in Calhoun County in 2024 (0 in 5+ unit buildings).
Forward outlook
- Local home prices are declining (-3.0%/yr); year-one equity from $591 of loan paydown is wiped out by about $3k of value loss. Plan a longer hold.
- Calhoun County population projected at -21% by 2050 — secular population decline; favor cash flow + early exit over multi-decade hold.
Negotiation context
- It's been on market 101 days — a 9% lower offer ($78k) is reasonable based on typical stale-listing flexibility.
Risks & watch-outs
- Watch-outs: built in 1955 — expect roof / HVAC / electrical / plumbing capex.
- Climate carrying-cost: moderate wind risk, 25% chance of damaging wind over 30y; moderate wildfire risk; extreme-heat days projected 7→19/yr by 2055 (HVAC capex compounding) — expect insurance premiums to compound above CPI over the hold.
Questions for the listing agent
- It's been on market 101 days. Have you received any prior offers? Is the seller open to a 9% concession, seller financing, or rate buy-down credit?
- Have any recent inspections been done? Can we get a copy of the seller's disclosures and any deferred-maintenance estimates?
- Built in 1955 — when were the roof, HVAC, electrical panel, plumbing, and water heater last replaced?
- Why hasn't it sold? Are there any deal-killer items the seller is aware of (foundation, flood, title, zoning, code violations)?
- Is there a deadline driving the sale (1031 exchange, divorce, estate, relocation)? That informs how much negotiation room exists.
- Schools are D-rated, which usually means shorter tenancies and higher turnover. Who's the typical renter profile here, and what's been the actual vacancy rate?
- What's the average days-on-market for RENTAL listings here right now (not sales)? A rising rental-DOM trend means longer vacancies and softer asking-rent achievability than the comps imply.
- What's the recent tenant-quality profile in this submarket — average credit score on applications, eviction rate, late-payment / NSF rate, and stable-employment percentage? A property-management company in the area should have these aggregated.
- How much new for-sale + rental construction is in the pipeline within 1–3 miles? Heavy new supply typically softens prices + rents 12–24 months out; constrained supply supports both.
Investment metrics
- 1% rule
- 1.15% ✓
- Cap rate
- 8.88%
- Cash-on-cash
- 9.22%
- DSCR
- 1.41
- GRM
- 7.3
CMA / ARV
No comps found within radius.
Projected returns pro-forma
-3.0% appreciation · 3.0% rent growth · sell at horizon
- IRR
- -2.3%
- Equity multiple
- 0.91×
- Total profit
- $-2,120
- Equity at exit
- $12,748
- IRR
- 7.4%
- Equity multiple
- 1.56×
- Total profit
- $13,306
- Equity at exit
- $7,392
Cash invested: $23,940 (down + closing). Projections, not guarantees.
Landlord ↔ Tenant lean methodology
- Overall (STATE)
- 90 Strongly Landlord-Friendly
- State Alabama
- 90 Strongly Landlord-Friendly · R+15
- County
- — inherits STATE
- City
- — inherits STATE
ZIP-level market 36277
- Home prices YoY
- -17.7%
- Active inventory
- 30
- Price-to-rent
- 7.3×
Monthly cashflow live
- Estimated rent
- $981 medium interval (Pro) →
- Mortgage (P&I)
- −$448
- Tax est. 1.5%
- −$107 /mo · $1,282/yr
- Insurance
- −$36
- HOA
- −$0
- Vacancy / Maint / Mgmt
- −$206
- Net cashflow
- $184
Break-even live
UW: 25.0% down · 7.5% · 30yr · 1.5% tax · 5.0% vac · 8.0% maint · 8.0% mgmt
Financing live
Cash to close
- Down payment
- $21,375
- Closing costs
- $2,565
- Reserves months
- —
- Total cash needed
- —
Loan-product check · same deal, 3 products live
Conventional
25% down · 7.5% · 30yr
- Down + closing
- —
- Monthly P&I
- —
- Monthly cashflow
- —
- DSCR
- —
- Eligible?
- —
Personal DTI + credit; lowest rate.
DSCR
20% down · 8.5% · 30yr
- Down + closing
- —
- Monthly P&I
- —
- Monthly cashflow
- —
- DSCR
- —
- Eligible?
- —
No personal income docs; deal must DSCR.
Hard money
10% down · 12.0% · 12mo
- Down + closing
- —
- Monthly P&I
- —
- Monthly cashflow
- —
- DSCR
- —
- Eligible?
- —
Short-term bridge; refi at stabilization.
Listing history 18 events
-
2026-06-19days on market $85,500 Active 101 DOM
-
2026-06-18days on market $85,500 Active 100 DOM
-
2026-06-17days on market $85,500 Active 99 DOM
-
2026-06-16days on market $85,500 Active 98 DOM
-
2026-06-15days on market $85,500 Active 97 DOM
-
2026-06-14days on market $85,500 Active 95 DOM
-
2026-06-13days on market $85,500 Active 94 DOM
-
2026-06-10days on market $85,500 Active 92 DOM
-
2026-06-09days on market $85,500 Active 91 DOM
-
2026-06-08days on market $85,500 Active 90 DOM
-
2026-06-07days on market $85,500 Active 89 DOM
-
2026-06-05days on market $85,500 Active 86 DOM
-
2026-06-03days on market $85,500 Active 85 DOM
-
2026-06-02days on market $85,500 Active 84 DOM
-
2026-06-01days on market $85,500 Active 83 DOM
-
2026-05-31days on market $85,500 Active 82 DOM
-
2026-05-30days on market $85,500 Active 81 DOM
-
2026-03-10$85,500 Active 90-char remark
Show marketing remark (90 chars)
INVESTMENT OPPORTUNITY! Great Rental History! Start your PORTFOLIO now your future is now!
ⓘ Source: listings_history table (triggers on properties + properties_extension) + one-shot
backfill from property_details.listing_events for pre-trigger history.
Climate risk First Street
- Flood 1/10 Low FEMA zone X (unshaded) · 0% chance over 30 yrs
- Wildfire 5/10 Major
- Heat 6/10 Major 7 d/yr ≥106°F today · 19 d/yr by 30 yrs out
- Wind 5/10 Major 25% chance of damaging wind over 30 yrs
- Air quality 3/10 Moderate 2 unhealthy d/yr today · 3 by 30 yrs out
Nearby sold comps map
Loading sold comps map…
Walkable amenities ~0.75 mi
Loading nearby amenities…
Taxation est. · year 1
- Rental income
- $11,770
- − Mortgage interest
- −$4,789
- − Property taxes
- −$1,282
- − Insurance
- −$428
- − Repairs & maintenance
- −$942
- − Management
- −$942
- − Depreciation
- −$2,487
- Taxable income
- $901
- Est. tax owed @ 24.0%
- −$216
- After-tax cash flow
- $1,992/yr
For passive investors: Depreciation is non-cash, so a rental often shows a tax loss while cash-flowing — sheltering income. Rental losses are passive: they offset passive income freely, and up to $25,000/yr can offset ordinary (W-2) income if you actively participate and your MAGI is under $100k (phasing out to $0 by $150k); unused losses carry forward. On sale, claimed depreciation is recaptured at up to 25%, and gains may owe capital-gains tax (a 1031 exchange can defer both). Figures are a year-1 estimate at your 24.0% rate — not tax advice; consult a CPA.
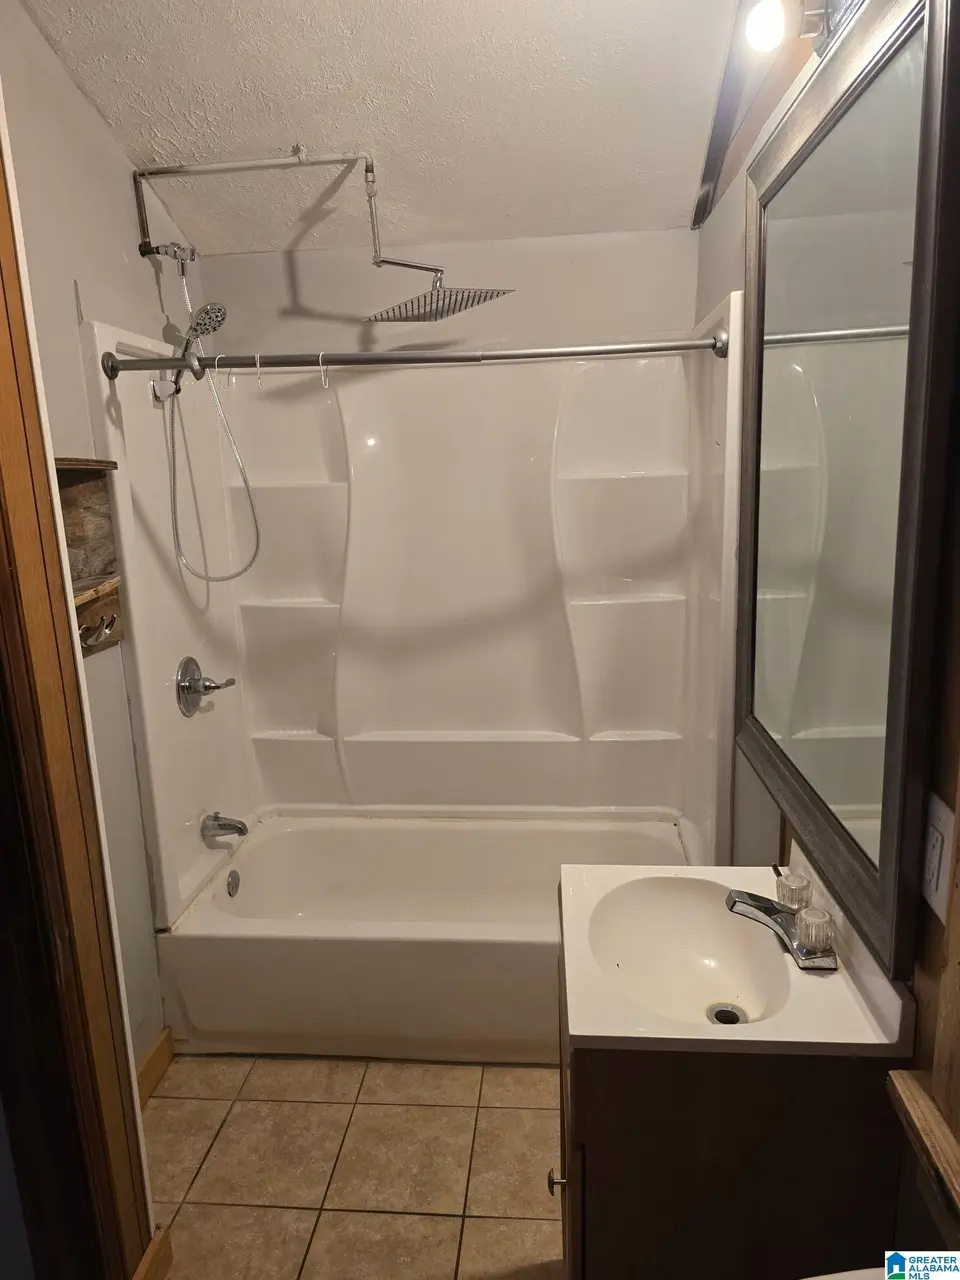
Condition & rehab AI · 13 photos
The home is in fair condition with some moderate repairs needed in the kitchen and bathroom. It has potential for significant value increase with updates to the interior walls, flooring, and HVAC systems.
Repairs flagged
- Minor kitchen countertops — Some wear is visible on the countertops.
- Minor bathroom shower/tub — The shower/tub combo appears to be in fair condition.
Value-add opportunities
- Resale paint interior walls — Fresh paint can make a significant difference in the home's appearance and appeal to potential buyers.
- Resale replace linoleum or vinyl flooring — New flooring can improve the home's overall appearance and make it more appealing to potential buyers.
- Both upgrade HVAC and mechanical systems — Upgrading these systems can improve the home's comfort and energy efficiency, which can increase both resale and rental value.
Renovation cost estimate screening
| Repair item | Severity | Est. cost |
|---|---|---|
| kitchen countertops · Some wear is visible on the countertops. | Minor | $500–3,000 |
| bathroom shower/tub · The shower/tub combo appears to be in fair condition. | Minor | $500–3,000 |
| Total estimated repair cost · 2 items | $1,000–6,000 |
Value-add ROI direction
- Resale paint interior walls — Fresh paint can make a significant difference in the home's appearance and appeal to potential buyers. ↑
- Resale replace linoleum or vinyl flooring — New flooring can improve the home's overall appearance and make it more appealing to potential buyers. ↑
- Both upgrade HVAC and mechanical systems — Upgrading these systems can improve the home's comfort and energy efficiency, which can increase both resale and rental value. ↑
ⓘ Cost ranges are severity-bucket heuristics (US national rule-of-thumb). Get contractor quotes + a written scope before underwriting a rehab budget.
Schools (NCES district)
- District
- Calhoun County
- NCES district ID
- 0100540
- Math proficiency
- 19% ▼ -26.00%
- Reading proficiency
- 49% ▬ 0.00%
- Median HH income
- $44,891
- Composite
- 28.91/100
- National rank
- #6635
- State rank
- #46 of 129 in AL
Livability — Weaver
- Score
- 63/100
- State rank
- #195
- US rank
- #15696
Category grades
Schools grade is shown separately in the Schools card above.
Census & demographics
- Census place
- Weaver, AL
- City population
- 5,153
- Population (ZIP)
- 5,153
Population outlook (Calhoun County) Hauer SSP2
- Today (2025)
- 109,765 people
- By 2030
- 105,708 · -3.7%
- By 2040
- 96,192 · -12.4%
- By 2050
- 86,413 · -21.3%
- By 2075
- 63,467 · -42.2%
- By 2100
- 44,704 · -59.3%
Race, ethnicity, and origin ACS 2023
- Neighborhood character
- Predominantly White (76%)
- Race & ethnicity
- White 76% Black 16% Hispanic / Latino 5% Two or more races 3%
- Hispanic origin (detail)
- Mexican 4%
- Common ancestry
- Italian 3% Portuguese 2% Slovak 2%
- Foreign-born
- 2% · Canada, South Korea
- Languages at home
- 97% English-only · Spanish 2%
Political lean MEDSL · Calhoun
- 2024 margin
- Solid R (+44.8) · D 27.2% · R 71.9%
- 2008→2024 swing
- -12.2pp toward R · 2008: -32.5pp · 2024: -44.8pp
- All cycles
- 2024: R+44.8 2020: R+39.0 2016: R+41.4 2012: R+31.9 2008: R+32.5
Not yet ingested
- Civics
- —
Market trends
- HPI YoY
- ▼ -41.96%
- Current HPI
- 195.0725
- Rent YoY
- —
- Metro
- —
- State GDP YoY
- ▲ 2.94%
- F500 in state
- 4
Industry mix (Fortune 500 HQ in AL)
| Industry | F500 HQs | Revenue |
|---|---|---|
| Financial Services | 1 | $8B |
|
||
| Healthcare | 1 | $5B |
|
||
Price history
1 event — show timeline
- 2026-03-10 Listed $85,500 Greater Alabama MLS
Cash-flow waterfall
monthlySold comps — $/sqft
last 12 mo · ≤1 miLoading sold comps…