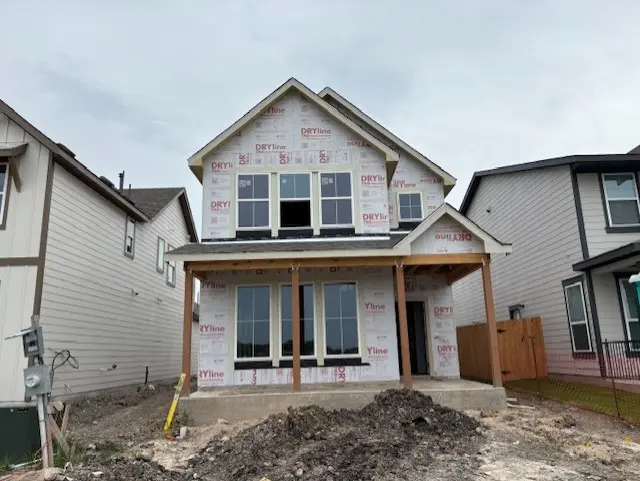
112 Hartson Dr · Taylor, TX
Flood risk No data
- FEMA flood zone
- —
- Chance of flooding over 30 yrs
- —
- Est. flood insurance / yr
- —
Fire risk No data
- Est. fire insurance / yr
- —
Heat risk No data
- Hot days now (above threshold)
- —
- Hot days in 30 yrs
- —
Wind risk No data
- Chance of severe wind over 30 yrs
- —
Air-quality risk No data
- Unhealthy air days now
- —
- Unhealthy air days in 30 yrs
- —
Risk factors via First Street. Map © Google.
Why this score? — see what drove the C- grade
The composite is a weighted blend of 9 inputs, each scored 0–100. Each bar is that input's sub-score; the figure is the points it added to the 100-point composite (weight × sub-score).
- Cash flow +16.6/30.0
- ARV discount +15.0/15.0
- DSCR +5.2/10.0
- 1% rule +3.7/10.0
- Livability +3.6/5.0
- Rent growth +2.6/5.0
- Condition / age +2.5/5.0
- Schools +2.0/10.0
- Appreciation +0.0/10.0
$264,990
🖨 Deal sheet (PDF) 📄 Offer letter ✓ Due diligence
Listing remarks MLS
The Only Premier Builder offering the most included features within 5 miles of Samsung. This thoughtfully designed home showcases numerous upgrades throughout, including enhanced flooring with upgraded LVP and plush carpet, stylish upgraded tile, and elevated hardware finishes that add a touch of sophistication to every space. Enjoy the convenience of a pre-plumbed water softener loop and the rare advantage of being the only new build in Taylor offering natural gas—great for cooking enthusiasts and energy efficiency. With quality craftsmanship and high-end features included, this home stands out as a must-see opportunity in a rapidly growing area.
Key facts
- Upgraded lvp
- Plush carpet
- Natural gas
Tags
Neighborhood map
What this means for you Summary
Snapshot
- This is a 3-bed/2.5-bath other listed at $265k.
Deal economics
- At list price, monthly cash flow is $160 ($2k/yr) — positive.
- The deal already cash-flows at list — no discount required.
- To meet the 1% rule (rent ≥ 1% of price), the offer needs to be $230k (13.0% below list).
- Recommended offer: $230k (13.0% below list) — sets the bar for 1% rule.
- Cap rate 7.0% vs local median 4.3% in Taylor — top-decile yield for the area; either an underpriced asset or a hidden risk that comps aren't pricing in. Stress-test before assuming the spread holds.
Location & tenants
- Location reads 71/100 on livability (#312 in TX) — a middle-class / working-renter tenant base. Strengths: cost of living A+, housing A+; Watch: employment C-, amenities F, commute F.
- Taylor ISD (town): math 20% / reading 27% proficiency, ranked #726 of 826 in TX (top 88%) — low school quality limits family demand, transient renter base, plan for 1-2y turnover; 61% free/reduced lunch — lower-income household profile, screen leases tightly.
- Zoned schools: Naomi Pasemann El (math 12% / reading 22%, grade F, #3,836 of 4,322 statewide, top 91%, 649 students, 68% FRL); Taylor Middle (math 16% / reading 25%, grade F, #1,407 of 1,662 statewide, top 86%, 651 students, 69% FRL); Taylor H S (math 17% / reading 27%, grade F, #1,366 of 1,632 statewide, top 84%, 907 students, 61% FRL).
- Market conditions: Rents flat; 319 active listings in the ZIP; 6 comparable units currently listed for rent nearby; rentals leasing fast (median 13d on market — plan ~1-2 weeks tenant-placement turnaround); solid renter incomes; 7,543 units permitted in Williamson County in 2024 (1,425 in 5+ unit buildings).
- This rent runs 35% of the median local income ($79k/yr) — at the standard rent-burdened threshold; future hikes will face affordability resistance.
Forward outlook
- Local home prices are declining (-3.0%/yr); year-one equity from $2k of loan paydown is wiped out by about $8k of value loss. Plan a longer hold.
- Williamson County population projected at +69% by 2050 — long-run rental-demand tailwind backs the buy-and-hold thesis.
Negotiation context
- It's been on market 72 days — a 6% lower offer ($249k) is reasonable based on typical stale-listing flexibility.
Questions for the listing agent
- It's been on market 72 days. Have you received any prior offers? Is the seller open to a 13% concession, seller financing, or rate buy-down credit?
- What does the HOA fee cover, when was the last increase, and are there any pending special assessments or reserve-fund shortfalls?
- Why hasn't it sold? Are there any deal-killer items the seller is aware of (foundation, flood, title, zoning, code violations)?
- Is there a deadline driving the sale (1031 exchange, divorce, estate, relocation)? That informs how much negotiation room exists.
- Schools are D-rated, which usually means shorter tenancies and higher turnover. Who's the typical renter profile here, and what's been the actual vacancy rate?
- What's the average days-on-market for RENTAL listings here right now (not sales)? A rising rental-DOM trend means longer vacancies and softer asking-rent achievability than the comps imply.
- What's the recent tenant-quality profile in this submarket — average credit score on applications, eviction rate, late-payment / NSF rate, and stable-employment percentage? A property-management company in the area should have these aggregated.
- How much new for-sale + rental construction is in the pipeline within 1–3 miles? Heavy new supply typically softens prices + rents 12–24 months out; constrained supply supports both.
Investment metrics
- 1% rule
- 0.87% ✗
- Cap rate
- 7.02%
- Cash-on-cash
- 2.60%
- DSCR
- 1.12
- GRM
- 9.6
CMA / ARV
- ARV (median comp)
- $418,734
- List price
- $264,990
- Delta
- -36.72%
- Verdict
- UNDERPRICED
- Comps
- 20 within 1.0 mi
Projected returns pro-forma
-3.0% appreciation · 0.43% rent growth · sell at horizon
- IRR
- -14.9%
- Equity multiple
- 0.48×
- Total profit
- $-38,598
- Equity at exit
- $39,511
- IRR
- -10.8%
- Equity multiple
- 0.42×
- Total profit
- $-43,378
- Equity at exit
- $22,911
Cash invested: $74,197 (down + closing). Projections, not guarantees.
Landlord ↔ Tenant lean methodology
- Overall (STATE)
- 87 Strongly Landlord-Friendly
- State Texas
- 87 Strongly Landlord-Friendly · R+5
- County
- — inherits STATE
- City
- — inherits STATE
ZIP-level market 76574
- Home prices YoY
- -32.3%
- Rents YoY
- 0.4%
- Active inventory
- 319
- Price-to-rent
- 9.6×
Monthly cashflow live
- Estimated rent
- $2,304 high interval (Pro) →
- Mortgage (P&I)
- −$1,390
- Tax from tax record
- −$106 /mo · $1,269/yr
- Insurance
- −$110
- HOA
- −$54
- Vacancy / Maint / Mgmt
- −$484
- Net cashflow
- $160
Break-even live
Sensitivity live
| Price | -10% $310 | -5% $235 | +0% $160 | +5% $85 | +10% $10 |
|---|---|---|---|---|---|
| Rent | -10% $-22 | -5% $69 | +0% $160 | +5% $251 | +10% $343 |
| Rate | -1.0pp $294 | -0.5pp $228 | base $160 | +0.5pp $92 | +1.0pp $22 |
UW: 25.0% down · 7.5% · 30yr · 1.5% tax · 5.0% vac · 8.0% maint · 8.0% mgmt
Financing live
Cash to close
- Down payment
- $66,248
- Closing costs
- $7,950
- Reserves months
- —
- Total cash needed
- —
Loan-product check · same deal, 3 products live
Conventional
25% down · 7.5% · 30yr
- Down + closing
- —
- Monthly P&I
- —
- Monthly cashflow
- —
- DSCR
- —
- Eligible?
- —
Personal DTI + credit; lowest rate.
DSCR
20% down · 8.5% · 30yr
- Down + closing
- —
- Monthly P&I
- —
- Monthly cashflow
- —
- DSCR
- —
- Eligible?
- —
No personal income docs; deal must DSCR.
Hard money
10% down · 12.0% · 12mo
- Down + closing
- —
- Monthly P&I
- —
- Monthly cashflow
- —
- DSCR
- —
- Eligible?
- —
Short-term bridge; refi at stabilization.
Rent comps 6 comps
| Address | Beds | Baths | Sqft | Rent | $/sqft | DOM | Units | Dist |
|---|---|---|---|---|---|---|---|---|
| 119 Everglades Ave Taylor, TX | 3.0 | 2.5 | 3078 | $2,350 | $0.76 | 3d | 1 | 0.59mi |
| 1717 T H Johnson Dr Taylor, TX | 4.0 | 2.5 | 2450 | $2,600 | $1.06 | 0d | 1 | 0.62mi |
| 903 Grand Teton Trl Taylor, TX | 4.0 | 2.5 | 2962 | $2,295 | $0.77 | 13d | 1 | 0.67mi |
| 2804 Bull Run Apt B Taylor, TX | 2.0 | 1.5 | 4232 | $1,300 | $0.31 | 45d | 1 | 0.87mi |
| 1800 Grace St Taylor, TX | 4.0 | 3.5 | 2503 | $2,050 | $0.82 | 13d | 1 | 1.42mi |
| 1800 Grace St Taylor, TX | 3.0 | 2.0 | 2503 | $2,050 | $0.82 | 14d | 1 | 1.42mi |
HOA detail
- Monthly dues
- $54 · $648/yr
- Likely covers
- watergas
Listing history 17 events
-
2026-06-21days on market $264,990 Active 72 DOM
-
2026-06-18days on market $264,990 Active 69 DOM
-
2026-06-17pricedays on market $264,990 Active 68 DOM
-
2026-06-16days on market $269,990 Active 67 DOM
-
2026-06-15days on market $269,990 Active 66 DOM
-
2026-06-13days on market $269,990 Active 64 DOM
-
2026-06-09days on market $269,990 Active 60 DOM
-
2026-06-08days on market $269,990 Active 59 DOM
-
2026-06-07days on market $269,990 Active 58 DOM
-
2026-06-05days on market $269,990 Active 55 DOM
-
2026-06-03days on market $269,990 Active 54 DOM
-
2026-06-02days on market $269,990 Active 53 DOM
-
2026-06-01days on market $269,990 Active 52 DOM
-
2026-05-31days on market $269,990 Active 51 DOM
-
2026-05-12price $269,990 661-char remark
Show marketing remark (661 chars)
The Only Premier Builder offering the most included features within 5 miles of Samsung. This thoughtfully designed home showcases numerous upgrades throughout, including enhanced flooring with upgraded LVP and plush carpet, stylish upgraded tile, and elevated hardware finishes that add a touch of sophistication to every space. Enjoy the convenience of a pre-plumbed water softener loop and the rare advantage of being the only new build in Taylor offering natural gas—great for cooking enthusiasts and energy efficiency. With quality craftsmanship and high-end features included, this home stands out as a must-see opportunity in a rapidly growing area.
-
2026-04-22price $274,990 661-char remark
Show marketing remark (661 chars)
The Only Premier Builder offering the most included features within 5 miles of Samsung. This thoughtfully designed home showcases numerous upgrades throughout, including enhanced flooring with upgraded LVP and plush carpet, stylish upgraded tile, and elevated hardware finishes that add a touch of sophistication to every space. Enjoy the convenience of a pre-plumbed water softener loop and the rare advantage of being the only new build in Taylor offering natural gas—great for cooking enthusiasts and energy efficiency. With quality craftsmanship and high-end features included, this home stands out as a must-see opportunity in a rapidly growing area.
-
2026-04-10$282,990 Active 661-char remark
Show marketing remark (661 chars)
The Only Premier Builder offering the most included features within 5 miles of Samsung. This thoughtfully designed home showcases numerous upgrades throughout, including enhanced flooring with upgraded LVP and plush carpet, stylish upgraded tile, and elevated hardware finishes that add a touch of sophistication to every space. Enjoy the convenience of a pre-plumbed water softener loop and the rare advantage of being the only new build in Taylor offering natural gas—great for cooking enthusiasts and energy efficiency. With quality craftsmanship and high-end features included, this home stands out as a must-see opportunity in a rapidly growing area.
ⓘ Source: listings_history table (triggers on properties + properties_extension) + one-shot
backfill from property_details.listing_events for pre-trigger history.
Tax reassessment forecast TX · Resets to sale price
- Current annual tax
- $1,269 · $106/mo
- Projected year-2 tax
- $4,849 · $404/mo
- Expected delta
- +$3,581/yr (+$298/mo · 282.3%)
ⓘ Screening estimate from a state-policy table — verify with the county assessor before closing.
Nearby sold comps map
Loading sold comps map…
Walkable amenities ~0.75 mi
Loading nearby amenities…
Taxation est. · year 1
- Rental income
- $27,649
- − Mortgage interest
- −$14,844
- − Property taxes
- −$1,269
- − Insurance
- −$1,325
- − Repairs & maintenance
- −$2,212
- − Management
- −$2,212
- − HOA
- −$648
- − Depreciation
- −$7,709
- Taxable loss
- −$2,568
- Est. tax savings @ 24.0%
- +$616
- After-tax cash flow
- $2,542/yr
For passive investors: Depreciation is non-cash, so a rental often shows a tax loss while cash-flowing — sheltering income. Rental losses are passive: they offset passive income freely, and up to $25,000/yr can offset ordinary (W-2) income if you actively participate and your MAGI is under $100k (phasing out to $0 by $150k); unused losses carry forward. On sale, claimed depreciation is recaptured at up to 25%, and gains may owe capital-gains tax (a 1031 exchange can defer both). Figures are a year-1 estimate at your 24.0% rate — not tax advice; consult a CPA.
Schools (NCES district)
- District
- Taylor ISD
- NCES district ID
- 4842280
- Math proficiency
- 20% ▼ -15.00%
- Reading proficiency
- 27% ▼ -11.00%
- Median HH income
- $45,330
- Composite
- 20.35/100
- National rank
- #8606
- State rank
- #726 of 826 in TX
Livability — Taylor
- Score
- 71/100
- State rank
- #312
- US rank
- #7013
Category grades
Schools grade is shown separately in the Schools card above.
Census & demographics
- Census place
- Taylor, TX
- County
- Williamson County · 680,029 people
- City population
- 20,242
- Metro
- Austin-Round Rock-Georgetown, TX
- Population (ZIP)
- 20,242
- Household income
- $78,568
- Rent vs Own
- Severe rent burden
- 371.0
Population outlook (Williamson County) Hauer SSP2
- Today (2025)
- 699,027 people
- By 2030
- 795,537 · +13.8%
- By 2040
- 990,683 · +41.7%
- By 2050
- 1,184,292 · +69.4%
- By 2075
- 1,623,825 · +132.3%
- By 2100
- 1,924,153 · +175.3%
Race, ethnicity, and origin ACS 2023
- Neighborhood character
- Diverse neighborhood (Simpson 0.57)
- Race & ethnicity
- White 50% Hispanic / Latino 42% Two or more races 22% Black 5%
- Hispanic origin (detail)
- Mexican 37%
- Common ancestry
- Romanian 2% Italian 1% Lithuanian 1%
- Foreign-born
- 8% · Canada
- Languages at home
- 74% English-only · Spanish 23% Russian/Polish/Slavic 1%
Political lean MEDSL · Williamson
- 2024 margin
- Toss-up / Even · D 48.0% · R 50.4% · Other 1.6%
- 2008→2024 swing
- +10.6pp toward D · 2008: -13.0pp · 2024: -2.5pp
- All cycles
- 2024: R+2.5 2020: D+1.4 2016: R+9.9 2012: R+21.5 2008: R+13.0
Not yet ingested
- Civics
- —
Market trends
- HPI YoY
- ▼ -108.71%
- Current HPI
- 227.58
- Rent YoY
- ▲ 0.43%
- Metro
- Austin-Round Rock-Georgetown, TX
- State GDP YoY
- ▲ 3.95%
- F500 in state
- 110
Industry mix (Fortune 500 HQ in TX)
| Industry | F500 HQs | Revenue |
|---|---|---|
| Energy | 16 | $1,198B |
|
||
| Technology | 5 | $198B |
|
||
| Engineering / Construction | 4 | $72B |
|
||
| Energy Services | 3 | $60B |
|
||
| Utilities | 3 | $41B |
|
||
| Healthcare | 2 | $330B |
|
||
Price history
-4.6% since first listed3 events — show timeline
- 2026-05-12 Price Changed $269,990 Unlock MLS
- 2026-04-22 Price Changed $274,990 Unlock MLS
- 2026-04-10 Listed $282,990 Unlock MLS
Property tax history
+0.8%/yrLatest (2026): $1,269 · -14.1% YoY. Source: county tax records.
Cash-flow waterfall
monthlySold comps — $/sqft
last 12 mo · ≤1 miLoading sold comps…