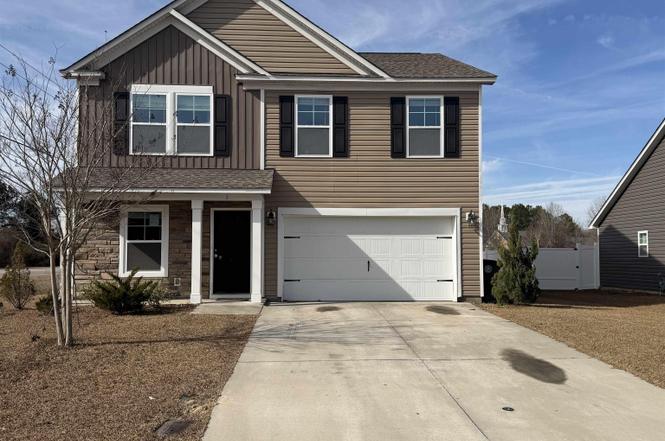
1 Carriagebrook Cir · Camden, SC
Flood risk No data
- FEMA flood zone
- —
- Chance of flooding over 30 yrs
- —
- Est. flood insurance / yr
- —
Fire risk No data
- Est. fire insurance / yr
- —
Heat risk No data
- Hot days now (above threshold)
- —
- Hot days in 30 yrs
- —
Wind risk No data
- Chance of severe wind over 30 yrs
- —
Air-quality risk No data
- Unhealthy air days now
- —
- Unhealthy air days in 30 yrs
- —
Risk factors via First Street. Map © Google.
Why this score? — see what drove the C grade
The composite is a weighted blend of 9 inputs, each scored 0–100. Each bar is that input's sub-score; the figure is the points it added to the 100-point composite (weight × sub-score).
- Cash flow +20.1/30.0
- ARV discount +14.9/15.0
- DSCR +6.4/10.0
- 1% rule +4.6/10.0
- Schools +3.8/10.0
- Livability +3.1/5.0
- Rent growth +2.5/5.0
- Condition / age +2.5/5.0
- Appreciation +0.0/10.0
$246,150
🖨 Deal sheet 📄 Offer letter ✓ Due diligence
Listing remarks
Welcome to this spacious and well-designed two-story home offering 5 bedrooms and 3 full bathrooms, perfectly suited for comfortable family living and entertaining. The main level features a convenient downstairs bedroom and full bath, ideal for guests, multi-generational living, or a private office. The heart of the home is the open-concept kitchen and living room, designed for both functionality and connection. The living area is anchored by a cozy fireplace, creating a warm focal point for gatherings, while the open layout allows for easy flow and natural light throughout. Upstairs, you’ll find the expansive primary suite along with three additional bedrooms, a spacious loft that c
Key facts
- Community lake
- Open-concept kitchen
- Large backyard
Tags
Neighborhood map
What this means for you Summary
Snapshot
- This is a 5-bed/3.0-bath single-family listed at $246k.
Deal economics
- At list price, monthly cash flow is $308 ($4k/yr) — positive.
- The deal already cash-flows at list — no discount required.
- To meet the 1% rule (rent ≥ 1% of price), the offer needs to be $236k (3.9% below list).
- Recommended offer: $231k (6.0% below list) — sets the bar for market timing.
- Cap rate 7.8% vs local median 3.8% in Camden — top-decile yield for the area; either an underpriced asset or a hidden risk that comps aren't pricing in. Stress-test before assuming the spread holds.
Location & tenants
- Location reads 61/100 on livability (#218 in SC) — a middle-class / working-renter tenant base. Strengths: cost of living A+, housing A+; Watch: employment D, crime F, amenities F.
- Kershaw 01 (rural): math 38% / reading 51% proficiency, ranked #25 of 80 in SC (top 31%) — families likely to look elsewhere, expect single-tenant / working-renter base with shorter leases.
- Zoned schools: Pine Tree Hill Elementary (math 40% / reading 51%, grade D-, #221 of 597 statewide, top 37%, 501 students, 73% FRL); Camden High (math 37% / reading 77%, grade C, #120 of 196 statewide, top 64%, 1,124 students, 71% FRL) — zoned schools average 72% FRL vs 49% district-wide (23 pts higher); higher-poverty schools than district average — tighter screening recommended.
- Market conditions: 231 active listings in the ZIP; 1 comparable units currently listed for rent nearby; 491 units permitted in Kershaw County in 2024 (0 in 5+ unit buildings).
Forward outlook
- Local home prices are declining (-3.0%/yr); year-one equity from $2k of loan paydown is wiped out by about $7k of value loss. Plan a longer hold.
- Kershaw County population projected at +8% by 2050 — modest demand growth; plan on rents tracking national, not racing it.
Negotiation context
- It's been on market 65 days — a 6% lower offer ($231k) is reasonable based on typical stale-listing flexibility.
- 2 sale attempts since 6y ago; this cycle's ask has dropped $27k (10%) from the opening price — seller is motivated, your offer sets the floor, not the list.
Questions for the listing agent
- It's been on market 65 days. Have you received any prior offers? Is the seller open to a 6% concession, seller financing, or rate buy-down credit?
- What does the HOA fee cover, when was the last increase, and are there any pending special assessments or reserve-fund shortfalls?
- Why hasn't it sold? Are there any deal-killer items the seller is aware of (foundation, flood, title, zoning, code violations)?
- Is there a deadline driving the sale (1031 exchange, divorce, estate, relocation)? That informs how much negotiation room exists.
- Schools are D-rated, which usually means shorter tenancies and higher turnover. Who's the typical renter profile here, and what's been the actual vacancy rate?
- Crime grade is F in this area — have there been break-ins, vandalism, or insurance claims at this property in the last 3 years? What carrier currently insures it and at what premium?
- What's the average days-on-market for RENTAL listings here right now (not sales)? A rising rental-DOM trend means longer vacancies and softer asking-rent achievability than the comps imply.
- What's the recent tenant-quality profile in this submarket — average credit score on applications, eviction rate, late-payment / NSF rate, and stable-employment percentage? A property-management company in the area should have these aggregated.
- How much new for-sale + rental construction is in the pipeline within 1–3 miles? Heavy new supply typically softens prices + rents 12–24 months out; constrained supply supports both.
Investment metrics
- 1% rule
- 0.96% ✗
- Cap rate
- 7.79%
- Cash-on-cash
- 5.36%
- DSCR
- 1.24
- GRM
- 8.7
CMA / ARV
- ARV (on-the-fly)
- $294,320
- Comps found
- 5
Show comp detail 5 sales within ~0.75 mi
| Address | Dist | Beds/Ba | Sqft | Sold | Price | $/sf | Match |
|---|---|---|---|---|---|---|---|
| 209 Carriagebrook Cir | 0.17mi | 5/3.0 | 2,245 (-1%) | 1mo | $300,000 | $134 | 90 |
| 22 Shoal Ct | 0.43mi | 5/3.0 | 2,264 (0%) | 7mo | $343,000 | $152 | 74 |
| 62 Carriagebrook Cir | 0.20mi | 5/3.0 | 2,245 (-1%) | 20mo | $269,900 | $120 | 73 |
| 45 Rapid Run Rd | 0.33mi | 4/2.5 (-1) | 2,248 (-1%) | 23mo | $293,000 | $130 | 58 |
| 253 & 253a Rush Ln | 0.56mi | 4/2.0 (-1) | 2,290 (+1%) | 8mo | $184,000 | $80 | 56 |
Match score weights: distance 35% · size 25% · config 20% · recency 20%. Top-matched comps best support the ARV.
Projected returns pro-forma
-3.0% appreciation · 3.0% rent growth · sell at horizon
- IRR
- -8.0%
- Equity multiple
- 0.70×
- Total profit
- $-20,346
- Equity at exit
- $36,702
- IRR
- 1.5%
- Equity multiple
- 1.11×
- Total profit
- $7,305
- Equity at exit
- $21,283
Cash invested: $68,922 (down + closing). Projections, not guarantees.
Landlord ↔ Tenant lean methodology
- Overall (STATE)
- 90 Strongly Landlord-Friendly
- State South Carolina
- 90 Strongly Landlord-Friendly · R+6
- County
- — inherits STATE
- City
- — inherits STATE
ZIP-level market 29020
- Home prices YoY
- -29.7%
- Active inventory
- 231
- Price-to-rent
- 8.7×
Monthly cashflow live
- Estimated rent
- $2,365 medium interval (Pro) →
- Mortgage (P&I)
- −$1,291
- Tax from tax record
- −$138 /mo · $1,660/yr
- Insurance
- −$103
- HOA
- −$29
- Vacancy / Maint / Mgmt
- −$497
- Net cashflow
- $308
Break-even live
UW: 25.0% down · 7.5% · 30yr · 1.5% tax · 5.0% vac · 8.0% maint · 8.0% mgmt
Financing live
Cash to close
- Down payment
- $61,538
- Closing costs
- $7,384
- Reserves months
- —
- Total cash needed
- —
Loan-product check · same deal, 3 products live
Conventional
25% down · 7.5% · 30yr
- Down + closing
- —
- Monthly P&I
- —
- Monthly cashflow
- —
- DSCR
- —
- Eligible?
- —
Personal DTI + credit; lowest rate.
DSCR
20% down · 8.5% · 30yr
- Down + closing
- —
- Monthly P&I
- —
- Monthly cashflow
- —
- DSCR
- —
- Eligible?
- —
No personal income docs; deal must DSCR.
Hard money
10% down · 12.0% · 12mo
- Down + closing
- —
- Monthly P&I
- —
- Monthly cashflow
- —
- DSCR
- —
- Eligible?
- —
Short-term bridge; refi at stabilization.
Rent comps 1 comps
| Address | Beds | Baths | Sqft | Rent | $/sqft | DOM | Units | Dist |
|---|---|---|---|---|---|---|---|---|
| 252 W Rapid Run Camden, SC | 5.0 | 3.0 | 2225 | $2,365 | $1.06 | 23d | 1 | 0.72mi |
HOA detail
- Monthly dues
- $29 · $348/yr
Listing history 5 events
-
2026-04-16status Pending
-
2026-03-18price $246,150
-
2026-02-09$273,500 Active
-
2021-01-18historical
-
2020-12-09$218,200 Active
ⓘ Source: listings_history table (triggers on properties + properties_extension) + one-shot
backfill from property_details.listing_events for pre-trigger history.
Tax reassessment forecast SC · Resets to sale price
- Current annual tax
- $1,660 · $138/mo
- Projected year-2 tax
- $1,660 · $138/mo
- Expected delta
- $0/yr ($0/mo · 0.0%)
ⓘ Screening estimate from a state-policy table — verify with the county assessor before closing.
Nearby sold comps map
Loading sold comps map…
Walkable amenities ~0.75 mi
Loading nearby amenities…
Taxation est. · year 1
- Rental income
- $28,380
- − Mortgage interest
- −$13,788
- − Property taxes
- −$1,660
- − Insurance
- −$1,231
- − Repairs & maintenance
- −$2,270
- − Management
- −$2,270
- − HOA
- −$348
- − Depreciation
- −$7,161
- Taxable loss
- −$349
- Est. tax savings @ 24.0%
- +$84
- After-tax cash flow
- $3,775/yr
For passive investors: Depreciation is non-cash, so a rental often shows a tax loss while cash-flowing — sheltering income. Rental losses are passive: they offset passive income freely, and up to $25,000/yr can offset ordinary (W-2) income if you actively participate and your MAGI is under $100k (phasing out to $0 by $150k); unused losses carry forward. On sale, claimed depreciation is recaptured at up to 25%, and gains may owe capital-gains tax (a 1031 exchange can defer both). Figures are a year-1 estimate at your 24.0% rate — not tax advice; consult a CPA.
Schools (NCES district)
- District
- Kershaw 01
- NCES district ID
- 4502550
- Math proficiency
- 38% ▼ -7.00%
- Reading proficiency
- 51% ▲ 6.00%
- Median HH income
- $44,585
- Composite
- 37.66/100
- National rank
- #4371
- State rank
- #25 of 80 in SC
Livability — Camden
- Score
- 61/100
- State rank
- #218
- US rank
- #18355
Category grades
Schools grade is shown separately in the Schools card above.
Census & demographics
- Census place
- Camden, SC
- Population (ZIP)
- 22,868
Population outlook (Kershaw County) Hauer SSP2
- Today (2025)
- 67,683 people
- By 2030
- 69,374 · +2.5%
- By 2040
- 71,936 · +6.3%
- By 2050
- 73,292 · +8.3%
- By 2075
- 75,762 · +11.9%
- By 2100
- 72,620 · +7.3%
Race, ethnicity, and origin ACS 2023
- Neighborhood character
- Majority White (62%)
- Race & ethnicity
- White 62% Black 28% Hispanic / Latino 6% Two or more races 3%
- Hispanic origin (detail)
- Mexican 5%
- Common ancestry
- Serbian 2% Slovak 2% Italian 1%
- Foreign-born
- 4% · Canada
- Languages at home
- 93% English-only · Spanish 6%
Political lean MEDSL · Kershaw
- 2024 margin
- Strong R (+28.2) · D 35.3% · R 63.5% · Other 1.2%
- 2008→2024 swing
- -9.5pp toward R · 2008: -18.7pp · 2024: -28.2pp
- All cycles
- 2024: R+28.2 2020: R+23.1 2016: R+24.8 2012: R+18.6 2008: R+18.7
Not yet ingested
- Civics
- —
Market trends
- HPI YoY
- ▼ -95.81%
- Current HPI
- 227.0389
- Rent YoY
- —
- Metro
- —
- State GDP YoY
- ▲ 4.51%
- F500 in state
- 2
Industry mix (Fortune 500 HQ in SC)
| Industry | F500 HQs | Revenue |
|---|---|---|
| Packaging | 1 | $7B |
|
||
Price history
+12.8% since first listed5 events — show timeline
- 2026-04-16 Pending — Consolidated MLS
- 2026-03-18 Price Changed $246,150 Consolidated MLS
- 2026-02-09 Listed $273,500 Consolidated MLS
- 2021-01-18 Delisted — Consolidated MLS
- 2020-12-09 Listed $218,200 Consolidated MLS
Property tax history
+72.7%/yrLatest (2025): $1,660 · +1.2% YoY. Source: county tax records.
Cash-flow waterfall
monthlySold comps — $/sqft
last 12 mo · ≤1 miLoading sold comps…