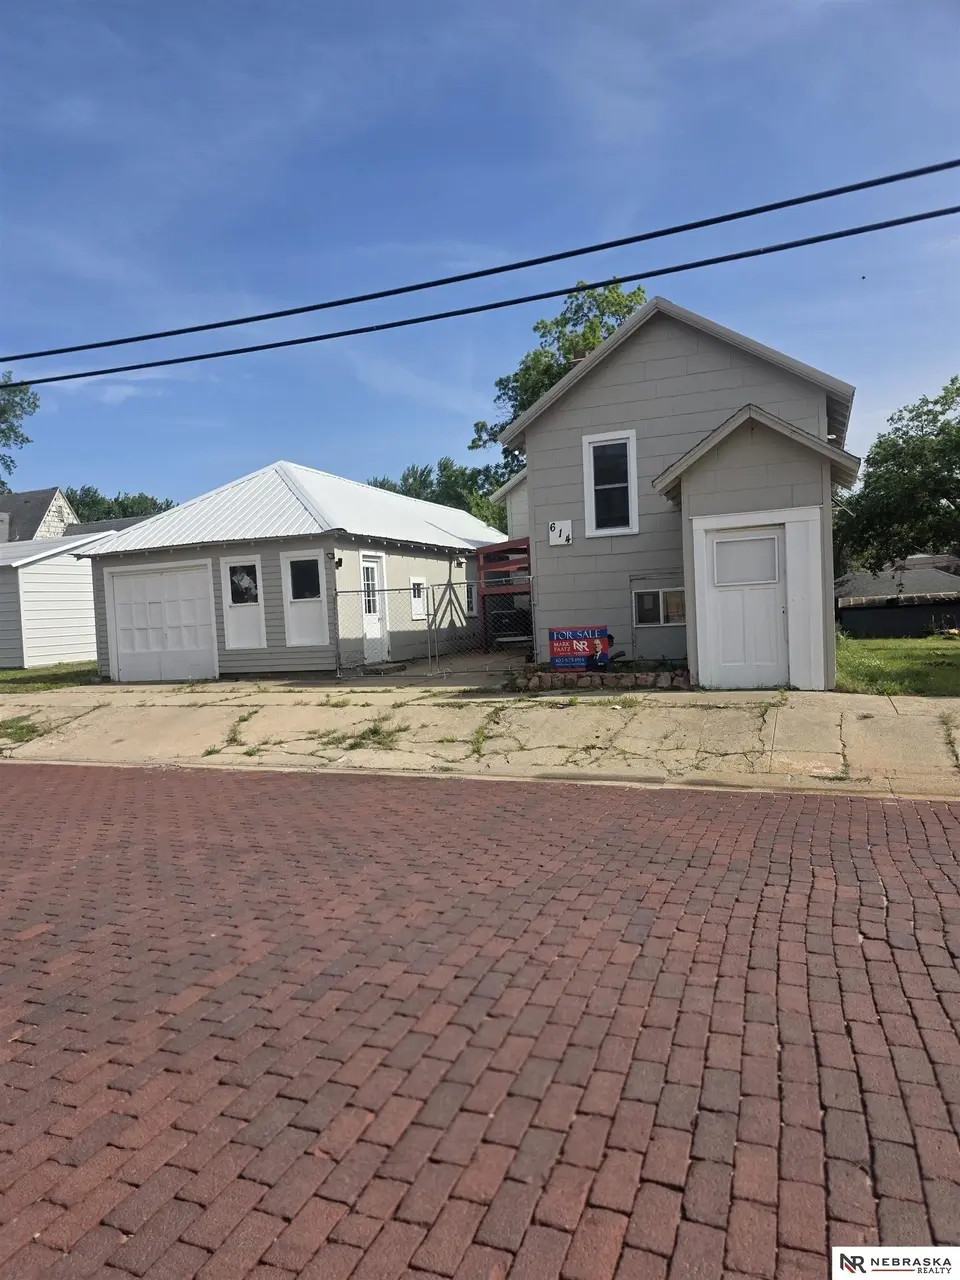
614 8th St · Fairbury, NE
Flood risk 1/10 · Minimal
- FEMA flood zone
- X (unshaded)
- Chance of flooding over 30 yrs
- 0.0%
- Est. flood insurance / yr
- $473 – $860
Fire risk 6/10 · Moderate
- Est. fire insurance / yr
- $1,161 – $2,155
Heat risk 4/10 · Minor
- Hot days now (above 106°F)
- 7 days/yr
- Hot days in 30 yrs
- 16 days/yr
Wind risk 2/10 · Minimal
- Chance of severe wind over 30 yrs
- —
Air-quality risk 1/10 · Minimal
- Unhealthy air days now
- 0 days/yr
- Unhealthy air days in 30 yrs
- 0 days/yr
Risk factors via First Street. Map © Google.
Why this score? — see what drove the C grade
The composite is a weighted blend of 9 inputs, each scored 0–100. Each bar is that input's sub-score; the figure is the points it added to the 100-point composite (weight × sub-score).
- Cash flow +30.0/30.0
- DSCR +10.0/10.0
- 1% rule +8.1/10.0
- Livability +3.7/5.0
- Schools +3.2/10.0
- Rent growth +2.5/5.0
- Condition / age +2.5/5.0
- ARV discount +0.0/15.0
- Appreciation +0.0/10.0
$65,000
🖨 Deal sheet (PDF) 📄 Offer letter ✓ Due diligence
Listing remarks
Welcome to this charming remodeled 1 bed, plus 2 con-conforming bedrooms, 1 bath home located close to schools and shopping! This home has new windows and newer HVAC.
Key facts
- Remodeled
- Close to schools
- Close to shopping
Tags
Property features AI
Exterior
- Parking: Detached covered garage (1 car); One total parking space
- Utilities: Public water; Public sewer; Electricity available; Natural gas available; Cable available; Phone available; Fiber optic
- Home design: Single-family residence, two stories; Not new (built in 1941); Living area includes finished space above and below grade
- Construction: Wood siding; Composition roof; Block foundation; Year built 1941
- Exterior features: Deck; Chain link fencing; Paved road access; City lot with public sidewalk; Up to 1/4 acre lot
Interior
- Kitchen: Range; Refrigerator
- Bedrooms: Main floor primary bedroom (13 x 15)
- Flooring: Luxury vinyl plank
- Bathrooms: One full bathroom (main level)
- Heating & cooling: Natural gas forced-air heating; Central air conditioning
- Interior features: Partially finished basement; No fireplace; Luxury vinyl plank flooring
- Laundry & utility: Basement utility space
Neighborhood map
What this means for you Summary
Snapshot
- This is a 1-bed/1.0-bath single-family listed at $65k.
Deal economics
- At list price, monthly cash flow is $246 ($3k/yr) — positive.
- The deal already cash-flows at list — no discount required.
- Meets the 1% rule at list price ($850 rent vs $65k).
- Cap rate 10.8% vs local median 4.6% in Fairbury — top-decile yield for the area; either an underpriced asset or a hidden risk that comps aren't pricing in. Stress-test before assuming the spread holds.
Location & tenants
- Location reads 74/100 on livability (#125 in NE, #4,843 nationally) — a middle-class / working-renter tenant base. Strengths: cost of living A+, housing A+, health & safety A+; Watch: employment D+, amenities F, commute F.
- Fairbury Public Schools (town): math 39% / reading 37% proficiency, ranked #101 of 111 in NE (top 91%) — families likely to look elsewhere, expect single-tenant / working-renter base with shorter leases.
- Zoned schools: Central Elementary School (262 students, 56% FRL); Fairbury Jr-Sr High School (math 42% / reading 42%, grade F, #176 of 261 statewide, top 68%, 377 students, 55% FRL) — zoned schools average 55% FRL vs 39% district-wide (16 pts higher); higher-poverty schools than district average — tighter screening recommended.
- Market conditions: 36 active listings in the ZIP; 1 comparable units currently listed for rent nearby; 9 units permitted in Jefferson County in 2024 (0 in 5+ unit buildings).
Forward outlook
- Local home prices are declining (-3.0%/yr); year-one equity from $449 of loan paydown is wiped out by about $2k of value loss. Plan a longer hold.
- Jefferson County population projected to shrink 6% by 2050 — rents likely to lag national; underwrite the cash flow, not the appreciation.
- At projected returns (-3.0% appreciation + 3.0% rent growth), your $18k cash investment doubles in ~8 years — after that, you're playing with house money.
Negotiation context
- Only 10 days on market — expect competitive offers; lowballing is unlikely to land.
- 3 sale attempts since 2y ago with the ask held roughly flat each time — persistent listings suggest the price (not the market) is what's stuck; bring a comps-based counter.
- Current owner paid $25k; list at $65k implies a 160% gain — meaningful room to come down on a strong offer.
Risks & watch-outs
- Watch-outs: built in 1941 — expect roof / HVAC / electrical / plumbing capex.
- Climate carrying-cost: major wildfire risk — expect insurance premiums to compound above CPI over the hold.
Questions for the listing agent
- Built in 1941 — when were the roof, HVAC, electrical panel, plumbing, and water heater last replaced?
- Is there a deadline driving the sale (1031 exchange, divorce, estate, relocation)? That informs how much negotiation room exists.
- Schools are D-rated, which usually means shorter tenancies and higher turnover. Who's the typical renter profile here, and what's been the actual vacancy rate?
- What's the average days-on-market for RENTAL listings here right now (not sales)? A rising rental-DOM trend means longer vacancies and softer asking-rent achievability than the comps imply.
- What's the recent tenant-quality profile in this submarket — average credit score on applications, eviction rate, late-payment / NSF rate, and stable-employment percentage? A property-management company in the area should have these aggregated.
- How much new for-sale + rental construction is in the pipeline within 1–3 miles? Heavy new supply typically softens prices + rents 12–24 months out; constrained supply supports both.
Investment metrics
- 1% rule
- 1.31% ✓
- Cap rate
- 10.84%
- Cash-on-cash
- 16.23%
- DSCR
- 1.72
- GRM
- 6.4
CMA / ARV
- ARV (on-the-fly)
- $51,612
- Comps found
- 5
Show comp detail 5 sales within ~0.75 mi
| Address | Dist | Beds/Ba | Sqft | Sold | Price | $/sf | Match |
|---|---|---|---|---|---|---|---|
| 1302 G St | 0.44mi | 2/1.0 (+1) | 735 (-3%) | 3mo | $32,000 | $44 | 66 |
| 818 C St | 0.24mi | 1/1.0 | 856 (+13%) | 7mo | $63,829 | $75 | 61 |
| 315 12th St | 0.41mi | 1/1.0 | 848 (+12%) | 20mo | $58,000 | $68 | 45 |
| 1116 A St | 0.49mi | 2/1.0 (+1) | 648 (-15%) | 22mo | $47,000 | $73 | 30 |
| 1226 Oak St | 0.67mi | 2/1.0 (+1) | 864 (+14%) | 19mo | $33,500 | $39 | 25 |
Match score weights: distance 35% · size 25% · config 20% · recency 20%. Top-matched comps best support the ARV.
Projected returns pro-forma
-3.0% appreciation · 3.0% rent growth · sell at horizon
- IRR
- 7.2%
- Equity multiple
- 1.28×
- Total profit
- $5,143
- Equity at exit
- $9,692
- IRR
- 16.5%
- Equity multiple
- 2.35×
- Total profit
- $24,658
- Equity at exit
- $5,620
Cash invested: $18,200 (down + closing). Projections, not guarantees.
Landlord ↔ Tenant lean methodology
- Overall (STATE)
- 83 Strongly Landlord-Friendly
- State Nebraska
- 83 Strongly Landlord-Friendly · R+13
- County
- — inherits STATE
- City
- — inherits STATE
ZIP-level market 68352
- Home prices YoY
- -9.9%
- Active inventory
- 36
- Price-to-rent
- 6.4×
Monthly cashflow live
- Estimated rent
- $850 medium interval (Pro) →
- Mortgage (P&I)
- −$341
- Tax from tax record
- −$57 /mo · $689/yr
- Insurance
- −$27
- HOA
- −$0
- Vacancy / Maint / Mgmt
- −$178
- Net cashflow
- $246
Break-even live
Sensitivity live
| Price | -10% $283 | -5% $265 | +0% $246 | +5% $228 | +10% $209 |
|---|---|---|---|---|---|
| Rent | -10% $179 | -5% $213 | +0% $246 | +5% $280 | +10% $313 |
| Rate | -1.0pp $279 | -0.5pp $263 | base $246 | +0.5pp $229 | +1.0pp $212 |
UW: 25.0% down · 7.5% · 30yr · 1.5% tax · 5.0% vac · 8.0% maint · 8.0% mgmt
Financing live
Cash to close
- Down payment
- $16,250
- Closing costs
- $1,950
- Reserves months
- —
- Total cash needed
- —
Loan-product check · same deal, 3 products live
Conventional
25% down · 7.5% · 30yr
- Down + closing
- —
- Monthly P&I
- —
- Monthly cashflow
- —
- DSCR
- —
- Eligible?
- —
Personal DTI + credit; lowest rate.
DSCR
20% down · 8.5% · 30yr
- Down + closing
- —
- Monthly P&I
- —
- Monthly cashflow
- —
- DSCR
- —
- Eligible?
- —
No personal income docs; deal must DSCR.
Hard money
10% down · 12.0% · 12mo
- Down + closing
- —
- Monthly P&I
- —
- Monthly cashflow
- —
- DSCR
- —
- Eligible?
- —
Short-term bridge; refi at stabilization.
Rent comps 1 comps
| Address | Beds | Baths | Sqft | Rent | $/sqft | DOM | Units | Dist |
|---|---|---|---|---|---|---|---|---|
| 1011 K St Unit STREET-301 Fairbury, NE | 2.0 | 1.5 | 1088 | $850 | $0.78 | 46d | 1 | 0.40mi |
Listing history 7 events
-
2026-05-15$65,000 New
-
2024-12-27historical
-
2024-10-08$55,000 New
-
2024-10-07historical
-
2024-07-03price $55,000
-
2024-06-13$65,000 New
-
2024-03-11soldstatus $25,000
ⓘ Source: listings_history table (triggers on properties + properties_extension) + one-shot
backfill from property_details.listing_events for pre-trigger history.
Tax reassessment forecast NE · Resets to sale price
- Current annual tax
- $689 · $57/mo
- Projected year-2 tax
- $1,124 · $94/mo
- Expected delta
- +$436/yr (+$36/mo · 63.3%)
ⓘ Screening estimate from a state-policy table — verify with the county assessor before closing.
Climate risk First Street
- Flood 1/10 Low FEMA zone X (unshaded) · 0% chance over 30 yrs
- Wildfire 6/10 Major
- Heat 4/10 Moderate 7 d/yr ≥106°F today · 16 d/yr by 30 yrs out
- Wind 2/10 Low
- Air quality 1/10 Low 0 unhealthy d/yr today · 0 by 30 yrs out
Nearby sold comps map
Loading sold comps map…
Walkable amenities ~0.75 mi
Loading nearby amenities…
Taxation est. · year 1
- Rental income
- $10,200
- − Mortgage interest
- −$3,641
- − Property taxes
- −$689
- − Insurance
- −$325
- − Repairs & maintenance
- −$816
- − Management
- −$816
- − Depreciation
- −$1,891
- Taxable income
- $2,022
- Est. tax owed @ 24.0%
- −$485
- After-tax cash flow
- $2,468/yr
For passive investors: Depreciation is non-cash, so a rental often shows a tax loss while cash-flowing — sheltering income. Rental losses are passive: they offset passive income freely, and up to $25,000/yr can offset ordinary (W-2) income if you actively participate and your MAGI is under $100k (phasing out to $0 by $150k); unused losses carry forward. On sale, claimed depreciation is recaptured at up to 25%, and gains may owe capital-gains tax (a 1031 exchange can defer both). Figures are a year-1 estimate at your 24.0% rate — not tax advice; consult a CPA.
Schools (NCES district)
- District
- Fairbury Public Schools
- NCES district ID
- 3170440
- Math proficiency
- 39% ▼ -13.00%
- Reading proficiency
- 37% ▲ 4.00%
- Median HH income
- $40,800
- Composite
- 31.97/100
- National rank
- #5842
- State rank
- #101 of 111 in NE
Livability — Fairbury
- Score
- 74/100
- State rank
- #125
- US rank
- #4843
Category grades
Schools grade is shown separately in the Schools card above.
Census & demographics
- Census place
- Fairbury, NE
- Population (ZIP)
- 4,897
Population outlook (Jefferson County) Hauer SSP2
- Today (2025)
- 6,961 people
- By 2030
- 6,831 · -1.9%
- By 2040
- 6,590 · -5.3%
- By 2050
- 6,510 · -6.5%
- By 2075
- 6,831 · -1.9%
- By 2100
- 7,072 · +1.6%
Race, ethnicity, and origin ACS 2023
- Neighborhood character
- Predominantly White (88%)
- Race & ethnicity
- White 88% Hispanic / Latino 7% Two or more races 6%
- Hispanic origin (detail)
- Mexican 5%
- Common ancestry
- Lithuanian 3% Iranian 1% Italian 1%
- Foreign-born
- 2% · Canada
- Languages at home
- 95% English-only · Spanish 4% German/W. Germanic 1%
Political lean MEDSL · Jefferson
- 2024 margin
- Solid R (+45.3) · D 26.7% · R 72.0% · Other 1.4%
- 2008→2024 swing
- -29.6pp toward R · 2008: -15.8pp · 2024: -45.3pp
- All cycles
- 2024: R+45.3 2020: R+42.9 2016: R+45.4 2012: R+28.4 2008: R+15.8
Not yet ingested
- Civics
- —
Market trends
- HPI YoY
- ▼ -25.22%
- Current HPI
- 229.7519
- Rent YoY
- —
- Metro
- —
- State GDP YoY
- ▲ 0.68%
- F500 in state
- 2
Industry mix (Fortune 500 HQ in NE)
| Industry | F500 HQs | Revenue |
|---|---|---|
| Conglomerate | 1 | $371B |
|
||
Price history
+160.0% since first listed7 events — show timeline
- 2026-05-15 Listed $65,000 GPRMLS
- 2024-12-27 Listing Removed — GPRMLS
- 2024-10-08 Listed $55,000 GPRMLS
- 2024-10-07 Listing Removed — GPRMLS
- 2024-07-03 Price Changed $55,000 GPRMLS
- 2024-06-13 Listed $65,000 GPRMLS
- 2024-03-11 Sold (Public Records) $25,000 Public Records
Property tax history
+14.4%/yrLatest (2025): $689 · +115.7% YoY. Source: county tax records.
Cash-flow waterfall
monthlySold comps — $/sqft
last 12 mo · ≤1 miLoading sold comps…