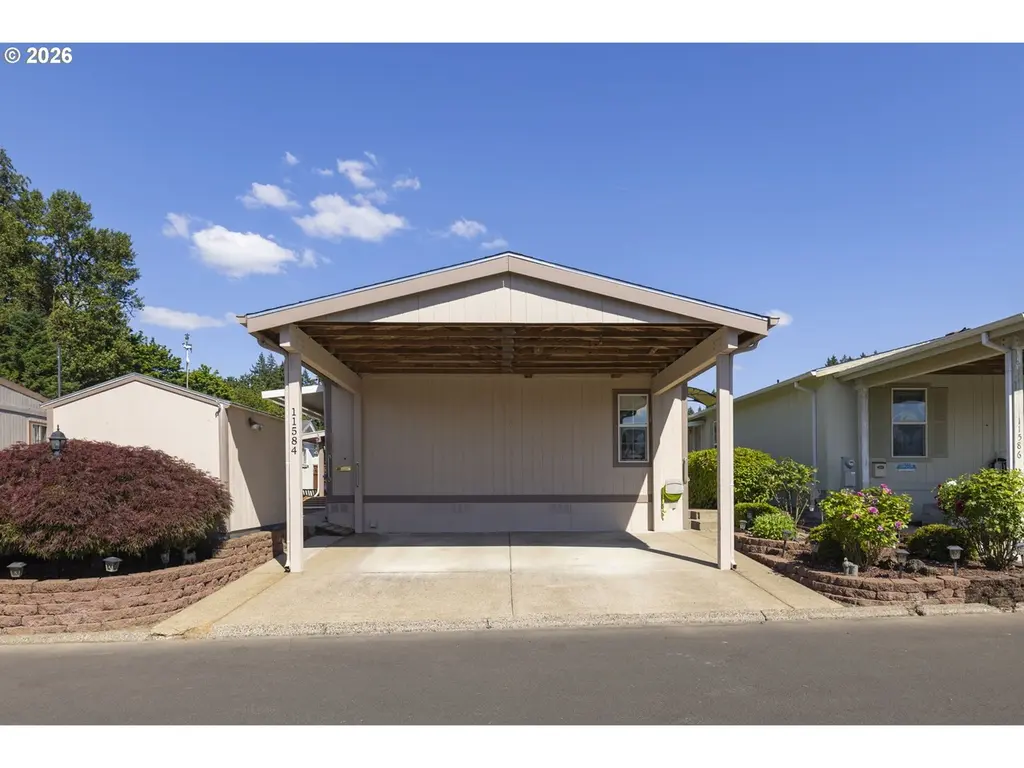
11584 SW Royal Villa Dr · Tigard, OR
Flood risk 1/10 · Minimal
- FEMA flood zone
- X (unshaded)
- Chance of flooding over 30 yrs
- 0.0%
- Est. flood insurance / yr
- $507 – $1,088
Fire risk 1/10 · Minimal
- Est. fire insurance / yr
- $498 – $926
Heat risk 3/10 · Minor
- Hot days now (above 92°F)
- 7 days/yr
- Hot days in 30 yrs
- 13 days/yr
Wind risk 1/10 · Minimal
- Chance of severe wind over 30 yrs
- —
Air-quality risk 9/10 · Severe
- Unhealthy air days now
- 12 days/yr
- Unhealthy air days in 30 yrs
- 13 days/yr
Risk factors via First Street. Map © Google.
Why this score? — see what drove the B grade
The composite is a weighted blend of 9 inputs, each scored 0–100. Each bar is that input's sub-score; the figure is the points it added to the 100-point composite (weight × sub-score).
- Cash flow +30.0/30.0
- DSCR +10.0/10.0
- 1% rule +9.7/10.0
- ARV discount +7.5/15.0
- Schools +4.9/10.0
- Livability +4.4/5.0
- Condition / age +3.8/5.0
- Rent growth +2.4/5.0
- Appreciation +0.0/10.0
$139,990
🖨 Deal sheet 📄 Offer letter ✓ Due diligence
Listing remarks MLS
Beautifully updated Golden West 3 bedroom 2 bath home in desirable Tigard area! 55+ park w/ Pool, weight room, Rec room, library(+)! Granite counters, new heat pump & system, paint, stainless steel appliances, new windows, 8X10 storage shed, raised garden beds, sprinkler system, double carport; peaceful and elegant! Must see! Call agent now!
Key facts
- Leaffilter gutters
- New lvp flooring
- Walk in closet
Tags
Property features AI
Finance
- Financial info: Land lease in effect (monthly lot rent); Land lease expires December 31, 2026
- HOA & community: Senior community (Royal Villas); Community amenities include pool, meeting/party room, library, weight room, recreation facilities, management, road maintenance, and grounds maintenance
Exterior
- Parking: Covered carport
- Utilities: Public water; Public sewer; Electric service
- Home design: Manufactured home in a park; Single-story (main level living); Residential property (not attached); Built in 2005; No notable view
- Construction: Composition roof; Pillar/post/pier foundation
- Exterior features: Covered deck and deck; Patio; Raised garden beds; Tool shed; Level lot; Paved road access; T-111 siding
Interior
- Kitchen: Granite countertops; Dishwasher; Disposal; Free‑standing range; Microwave; Free‑standing refrigerator; Plumbed for ice maker; Stainless steel appliances; ENERGY STAR qualified appliances; Electric hot water
- Bedrooms: Primary bedroom (main level); Second bedroom; Third bedroom
- Bathrooms: Two full bathrooms (both on the main level)
- Heating & cooling: Forced air heating; Heat pump (provides heating and cooling)
- Interior features: Ceiling fans; High ceilings; Vaulted ceiling; Wainscoting; Soaking tub; Granite surfaces; Washer and dryer present; Double pane windows with vinyl frames; Crawl space basement
- Laundry & utility: Washer and dryer present
Neighborhood map
What this means for you Summary
Snapshot
- This is a 3-bed/2.0-bath manufactured listed at $140k. Condition is rated good.
Deal economics
- At list price, monthly cash flow is $655 ($8k/yr) — positive.
- The deal already cash-flows at list — no discount required.
- Meets the 1% rule at list price ($2k rent vs $140k).
- Cap rate 11.9% vs local median 2.5% in Tigard — top-decile yield for the area; either an underpriced asset or a hidden risk that comps aren't pricing in. Stress-test before assuming the spread holds.
Location & tenants
- Location reads 87/100 on livability (#14 in OR, #311 nationally) — a professional / high-income tenant draw. Strengths: amenities A+, commute A+, employment A+; Watch: crime D-, cost of living F.
- Tigard-Tualatin SD 23J (suburban): math 47% / reading 65% proficiency, ranked #6 of 58 in OR (top 10%) — acceptable for families but not a draw, mixed tenant base, ~2y average lease.
- Zoned schools: James Templeton Elementary School (reading 24%, 514 students, 47% FRL); Twality Middle School (math 54% / reading 64%, grade B, #17 of 128 statewide, top 14%, 918 students, 31% FRL); Tigard High School (math 24% / reading 75%, grade D+, #32 of 143 statewide, top 34%, 1,799 students, 31% FRL).
- Market conditions: Rents soft (-0.4%/yr); 412 active listings in the ZIP; 35 comparable units currently listed for rent nearby; rentals leasing fast (median 13d on market — plan ~1-2 weeks tenant-placement turnaround); solid renter incomes; 2,224 units permitted in Washington County in 2024 (242 in 5+ unit buildings).
Forward outlook
- Local home prices are declining (-3.0%/yr); year-one equity from $968 of loan paydown is wiped out by about $4k of value loss. Plan a longer hold.
- Washington County population projected at +33% by 2050 — long-run rental-demand tailwind backs the buy-and-hold thesis.
- At projected returns (-3.0% appreciation + 0.0% rent growth), your $39k cash investment doubles in ~8 years — after that, you're playing with house money.
Negotiation context
- Only 12 days on market — expect competitive offers; lowballing is unlikely to land.
- 2 sale attempts since 6y ago with the ask held roughly flat each time — persistent listings suggest the price (not the market) is what's stuck; bring a comps-based counter.
Questions for the listing agent
- Is there a deadline driving the sale (1031 exchange, divorce, estate, relocation)? That informs how much negotiation room exists.
- Schools are B-rated — typically a magnet for longer-tenancy family renters. What's the average tenant stay here, and is there a school-zone premium baked into asking?
- Crime grade is D in this area — have there been break-ins, vandalism, or insurance claims at this property in the last 3 years? What carrier currently insures it and at what premium?
- What's the average days-on-market for RENTAL listings here right now (not sales)? A rising rental-DOM trend means longer vacancies and softer asking-rent achievability than the comps imply.
- What's the recent tenant-quality profile in this submarket — average credit score on applications, eviction rate, late-payment / NSF rate, and stable-employment percentage? A property-management company in the area should have these aggregated.
- How much new for-sale + rental construction is in the pipeline within 1–3 miles? Heavy new supply typically softens prices + rents 12–24 months out; constrained supply supports both.
Investment metrics
- 1% rule
- 1.47% ✓
- Cap rate
- 11.91%
- Cash-on-cash
- 20.06%
- DSCR
- 1.89
- GRM
- 5.7
CMA / ARV
- ARV (on-the-fly)
- $57,456
- Comps found
- 12
Show comp detail 12 sales within ~0.75 mi
| Address | Dist | Beds/Ba | Sqft | Sold | Price | $/sf | Match |
|---|---|---|---|---|---|---|---|
| 11656 SW Royal Villa Dr #71 | 0.10mi | 3/2.0 | 1,344 (-2%) | 6mo | $42,500 | $32 | 88 |
| 11560 SW Royal Villa Dr | 0.05mi | 2/2.0 (-1) | 1,334 (-2%) | 5mo | $35,000 | $26 | 84 |
| 11680 SW Royal Villa Dr | 0.14mi | 3/2.0 | 1,344 (-2%) | 10mo | $127,500 | $95 | 82 |
| 11668 SW Royal Villa Dr #77 | 0.11mi | 2/2.0 (-1) | 1,440 (+5%) | 3mo | $67,000 | $47 | 78 |
| 11444 SW Royal Villa Dr #165 | 0.09mi | 2/2.0 (-1) | 1,440 (+5%) | 7mo | $60,000 | $42 | 77 |
| 11768 SW Royal Villa Dr #124 | 0.11mi | 2/2.0 (-1) | 1,248 (-9%) | 2mo | $28,000 | $22 | 74 |
| 11460 SW Royal Villa Dr | 0.05mi | 2/2.0 (-1) | 1,248 (-9%) | 9mo | $72,500 | $58 | 70 |
| 12450 SW Fischer Rd #277 | 0.53mi | 2/2.0 (-1) | 1,344 (-2%) | 7mo | $55,000 | $41 | 61 |
| 17088 SW Eldorado Dr | 0.66mi | 2/2.0 (-1) | 1,440 (+5%) | 2mo | $23,000 | $16 | 54 |
| 17188 SW Eldorado Dr #111 | 0.74mi | 2/2.0 (-1) | 1,248 (-9%) | 1mo | $32,500 | $26 | 45 |
| 17254 SW Eldorado Dr | 0.74mi | 3/2.0 | 1,488 (+9%) | 11mo | $88,000 | $59 | 42 |
| 17123 SW Eldorado Dr | 0.72mi | 3/2.0 | 1,568 (+15%) | 2mo | $129,985 | $83 | 41 |
Match score weights: distance 35% · size 25% · config 20% · recency 20%. Top-matched comps best support the ARV.
Projected returns pro-forma
-3.0% appreciation · 0.0% rent growth · sell at horizon
- IRR
- 8.8%
- Equity multiple
- 1.33×
- Total profit
- $13,068
- Equity at exit
- $20,873
- IRR
- 15.3%
- Equity multiple
- 2.07×
- Total profit
- $41,989
- Equity at exit
- $12,104
Cash invested: $39,197 (down + closing). Projections, not guarantees.
Landlord ↔ Tenant lean methodology
- Overall (STATE)
- 28 Tenant-Leaning
- State Oregon
- 28 Tenant-Leaning · D+6
- County
- — inherits STATE
- City
- — inherits STATE
ZIP-level market 97224
- Rents YoY
- -0.4%
- Active inventory
- 412
- Price-to-rent
- 5.7×
Monthly cashflow live
- Estimated rent
- $2,054 high interval (Pro) →
- Mortgage (P&I)
- −$734
- Tax est. 1.5%
- −$175 /mo · $2,100/yr
- Insurance
- −$58
- HOA
- −$0
- Vacancy / Maint / Mgmt
- −$431
- Net cashflow
- $655
Break-even live
UW: 25.0% down · 7.5% · 30yr · 1.5% tax · 5.0% vac · 8.0% maint · 8.0% mgmt
Financing live
Cash to close
- Down payment
- $34,998
- Closing costs
- $4,200
- Reserves months
- —
- Total cash needed
- —
Loan-product check · same deal, 3 products live
Conventional
25% down · 7.5% · 30yr
- Down + closing
- —
- Monthly P&I
- —
- Monthly cashflow
- —
- DSCR
- —
- Eligible?
- —
Personal DTI + credit; lowest rate.
DSCR
20% down · 8.5% · 30yr
- Down + closing
- —
- Monthly P&I
- —
- Monthly cashflow
- —
- DSCR
- —
- Eligible?
- —
No personal income docs; deal must DSCR.
Hard money
10% down · 12.0% · 12mo
- Down + closing
- —
- Monthly P&I
- —
- Monthly cashflow
- —
- DSCR
- —
- Eligible?
- —
Short-term bridge; refi at stabilization.
Rent comps 35 comps
| Address | Beds | Baths | Sqft | Rent | $/sqft | DOM | Units | Dist |
|---|---|---|---|---|---|---|---|---|
| 12070 SW Fischer Rd Portland, OR | 1.0–3.0 | 1.0–2.0 | 925 | $2,099 | $2.27 | 2d | 9 | 0.34mi |
| 16055 SW 108th Ave Tigard, OR | 1.0–2.0 | 1.0–2.0 | 852 | $1,940 | $2.28 | 8d | 9 | 0.44mi |
| 10900 SW Gaarde St Portland, OR | 2.0 | 1.0 | 825 | $1,525 | $1.85 | 8d | 4 | 0.53mi |
| 10900 SW Gaarde St Unit 273-16 Tigard, OR | 2.0 | 1.0 | 900 | $1,575 | $1.75 | 24d | 1 | 0.53mi |
| 11865 SW Tualatin Rd Tualatin, OR | 2.0–3.0 | 2.0–2.5 | 1154 | $2,737 | $2.37 | 2d | 19 | 0.58mi |
| 17979 SW 115th Ave Unit 6 Tualatin, OR | 2.0 | 1.5 | 1064 | $1,625 | $1.53 | 24d | 1 | 0.68mi |
| 17987 SW 115th Ave Unit 1 Tualatin, OR | 2.0 | 1.0 | 900 | $1,475 | $1.64 | 24d | 1 | 0.69mi |
| 17989 SW 115th Ave Tualatin, OR | 2.0 | 1.0–1.5 | 982 | $1,550 | $1.58 | 24d | 2 | 0.69mi |
| 11773 SW King George Dr King City, OR | 1.0–2.0 | 1.0–2.0 | 826 | $2,500 | $3.03 | 11d | 7 | 0.70mi |
| 15205 SW 119th Ave Portland, OR | 2.0 | 2.0 | 1650 | $2,150 | $1.30 | 20d | 1 | 0.74mi |
| 16444 SW 130th Ter King City, OR | 2.0 | 2.0 | 1002 | $1,695 | $1.69 | 44d | 1 | 0.75mi |
| 17865 SW Pacific Hwy Tualatin, OR | 1.0–3.0 | 1.0–2.0 | 970 | $2,242 | $2.31 | 2d | 13 | 0.76mi |
| 11390 SW Naeve St Tigard, OR | 1.0–2.0 | 1.0–2.0 | 893 | $2,119 | $2.37 | 3d | 5 | 0.77mi |
| 15199 SW Royalty Pkwy Portland, OR | 1.0–3.0 | 1.0–2.0 | 884 | $2,205 | $2.49 | 2d | 12 | 0.78mi |
| 13060 SW Dickson St Portland, OR | 2.0 | 2.0 | 1108 | $1,850 | $1.67 | 44d | 1 | 0.80mi |
| 11545 SW Beef Bend Rd Portland, OR | 2.0 | 2.0 | 935 | $1,514 | $1.62 | 3d | 1 | 0.84mi |
| 16849 SW 131st Ave Portland, OR | 2.0 | 2.0 | 1029 | $1,950 | $1.90 | 15d | 1 | 0.86mi |
| 14844 SW 109th Ave Portland, OR | 2.0 | 1.5 | 1024 | $1,950 | $1.90 | 44d | 1 | 0.93mi |
| 16903 SW 133rd Ter Portland, OR | 3.0 | 2.5 | 1665 | $2,845 | $1.71 | 10d | 1 | 0.95mi |
| 14799 SW 109th Ave Unit 7504 Tigard, OR | 2.0 | 2.0 | 986 | $1,575 | $1.60 | 24d | 1 | 0.95mi |
| 14799 SW 109th Ave Unit 3102 Tigard, OR | 2.0 | 2.0 | 986 | $1,695 | $1.72 | 8d | 1 | 0.95mi |
| 14799 SW 109th Ave Unit 2502 Tigard, OR | 2.0 | 2.0 | 986 | $1,645 | $1.67 | 44d | 1 | 0.95mi |
| 14799 SW 109th Ave Unit 5702 Tigard, OR | 2.0 | 2.0 | 986 | $1,745 | $1.77 | 22d | 1 | 0.95mi |
| 11430 SW Bull Mountain Rd Tigard, OR | 2.0 | 2.0 | 986 | $1,970 | $2.00 | 3d | 6 | 0.96mi |
| 10695 SW Murdock St Tigard, OR | 2.0 | 1.0 | 793 | $1,806 | $2.28 | 2d | 13 | 0.99mi |
| 9720 SW Tualatin Rd Tualatin, OR | 2.0 | 2.0 | 1100 | $1,750 | $1.59 | 44d | 1 | 1.15mi |
| 17335 SW Montague Way Portland, OR | 3.0 | 2.5 | 1687 | $3,175 | $1.88 | 2d | 1 | 1.16mi |
| 10779 SW Canterbury Ln Tigard, OR | 3.0 | 2.5 | 1350 | $2,275 | $1.69 | 15d | 1 | 1.16mi |
| 10775 SW Canterbury Ln #102 Portland, OR | 3.0 | 3.0 | 1373 | $2,495 | $1.82 | 24d | 1 | 1.18mi |
| 14100 SW 112th Ave Unit I08 Portland, OR | 2.0 | 1.0 | 1084 | $1,614 | $1.49 | 12d | 1 | 1.22mi |
| 13830 SW Chinn Ln Portland, OR | 1.0–3.0 | 1.0–2.0 | 839 | $2,100 | $2.50 | 3d | 11 | 1.27mi |
| 14130 SW 105th Ave Portland, OR | 2.0 | 1.0 | 900 | $1,495 | $1.66 | 24d | 1 | 1.29mi |
| 15870 SW 88th Ave Unit A Tigard, OR | 2.0 | 1.0 | 1013 | $1,745 | $1.72 | 44d | 1 | 1.37mi |
| 9215 SW Sweek Dr Tualatin, OR | 3.0 | 2.5 | 1600 | $2,795 | $1.75 | 3d | 1 | 1.44mi |
| 14495 SW Beef Bend Rd Portland, OR | 1.0–2.0 | 1.0–2.0 | 845 | $1,925 | $2.28 | 4d | 12 | 1.45mi |
Listing history 9 events
-
2026-06-18days on market $139,990 Active 12 DOM
-
2026-06-17days on market $139,990 Active 11 DOM
-
2026-06-16days on market $139,990 Active 10 DOM
-
2026-06-15days on market $139,990 Active 9 DOM
-
2026-06-13days on market $139,990 Active 7 DOM
-
2026-06-09days on market $139,990 Active 3 DOM
-
2026-06-08days on market $139,990 Active 2 DOM
-
2026-06-07remarks 699-char remark
-
2026-06-07$139,990 Active 1 DOM
ⓘ Source: listings_history table (triggers on properties + properties_extension) + one-shot
backfill from property_details.listing_events for pre-trigger history.
Climate risk First Street
- Flood 1/10 Low FEMA zone X (unshaded) · 0% chance over 30 yrs
- Wildfire 1/10 Low
- Heat 3/10 Moderate 7 d/yr ≥92°F today · 13 d/yr by 30 yrs out
- Wind 1/10 Low
- Air quality 9/10 Extreme 12 unhealthy d/yr today · 13 by 30 yrs out
Nearby sold comps map
Loading sold comps map…
Walkable amenities ~0.75 mi
Loading nearby amenities…
Taxation est. · year 1
- Rental income
- $24,650
- − Mortgage interest
- −$7,842
- − Property taxes
- −$2,100
- − Insurance
- −$700
- − Repairs & maintenance
- −$1,972
- − Management
- −$1,972
- − Depreciation
- −$4,072
- Taxable income
- $5,992
- Est. tax owed @ 24.0%
- −$1,438
- After-tax cash flow
- $6,426/yr
For passive investors: Depreciation is non-cash, so a rental often shows a tax loss while cash-flowing — sheltering income. Rental losses are passive: they offset passive income freely, and up to $25,000/yr can offset ordinary (W-2) income if you actively participate and your MAGI is under $100k (phasing out to $0 by $150k); unused losses carry forward. On sale, claimed depreciation is recaptured at up to 25%, and gains may owe capital-gains tax (a 1031 exchange can defer both). Figures are a year-1 estimate at your 24.0% rate — not tax advice; consult a CPA.
Condition & rehab AI · 12 photos
This 2005 double-wide home in Royal Villas is well-maintained and updated throughout, offering a comfortable and low-maintenance living experience.
Value-add opportunities
- Resale paint exterior — enhances curb appeal
- Both update landscaping — improves curb appeal and adds value
- Both replace light fixtures — modernizes and improves curb appeal
Renovation cost estimate screening
Value-add ROI direction
- Resale paint exterior — enhances curb appeal ↑
- Both update landscaping — improves curb appeal and adds value ↑
- Both replace light fixtures — modernizes and improves curb appeal ↑
ⓘ Cost ranges are severity-bucket heuristics (US national rule-of-thumb). Get contractor quotes + a written scope before underwriting a rehab budget.
Schools (NCES district)
- District
- Tigard-Tualatin SD 23J
- NCES district ID
- 4112240
- Math proficiency
- 47% ▼ -3.00%
- Reading proficiency
- 65% ▲ 3.00%
- Median HH income
- $60,739
- Composite
- 48.72/100
- National rank
- #2100
- State rank
- #6 of 58 in OR
Livability — Tigard
- Score
- 87/100
- State rank
- #14
- US rank
- #311
Category grades
Schools grade is shown separately in the Schools card above.
Census & demographics
- County
- Washington County · 583,254 people
- City population
- 87,096
- Metro
- Portland-Vancouver-Hillsboro, OR-WA
- Population (ZIP)
- 36,569
- Household income
- $98,125
- Rent vs Own
- Severe rent burden
- 1468.0
Population outlook (Washington County) Hauer SSP2
- Today (2025)
- 674,042 people
- By 2030
- 721,804 · +7.1%
- By 2040
- 812,732 · +20.6%
- By 2050
- 895,143 · +32.8%
- By 2075
- 1,058,806 · +57.1%
- By 2100
- 1,131,692 · +67.9%
Race, ethnicity, and origin ACS 2023
- Neighborhood character
- Predominantly White (73%)
- Race & ethnicity
- White 73% Hispanic / Latino 10% Two or more races 8% Asian 8% Black 3%
- Hispanic origin (detail)
- Mexican 7%
- Common ancestry
- Italian 4% Lithuanian 4% Slovak 3%
- Foreign-born
- 13% · Canada, Vietnam, China
- Languages at home
- 83% English-only · Spanish 7% Other Indo-European 3% Vietnamese 2%
Political lean MEDSL · Washington
- 2024 margin
- Solid D (+34.0) · D 65.3% · R 31.3% · Other 3.4%
- 2008→2024 swing
- +11.8pp toward D · 2008: 22.1pp · 2024: 34.0pp
- All cycles
- 2024: D+34.0 2020: D+34.6 2016: D+26.7 2012: D+17.5 2008: D+22.1
Not yet ingested
- Civics
- —
Market trends
- HPI YoY
- ▼ -287.40%
- Current HPI
- 277.57
- Rent YoY
- ▼ -0.38%
- Metro
- Portland-Vancouver-Hillsboro, OR-WA
- State GDP YoY
- ▲ 2.05%
- F500 in state
- 2
Industry mix (Fortune 500 HQ in OR)
| Industry | F500 HQs | Revenue |
|---|---|---|
| Consumer Goods | 1 | $51B |
|
||
Price history
-9.6% since first listed5 events — show timeline
- 2026-06-06 Listed $139,990 RMLS
- 2021-03-18 Sold (MLS) $149,000 RMLS
- 2021-02-17 Pending — RMLS
- 2020-12-16 Price Changed $149,000 RMLS
- 2020-10-28 Listed $154,900 RMLS
Cash-flow waterfall
monthlySold comps — $/sqft
last 12 mo · ≤1 miLoading sold comps…