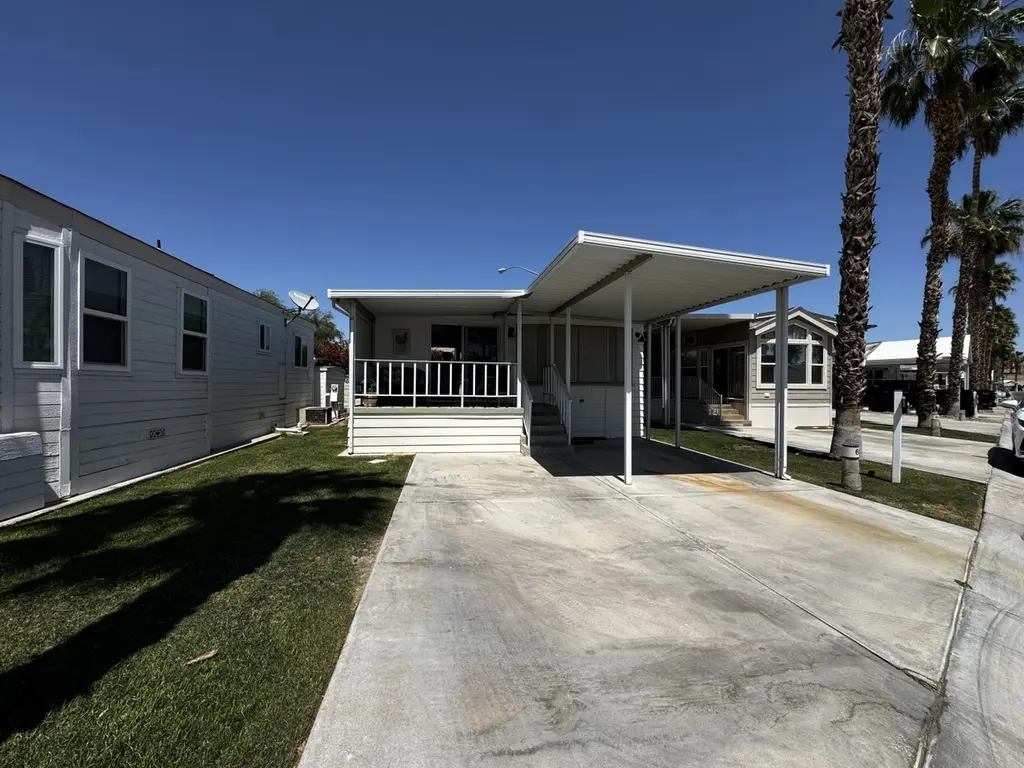
84136 Avenue 44 #602 · Indio, CA
Flood risk 1/10 · Minimal
- FEMA flood zone
- X (unshaded)
- Chance of flooding over 30 yrs
- 0.0%
- Est. flood insurance / yr
- $507 – $1,088
Fire risk 6/10 · Moderate
- Est. fire insurance / yr
- $659 – $1,223
Heat risk 10/10 · Severe
- Hot days now (above 115°F)
- 5 days/yr
- Hot days in 30 yrs
- 13 days/yr
Wind risk 1/10 · Minimal
- Chance of severe wind over 30 yrs
- —
Air-quality risk 3/10 · Minor
- Unhealthy air days now
- 3 days/yr
- Unhealthy air days in 30 yrs
- 5 days/yr
Risk factors via First Street. Map © Google.
Why this score? — see what drove the D+ grade
The composite is a weighted blend of 9 inputs, each scored 0–100. Each bar is that input's sub-score; the figure is the points it added to the 100-point composite (weight × sub-score).
- Cash flow +13.8/30.0
- 1% rule +8.2/10.0
- ARV discount +6.1/15.0
- Rent growth +5.0/5.0
- DSCR +4.2/10.0
- Schools +3.8/10.0
- Livability +2.7/5.0
- Condition / age +2.5/5.0
- Appreciation +0.0/10.0
$130,000
🖨 Deal sheet 📄 Offer letter ✓ Due diligence
Listing remarks
Turnkey Park Model/RV home located in the highly desirable 55+ Rancho Casa Blanca community, where you own the land--making it the perfect winter retreat or seasonal getaway. This well-maintained home offers a comfortable and inviting space with thoughtful upgrades throughout. Enjoy beautiful west-facing mountain views from the tiled deck, ideal for relaxing or entertaining. Additional features include roll-down shutters for added privacy and security, a storage shed for convenience, mirrored closet doors in the bedroom, and an upgraded tile shower complete with updated fixtures and a built-in sitting area. Rancho Casa Blanca is a beautifully landscaped, guard-gated 80-acre resort-style com
Key facts
- Upgraded tile shower
- Tiled deck
- Storage shed
Tags
Property features AI
Finance
- Other: CC & R disclosures apply; Listing terms: cash or cash to new loan; Short-term rentals not allowed; Will not consider lease
- HOA & community: Monthly HOA fee of $570; Community amenities include banquet facilities, tennis courts, paddle tennis, golf course, and fitness center; Senior community
Exterior
- Parking: Two assigned carport spaces; Total of two parking spaces
- Security: 24-hour security; Gated community
- Utilities: Sewer: in-street paid; Not a PUD
- Home design: Single-story (ground level); Built information from assessor
- Construction: Year built per assessor
- Exterior features: Community swimming pool (in-ground); Community spa/hot tub (in-ground); Peek-a-boo view; Detached property; Fee simple land
Interior
- Flooring: Vinyl flooring
- Bathrooms: One full bathroom
- Heating & cooling: Central heating; Air conditioning
- Interior features: Turnkey furnished; Family room
Neighborhood map
What this means for you Summary
Snapshot
- This is a 1-bed/1.0-bath manufactured listed at $130k.
Deal economics
- At list price, monthly cash flow is $13 ($151/yr) — positive.
- The deal already cash-flows at list — no discount required.
- Meets the 1% rule at list price ($2k rent vs $130k).
- Recommended offer: $126k (3.0% below list) — sets the bar for market timing.
- Cap rate 6.4% vs local median 4.3% in Indio — top-decile yield for the area; either an underpriced asset or a hidden risk that comps aren't pricing in. Stress-test before assuming the spread holds.
Location & tenants
- Location reads 53/100 on livability (#927 in CA) — a working-class tenant base; expect higher turnover. Strengths: housing B+; Watch: employment D, schools F, crime F.
- Desert Sands Unified (suburban): math 31% / reading 56% proficiency, ranked #199 of 517 in CA (top 38%) — families likely to look elsewhere, expect single-tenant / working-renter base with shorter leases.
- Market conditions: Rents rising fast (+11.6%/yr); 441 active listings in the ZIP; solid renter incomes; 9,195 units permitted in Riverside County in 2024 (1,512 in 5+ unit buildings).
Forward outlook
- Local home prices are declining (-3.0%/yr); year-one equity from $899 of loan paydown is wiped out by about $4k of value loss. Plan a longer hold.
- Riverside County population projected at +22% by 2050 — long-run rental-demand tailwind backs the buy-and-hold thesis.
- At projected returns (-3.0% appreciation + 8.0% rent growth), your $36k cash investment doubles in ~10 years — after that, you're playing with house money.
Negotiation context
- It's been on market 49 days — a 3% lower offer ($126k) is reasonable based on typical stale-listing flexibility.
- 4 sale attempts since 10y ago with the ask held roughly flat each time — persistent listings suggest the price (not the market) is what's stuck; bring a comps-based counter.
- Current owner paid $40k; list at $130k implies a 225% gain — meaningful room to come down on a strong offer.
Risks & watch-outs
- Watch-outs: HOA is 33% of rent.
- Climate carrying-cost: major wildfire risk; extreme-heat days projected 5→13/yr by 2055 (HVAC capex compounding) — expect insurance premiums to compound above CPI over the hold.
Questions for the listing agent
- It's been on market 49 days. Have you received any prior offers? Is the seller open to a 3% concession, seller financing, or rate buy-down credit?
- What does the HOA fee cover, when was the last increase, and are there any pending special assessments or reserve-fund shortfalls?
- Is there a deadline driving the sale (1031 exchange, divorce, estate, relocation)? That informs how much negotiation room exists.
- Schools are F-rated, which usually means shorter tenancies and higher turnover. Who's the typical renter profile here, and what's been the actual vacancy rate?
- Crime grade is F in this area — have there been break-ins, vandalism, or insurance claims at this property in the last 3 years? What carrier currently insures it and at what premium?
- The area grade is low — what's the realistic commute time and amenity access for the typical tenant pool here? Any planned neighborhood developments (good or bad) we should know about?
- What's the average days-on-market for RENTAL listings here right now (not sales)? A rising rental-DOM trend means longer vacancies and softer asking-rent achievability than the comps imply.
- What's the recent tenant-quality profile in this submarket — average credit score on applications, eviction rate, late-payment / NSF rate, and stable-employment percentage? A property-management company in the area should have these aggregated.
- How much new for-sale + rental construction is in the pipeline within 1–3 miles? Heavy new supply typically softens prices + rents 12–24 months out; constrained supply supports both.
Investment metrics
- 1% rule
- 1.32% ✓
- Cap rate
- 6.41%
- Cash-on-cash
- 0.42%
- DSCR
- 1.02
- GRM
- 6.3
CMA / ARV
- ARV (median comp)
- $126,160
- List price
- $130,000
- Delta
- 3.04%
- Verdict
- FAIR
- Comps
- 20 within 1.0 mi
Show comp detail 12 sales within ~0.75 mi
| Address | Dist | Beds/Ba | Sqft | Sold | Price | $/sf | Match |
|---|---|---|---|---|---|---|---|
| 84136 Avenue 44 #477 | 0.00mi | 1/1.0 | 400 (0%) | 1mo | $95,000 | $238 | 99 |
| 84136 Ave 44, #567 #567 | 0.00mi | 1/1.0 | 400 (0%) | 1mo | $90,000 | $225 | 99 |
| 84136 Ave 44, #262 #262 | 0.11mi | 1/1.0 | 400 (0%) | 0mo | $192,500 | $481 | 95 |
| 84136 84136 Avenue 44, #325 #325 | 0.08mi | 1/1.0 | 400 (0%) | 2mo | $79,000 | $198 | 94 |
| 84136 Ave 44, #29 #29 | 0.10mi | 1/1.0 | 400 (0%) | 1mo | $90,000 | $225 | 94 |
| 84136 Avenue 44, #449 #449 | 0.12mi | 1/1.0 | 400 (0%) | 3mo | $230,000 | $575 | 92 |
| 84136 Ave 44, #385 #385 | 0.13mi | 1/1.0 | 400 (0%) | 3mo | $178,000 | $445 | 92 |
| 754 Ave 44 #754 | 0.14mi | 1/1.0 | 400 (0%) | 3mo | $101,500 | $254 | 91 |
| 84136 Ave 44 #122 | 0.15mi | 1/1.0 | 400 (0%) | 2mo | $125,000 | $313 | 91 |
| 84136 Ave 44, #744 #744 | 0.20mi | 1/1.0 | 400 (0%) | 2mo | $176,000 | $440 | 89 |
| 84136 Ave 44, 658 #658 | 0.19mi | 1/1.0 | 400 (0%) | 3mo | $102,500 | $256 | 89 |
| 84136 Ave 44, 675 #675 | 0.20mi | 1/1.0 | 400 (0%) | 3mo | $205,000 | $513 | 89 |
Match score weights: distance 35% · size 25% · config 20% · recency 20%. Top-matched comps best support the ARV.
Projected returns pro-forma
-3.0% appreciation · 8.0% rent growth · sell at horizon
- IRR
- -7.6%
- Equity multiple
- 0.70×
- Total profit
- $-10,912
- Equity at exit
- $19,383
- IRR
- 9.2%
- Equity multiple
- 1.93×
- Total profit
- $33,944
- Equity at exit
- $11,240
Cash invested: $36,400 (down + closing). Projections, not guarantees.
Landlord ↔ Tenant lean methodology
- Overall (STATE)
- 18 Strongly Tenant-Friendly
- State California
- 18 Strongly Tenant-Friendly · D+13
- County
- — inherits STATE
- City
- — inherits STATE
ZIP-level market 92203
- Home prices YoY
- -25.0%
- Rents YoY
- 11.6%
- Active inventory
- 441
- Price-to-rent
- 6.3×
Monthly cashflow live
- Estimated rent
- $1,713 medium interval (Pro) →
- Mortgage (P&I)
- −$682
- Tax from tax record
- −$35 /mo · $417/yr
- Insurance
- −$54
- HOA
- −$570
- Vacancy / Maint / Mgmt
- −$360
- Net cashflow
- $13
Break-even live
UW: 25.0% down · 7.5% · 30yr · 1.5% tax · 5.0% vac · 8.0% maint · 8.0% mgmt
Financing live
Cash to close
- Down payment
- $32,500
- Closing costs
- $3,900
- Reserves months
- —
- Total cash needed
- —
Loan-product check · same deal, 3 products live
Conventional
25% down · 7.5% · 30yr
- Down + closing
- —
- Monthly P&I
- —
- Monthly cashflow
- —
- DSCR
- —
- Eligible?
- —
Personal DTI + credit; lowest rate.
DSCR
20% down · 8.5% · 30yr
- Down + closing
- —
- Monthly P&I
- —
- Monthly cashflow
- —
- DSCR
- —
- Eligible?
- —
No personal income docs; deal must DSCR.
Hard money
10% down · 12.0% · 12mo
- Down + closing
- —
- Monthly P&I
- —
- Monthly cashflow
- —
- DSCR
- —
- Eligible?
- —
Short-term bridge; refi at stabilization.
HOA detail
- Monthly dues
- $570 · $6,840/yr
- Likely covers
- security
Listing history 23 events
-
2026-06-18days on market $130,000 Active 49 DOM
-
2026-06-17days on market $130,000 Active 48 DOM
-
2026-06-16days on market $130,000 Active 47 DOM
-
2026-06-15days on market $130,000 Active 46 DOM
-
2026-06-13days on market $130,000 Active 44 DOM
-
2026-06-09days on market $130,000 Active 40 DOM
-
2026-06-08days on market $130,000 Active 39 DOM
-
2026-06-07days on market $130,000 Active 38 DOM
-
2026-06-04days on market $130,000 Active 35 DOM
-
2026-06-03days on market $130,000 Active 34 DOM
-
2026-06-02days on market $130,000 Active 33 DOM
-
2026-06-01days on market $130,000 Active 32 DOM
-
2026-05-31days on market $130,000 Active 31 DOM
-
2026-04-29$130,000 Active 1426-char remark
-
2025-10-03price $129,999
-
2025-05-06$139,900 Active
-
2024-03-30historical
-
2024-03-06price $129,999
-
2023-11-24$139,900 Active
-
2018-02-23soldstatus $40,000
-
2017-06-06historical
-
2017-01-03price $89,000
-
2016-12-06$99,000 Active
ⓘ Source: listings_history table (triggers on properties + properties_extension) + one-shot
backfill from property_details.listing_events for pre-trigger history.
Tax reassessment forecast CA · Resets to sale price
- Current annual tax
- $417 · $35/mo
- Projected year-2 tax
- $988 · $82/mo
- Expected delta
- +$571/yr (+$48/mo · 136.9%)
ⓘ Screening estimate from a state-policy table — verify with the county assessor before closing.
Climate risk First Street
- Flood 1/10 Low FEMA zone X (unshaded) · 0% chance over 30 yrs
- Wildfire 6/10 Major
- Heat 10/10 Extreme 5 d/yr ≥115°F today · 13 d/yr by 30 yrs out
- Wind 1/10 Low
- Air quality 3/10 Moderate 3 unhealthy d/yr today · 5 by 30 yrs out
Nearby sold comps map
Loading sold comps map…
Walkable amenities ~0.75 mi
Loading nearby amenities…
Taxation est. · year 1
- Rental income
- $20,556
- − Mortgage interest
- −$7,282
- − Property taxes
- −$417
- − Insurance
- −$650
- − Repairs & maintenance
- −$1,644
- − Management
- −$1,644
- − HOA
- −$6,840
- − Depreciation
- −$3,782
- Taxable loss
- −$1,704
- Est. tax savings @ 24.0%
- +$409
- After-tax cash flow
- $560/yr
For passive investors: Depreciation is non-cash, so a rental often shows a tax loss while cash-flowing — sheltering income. Rental losses are passive: they offset passive income freely, and up to $25,000/yr can offset ordinary (W-2) income if you actively participate and your MAGI is under $100k (phasing out to $0 by $150k); unused losses carry forward. On sale, claimed depreciation is recaptured at up to 25%, and gains may owe capital-gains tax (a 1031 exchange can defer both). Figures are a year-1 estimate at your 24.0% rate — not tax advice; consult a CPA.
Schools (NCES district)
- District
- Desert Sands Unified
- NCES district ID
- 0611110
- Math proficiency
- 31% ▼ -4.00%
- Reading proficiency
- 56% ▲ 7.00%
- Median HH income
- $54,957
- Composite
- 37.77/100
- National rank
- #4346
- State rank
- #199 of 517 in CA
Livability — Indio
- Score
- 53/100
- State rank
- #927
- US rank
- #24244
Category grades
Schools grade is shown separately in the Schools card above.
Census & demographics
- Census place
- Indio, CA
- County
- Riverside County · 2,287,001 people
- City population
- 100,560
- Metro
- Riverside-San Bernardino-Ontario, CA
- Population (ZIP)
- 34,735
- Household income
- $97,311
- Rent vs Own
- Severe rent burden
- 565.0
Population outlook (Riverside County) Hauer SSP2
- Today (2025)
- 2,664,475 people
- By 2030
- 2,802,692 · +5.2%
- By 2040
- 3,050,904 · +14.5%
- By 2050
- 3,256,783 · +22.2%
- By 2075
- 3,655,058 · +37.2%
- By 2100
- 3,766,594 · +41.4%
Race, ethnicity, and origin ACS 2023
- Neighborhood character
- Diverse neighborhood (Simpson 0.57)
- Race & ethnicity
- Hispanic / Latino 51% White 41% Two or more races 29% Asian 3% Black 2%
- Hispanic origin (detail)
- Mexican 48%
- Common ancestry
- Italian 3% Lithuanian 2% Romanian 2%
- Foreign-born
- 14% · Canada
- Languages at home
- 64% English-only · Spanish 33% Tagalog/Filipino 1% Other Indo-European 1%
Political lean MEDSL · Riverside
- 2024 margin
- Toss-up / Even · D 48.0% · R 49.3% · Other 2.6%
- 2008→2024 swing
- -3.6pp toward R · 2008: 2.3pp · 2024: -1.3pp
- All cycles
- 2024: R+1.3 2020: D+8.0 2016: D+4.3 2012: R+0.4 2008: D+2.3
Not yet ingested
- Civics
- —
Market trends
- HPI YoY
- ▼ -98.51%
- Current HPI
- 295.6456
- Rent YoY
- ▲ 11.64%
- Metro
- Riverside-San Bernardino-Ontario, CA
- State GDP YoY
- ▲ 3.21%
- F500 in state
- 116
Industry mix (Fortune 500 HQ in CA)
| Industry | F500 HQs | Revenue |
|---|---|---|
| Technology | 27 | $1,492B |
|
||
| Financial Services | 3 | $174B |
|
||
| Retail | 3 | $44B |
|
||
| Insurance | 3 | $26B |
|
||
| Media / Entertainment | 2 | $115B |
|
||
| Pharmaceuticals / Biotech | 2 | $62B |
|
||
Price history
+31.3% since first listed10 events — show timeline
- 2026-04-29 Listed $130,000 GPSMLS
- 2025-10-03 Price Changed $129,999 GPSMLS
- 2025-05-06 Listed $139,900 GPSMLS
- 2024-03-30 Listing Removed — GPSMLS
- 2024-03-06 Price Changed $129,999 GPSMLS
- 2023-11-24 Listed $139,900 GPSMLS
- 2018-02-23 Sold (Public Records) $40,000 Public Records
- 2017-06-06 Listing Removed — CRMLS
- 2017-01-03 Price Changed $89,000 CRMLS
- 2016-12-06 Listed $99,000 CRMLS
Property tax history
+1.6%/yrLatest (2014): $417 · +0.4% YoY. Source: county tax records.
Cash-flow waterfall
monthlySold comps — $/sqft
last 12 mo · ≤1 miLoading sold comps…