10955 N 79th Ave #53 · Peoria, AZ
Flood risk 1/10 · Minimal
- FEMA flood zone
- X (shaded)
- Chance of flooding over 30 yrs
- 0.0%
- Est. flood insurance / yr
- $507 – $1,088
Fire risk 1/10 · Minimal
- Est. fire insurance / yr
- $610 – $1,132
Heat risk 9/10 · Severe
- Hot days now (above 113°F)
- 6 days/yr
- Hot days in 30 yrs
- 15 days/yr
Wind risk 1/10 · Minimal
- Chance of severe wind over 30 yrs
- —
Air-quality risk 3/10 · Minor
- Unhealthy air days now
- 3 days/yr
- Unhealthy air days in 30 yrs
- 3 days/yr
Risk factors via First Street. Map © Google.
Why this score? — see what drove the C+ grade
The composite is a weighted blend of 9 inputs, each scored 0–100. Each bar is that input's sub-score; the figure is the points it added to the 100-point composite (weight × sub-score).
- Cash flow +30.0/30.0
- 1% rule +10.0/10.0
- DSCR +10.0/10.0
- Condition / age +4.0/5.0
- Livability +3.8/5.0
- Schools +3.5/10.0
- Rent growth +2.7/5.0
- ARV discount +0.0/15.0
- Appreciation +0.0/10.0
$89,900
🖨 Deal sheet 📄 Offer letter ✓ Due diligence
Listing remarks
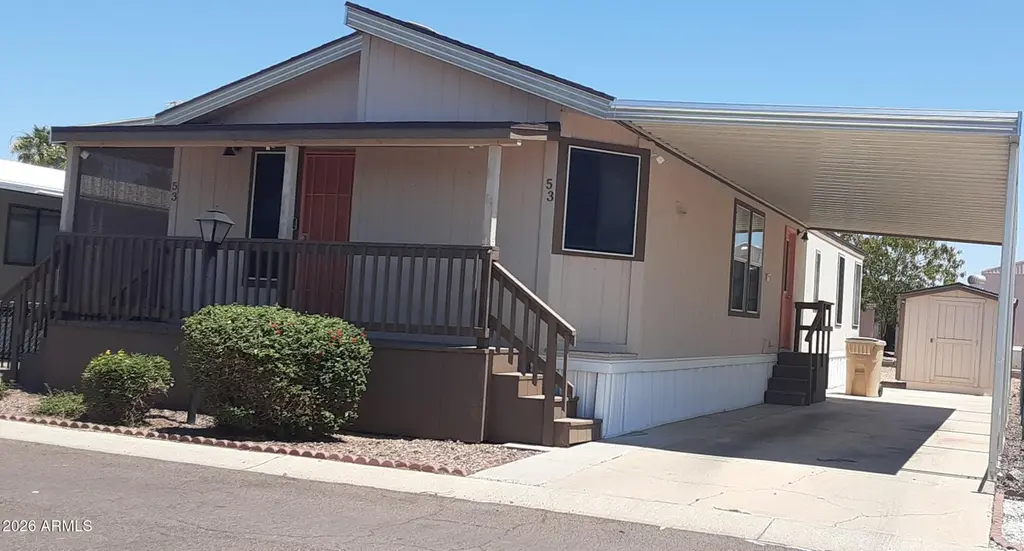
MUST SEE this sharp 3 bedroom, 2 bath home that is move-in ready! This home features an open concept with vaulted ceilings and attractive laminate flooring throughout. Light & bright kitchen with built-in appliances, refrigerator, washer/dryer with inside laundry room. Nice size lot with low maintenance yard and wide front covered patio. 2 car carport with storage shed. Suncrest 1 is a well maintained ''all ages'' MH Park on leased land. Park amenities include a community pool, clubhouse/recreation room with many social activities. Buyer park application and lease approval is required. Park lot rent is $825/month. This home is in a very desirable location to schools, dining, shopping
Key facts
- Laminate flooring
- Built-in appliances
- Low maintenance yard
Tags
Property features AI
Finance
- Other: Directions available: From Peoria go north on 79th Ave and turn right (east) into Suncrest 1 main entrance; lot is toward the east end of the park
- HOA & community: Land lease of $825 per month; No association fees listed; Community pool; Community laundry
Exterior
- Parking: 2 covered parking spaces; 2 carport spaces
- Utilities: City water; Public sewer
- Home design: Manufactured/mobile home; Leasehold property; Asphalt road access
- Construction: Wood siding and wood frame construction; Painted exterior; Composition roof; Building area per assessor
- Exterior features: Shed(s); Storage; Chain-link fencing; East/West exposure; Desert front and back landscaping; Gravel/stone front and back
Interior
- Kitchen: Built-in microwave; Laminate countertops; Refrigerator; Dishwasher; Garbage disposal
- Bedrooms: Up to 3 bedrooms
- Flooring: Laminate flooring; Vinyl flooring
- Bathrooms: 2 full bathrooms
- Heating & cooling: Natural gas heating; Central air conditioning
- Interior features: High-speed internet; Eat-in kitchen; Vaulted ceilings; 3/4 bath in master bedroom; Dual-pane windows; Storage
- Laundry & utility: Laundry inside
Neighborhood map
What this means for you Summary
Snapshot
- This is a 3-bed/2.0-bath manufactured listed at $90k. Condition is rated good.
Deal economics
- At list price, monthly cash flow is $861 ($10k/yr) — positive.
- The deal already cash-flows at list — no discount required.
- Meets the 1% rule at list price ($2k rent vs $90k).
- Recommended offer: $87k (3.0% below list) — sets the bar for market timing.
- Cap rate 17.8% vs local median 3.3% in Peoria — top-decile yield for the area; either an underpriced asset or a hidden risk that comps aren't pricing in. Stress-test before assuming the spread holds.
Location & tenants
- Location reads 76/100 on livability (#14 in AZ, #3,603 nationally) — a middle-class / working-renter tenant base. Strengths: housing A+, commute A, employment A; Watch: cost of living C-, amenities D, health & safety F.
- Peoria Unified School District (4237) (suburban): math 36% / reading 42% proficiency, ranked #64 of 249 in AZ (top 26%) — families likely to look elsewhere, expect single-tenant / working-renter base with shorter leases.
- Zoned schools: Peoria Elementary School (math 21% / reading 29%, grade F, #638 of 1,109 statewide, top 58%, 554 students, 68% FRL); Peoria High School (math 18% / reading 22%, grade F, #225 of 381 statewide, top 60%, 1,566 students, 54% FRL) — zoned schools average 61% FRL vs 35% district-wide (26 pts higher); higher-poverty schools than district average — tighter screening recommended.
- Zoned-school proficiency averages 22% at this address vs 39% district-wide (-16 pts) — the specific schools serving this property underperform the Peoria Unified School District (4237) average; the district grade overstates school quality for this exact location.
- Market conditions: Rents flat; 333 active listings in the ZIP; 32 comparable units currently listed for rent nearby; rentals leasing fast (median 13d on market — plan ~1-2 weeks tenant-placement turnaround); 36,011 units permitted in Maricopa County in 2024 (12,801 in 5+ unit buildings).
- This rent runs 33% of the median local income ($67k/yr) — at the standard rent-burdened threshold; future hikes will face affordability resistance.
Forward outlook
- Local home prices are declining (-3.0%/yr); year-one equity from $622 of loan paydown is wiped out by about $3k of value loss. Plan a longer hold.
- Maricopa County population projected at +38% by 2050 — long-run rental-demand tailwind backs the buy-and-hold thesis.
- At projected returns (-3.0% appreciation + 0.6% rent growth), your $25k cash investment doubles in ~3 years — after that, you're playing with house money.
Negotiation context
- It's been on market 34 days — a 3% lower offer ($87k) is reasonable based on typical stale-listing flexibility.
Risks & watch-outs
- Climate carrying-cost: extreme-heat days projected 6→15/yr by 2055 (HVAC capex compounding) — expect insurance premiums to compound above CPI over the hold.
Questions for the listing agent
- It's been on market 34 days. Have you received any prior offers? Is the seller open to a 3% concession, seller financing, or rate buy-down credit?
- Is there a deadline driving the sale (1031 exchange, divorce, estate, relocation)? That informs how much negotiation room exists.
- Schools are B-rated — typically a magnet for longer-tenancy family renters. What's the average tenant stay here, and is there a school-zone premium baked into asking?
- What's the average days-on-market for RENTAL listings here right now (not sales)? A rising rental-DOM trend means longer vacancies and softer asking-rent achievability than the comps imply.
- What's the recent tenant-quality profile in this submarket — average credit score on applications, eviction rate, late-payment / NSF rate, and stable-employment percentage? A property-management company in the area should have these aggregated.
- How much new for-sale + rental construction is in the pipeline within 1–3 miles? Heavy new supply typically softens prices + rents 12–24 months out; constrained supply supports both.
Investment metrics
- 1% rule
- 2.09% ✓
- Cap rate
- 17.79%
- Cash-on-cash
- 41.06%
- DSCR
- 2.83
- GRM
- 4.0
CMA / ARV
- ARV (median comp)
- $59,946
- List price
- $89,900
- Delta
- 49.97%
- Verdict
- OVERPRICED
- Comps
- 10 within 1.0 mi
Show comp detail 12 sales within ~0.75 mi
| Address | Dist | Beds/Ba | Sqft | Sold | Price | $/sf | Match |
|---|---|---|---|---|---|---|---|
| 10955 N 79th Ave #149 | 0.06mi | 2/2.0 (-1) | 1,152 (+3%) | 20mo | $87,500 | $76 | 71 |
| 7810 W Peoria Ave #128 | 0.18mi | 3/2.0 | 980 (-12%) | 2mo | $40,000 | $41 | 69 |
| 7810 W Peoria Ave #30 | 0.19mi | 2/2.0 (-1) | 1,056 (-6%) | 11mo | $106,000 | $100 | 68 |
| 10955 N 79th Ave #60 | 0.06mi | 2/2.0 (-1) | 972 (-13%) | 4mo | $65,000 | $67 | 66 |
| 7810 W Peoria Ave #153 | 0.19mi | 2/2.0 (-1) | 1,056 (-6%) | 12mo | $105,000 | $99 | 66 |
| 7810 W Peoria Ave #125 | 0.24mi | 3/2.0 | 1,056 (-6%) | 21mo | $117,000 | $111 | 62 |
| 10955 N 79th Ave #37 | 0.02mi | 2/2.0 (-1) | 980 (-12%) | 15mo | $88,000 | $90 | 60 |
| 7302 W Peoria Ave #65 | 0.64mi | 3/2.0 | 1,056 (-6%) | 3mo | $66,500 | $63 | 58 |
| 7810 W Peoria Ave #33 | 0.19mi | 3/2.0 | 952 (-15%) | 12mo | $85,000 | $89 | 56 |
| 10955 N 79th Ave #3 | 0.06mi | 2/1.5 (-1) | 952 (-15%) | 16mo | $46,000 | $48 | 52 |
| 10955 N 79 Ave #46 | 0.06mi | 2/1.5 (-1) | 956 (-15%) | 22mo | $68,000 | $71 | 48 |
| 7344 W Peoria Ave #21 | 0.62mi | 2/2.0 (-1) | 980 (-12%) | 15mo | $17,000 | $17 | 33 |
Match score weights: distance 35% · size 25% · config 20% · recency 20%. Top-matched comps best support the ARV.
Projected returns pro-forma
-3.0% appreciation · 0.62% rent growth · sell at horizon
- IRR
- 34.9%
- Equity multiple
- 2.43×
- Total profit
- $35,922
- Equity at exit
- $13,404
- IRR
- 40.4%
- Equity multiple
- 4.37×
- Total profit
- $84,852
- Equity at exit
- $7,773
Cash invested: $25,172 (down + closing). Projections, not guarantees.
Landlord ↔ Tenant lean methodology
- Overall (STATE)
- 87 Strongly Landlord-Friendly
- State Arizona
- 87 Strongly Landlord-Friendly · R+3
- County
- — inherits STATE
- City
- — inherits STATE
ZIP-level market 85345
- Home prices YoY
- -19.8%
- Rents YoY
- 0.6%
- Active inventory
- 333
- Price-to-rent
- 4.0×
Monthly cashflow live
- Estimated rent
- $1,877 high interval (Pro) →
- Mortgage (P&I)
- −$471
- Tax est. 1.5%
- −$112 /mo · $1,348/yr
- Insurance
- −$37
- HOA
- −$0
- Vacancy / Maint / Mgmt
- −$394
- Net cashflow
- $861
Break-even live
UW: 25.0% down · 7.5% · 30yr · 1.5% tax · 5.0% vac · 8.0% maint · 8.0% mgmt
Financing live
Cash to close
- Down payment
- $22,475
- Closing costs
- $2,697
- Reserves months
- —
- Total cash needed
- —
Loan-product check · same deal, 3 products live
Conventional
25% down · 7.5% · 30yr
- Down + closing
- —
- Monthly P&I
- —
- Monthly cashflow
- —
- DSCR
- —
- Eligible?
- —
Personal DTI + credit; lowest rate.
DSCR
20% down · 8.5% · 30yr
- Down + closing
- —
- Monthly P&I
- —
- Monthly cashflow
- —
- DSCR
- —
- Eligible?
- —
No personal income docs; deal must DSCR.
Hard money
10% down · 12.0% · 12mo
- Down + closing
- —
- Monthly P&I
- —
- Monthly cashflow
- —
- DSCR
- —
- Eligible?
- —
Short-term bridge; refi at stabilization.
Rent comps 32 comps
| Address | Beds | Baths | Sqft | Rent | $/sqft | DOM | Units | Dist |
|---|---|---|---|---|---|---|---|---|
| 7914 W Mescal St Peoria, AZ | 3.0 | 2.0 | 1296 | $1,700 | $1.31 | 4d | 1 | 0.18mi |
| 11014 N 81st Ave Peoria, AZ | 3.0 | 3.0 | 1133 | $1,699 | $1.50 | 5d | 1 | 0.38mi |
| 11600 N 75th Ave Peoria, AZ | 2.0 | 2.0 | 814 | $1,325 | $1.63 | 2d | 4 | 0.48mi |
| 11807 N 76th Ave Peoria, AZ | 3.0 | 2.0 | 1228 | $1,995 | $1.62 | 44d | 1 | 0.58mi |
| 11110 N 82nd Ln Peoria, AZ | 3.0 | 2.0 | 1350 | $1,899 | $1.41 | 24d | 1 | 0.60mi |
| 11851 N 76th Dr Peoria, AZ | 3.0 | 2.0 | 1266 | $1,899 | $1.50 | 5d | 1 | 0.62mi |
| 8311 W Edwards St Peoria, AZ | 3.0 | 2.0 | 1242 | $2,100 | $1.69 | 24d | 1 | 0.67mi |
| 9903 N 77th Ave Peoria, AZ | 3.0 | 2.0 | 1446 | $1,895 | $1.31 | 4d | 1 | 0.67mi |
| 8280 W Madison St Peoria, AZ | 2.0 | 2.0 | 800 | $1,400 | $1.75 | 44d | 1 | 0.73mi |
| 7951 W Whitney Dr Peoria, AZ | 2.0–4.0 | 2.0–2.5 | 1411 | $2,540 | $1.80 | 1d | 30 | 0.86mi |
| 8165 W Whitney Dr Peoria, AZ | 1.0–2.0 | 1.0–2.0 | 911 | $2,223 | $2.44 | 1d | 229 | 0.88mi |
| 9914 N 73rd Ave Peoria, AZ | 3.0 | 1.5 | 1312 | $1,716 | $1.31 | 44d | 1 | 0.92mi |
| 10860 N 85th Ave Unit 87 Peoria, AZ | 2.0 | 1.0 | 780 | $1,149 | $1.47 | 5d | 1 | 0.93mi |
| 10860 N 85th Ave Peoria, AZ | 2.0 | 1.0 | 780 | $1,225 | $1.57 | 44d | 1 | 0.94mi |
| 10860 N 85th Ave Peoria, AZ | 1.0–2.0 | 1.0 | 630 | $1,350 | $2.14 | 3d | 1 | 0.94mi |
| 8560 W Peoria Ave Peoria, AZ | 2.0 | 1.0 | 888 | $1,450 | $1.63 | 1d | 8 | 0.99mi |
| 9592 N 82nd Ave Peoria, AZ | 3.0 | 2.5 | 1401 | $1,775 | $1.27 | 15d | 1 | 1.03mi |
| 6960 W Peoria Ave #90 Peoria, AZ | 2.0 | 1.0 | 704 | $1,320 | $1.88 | 24d | 1 | 1.07mi |
| 8650 W Peoria Ave Peoria, AZ | 1.0–2.0 | 1.0–2.0 | 836 | $1,492 | $1.78 | 2d | 19 | 1.08mi |
| 12480 N 83rd Dr Peoria, AZ | 3.0 | 2.0 | 1410 | $1,895 | $1.34 | 2d | 1 | 1.15mi |
| 7102 W Palo Verde Ave Peoria, AZ | 3.0 | 2.0 | 1360 | $2,000 | $1.47 | 44d | 1 | 1.20mi |
| 6826 W Cholla St Peoria, AZ | 4.0 | 2.0 | 1440 | $1,869 | $1.30 | 44d | 1 | 1.23mi |
| 9201 N 83rd Ave Peoria, AZ | 1.0–3.0 | 1.0–2.0 | 981 | $1,975 | $2.01 | 2d | 29 | 1.26mi |
| 8630 W Shaw Butte Dr Peoria, AZ | 3.0 | 2.0 | 1284 | $1,951 | $1.52 | 13d | 1 | 1.26mi |
| 7102 W Carol Ave Peoria, AZ | 3.0 | 2.0 | 1288 | $1,970 | $1.53 | 5d | 1 | 1.27mi |
| 8821 W Sahuaro Dr Peoria, AZ | 3.0 | 2.0 | 1074 | $1,595 | $1.49 | 24d | 1 | 1.28mi |
| 8821 W Sahuaro Dr Peoria, AZ | 3.0 | 2.0 | 1074 | $1,595 | $1.49 | 3d | 1 | 1.28mi |
| 10221 N 87th Ln Peoria, AZ | 3.0 | 2.0 | 1232 | $2,059 | $1.67 | 44d | 1 | 1.29mi |
| 7027 W Palo Verde Ave Peoria, AZ | 3.0 | 2.0 | 1500 | $1,999 | $1.33 | 44d | 1 | 1.29mi |
| 8551 W Carol Ave Peoria, AZ | 3.0 | 2.0 | 1323 | $2,135 | $1.61 | 11d | 1 | 1.39mi |
| 9190 N 83rd Ave Peoria, AZ | 1.0–2.0 | 1.0–2.0 | 821 | $2,203 | $2.68 | 15d | 10 | 1.44mi |
| 11411 N 91st Ave Unit 213 Peoria, AZ | 2.0 | 2.0 | 858 | $1,399 | $1.63 | 24d | 1 | 1.47mi |
Listing history 15 events
-
2026-06-18days on market $89,900 Active 34 DOM
-
2026-06-17days on market $89,900 Active 33 DOM
-
2026-06-16days on market $89,900 Active 32 DOM
-
2026-06-15days on market $89,900 Active 31 DOM
-
2026-06-13days on market $89,900 Active 29 DOM
-
2026-06-13days on market $89,900 Active 28 DOM
-
2026-06-09days on market $89,900 Active 25 DOM
-
2026-06-08days on market $89,900 Active 24 DOM
-
2026-06-07days on market $89,900 Active 23 DOM
-
2026-06-04days on market $89,900 Active 20 DOM
-
2026-06-03days on market $89,900 Active 19 DOM
-
2026-06-02days on market $89,900 Active 18 DOM
-
2026-06-01days on market $89,900 Active 17 DOM
-
2026-05-31days on market $89,900 Active 16 DOM
-
2026-05-15$89,900 Active 800-char remark
ⓘ Source: listings_history table (triggers on properties + properties_extension) + one-shot
backfill from property_details.listing_events for pre-trigger history.
Climate risk First Street
- Flood 1/10 Low FEMA zone X (shaded) · 0% chance over 30 yrs
- Wildfire 1/10 Low
- Heat 9/10 Extreme 6 d/yr ≥113°F today · 15 d/yr by 30 yrs out
- Wind 1/10 Low
- Air quality 3/10 Moderate 3 unhealthy d/yr today · 3 by 30 yrs out
Nearby sold comps map
Loading sold comps map…
Walkable amenities ~0.75 mi
Loading nearby amenities…
Taxation est. · year 1
- Rental income
- $22,519
- − Mortgage interest
- −$5,036
- − Property taxes
- −$1,348
- − Insurance
- −$450
- − Repairs & maintenance
- −$1,802
- − Management
- −$1,802
- − Depreciation
- −$2,615
- Taxable income
- $9,467
- Est. tax owed @ 24.0%
- −$2,272
- After-tax cash flow
- $8,063/yr
For passive investors: Depreciation is non-cash, so a rental often shows a tax loss while cash-flowing — sheltering income. Rental losses are passive: they offset passive income freely, and up to $25,000/yr can offset ordinary (W-2) income if you actively participate and your MAGI is under $100k (phasing out to $0 by $150k); unused losses carry forward. On sale, claimed depreciation is recaptured at up to 25%, and gains may owe capital-gains tax (a 1031 exchange can defer both). Figures are a year-1 estimate at your 24.0% rate — not tax advice; consult a CPA.
Condition & rehab AI · 30 photos
This move-in ready manufactured home features an open concept with laminate flooring and two bathrooms. The exterior is well-maintained with a covered patio and a desirable location near schools and amenities.
Value-add opportunities
- Both Paint exterior — Enhances curb appeal and resale value
- Both Replace window treatments — Improves aesthetics and energy efficiency
- Both Upgrade kitchen appliances — Modernizes the space and increases value
Renovation cost estimate screening
Value-add ROI direction
- Both Paint exterior — Enhances curb appeal and resale value ↑
- Both Replace window treatments — Improves aesthetics and energy efficiency ↑
- Both Upgrade kitchen appliances — Modernizes the space and increases value ↑
ⓘ Cost ranges are severity-bucket heuristics (US national rule-of-thumb). Get contractor quotes + a written scope before underwriting a rehab budget.
Schools (NCES district)
- District
- Peoria Unified School District (4237)
- NCES district ID
- 0406250
- Math proficiency
- 36% ▼ -14.00%
- Reading proficiency
- 42% ▼ -8.00%
- Median HH income
- $60,171
- Composite
- 34.62/100
- National rank
- #5152
- State rank
- #64 of 249 in AZ
Livability — Peoria
- Score
- 76/100
- State rank
- #14
- US rank
- #3603
Category grades
Schools grade is shown separately in the Schools card above.
Census & demographics
- Census place
- Peoria, AZ
- County
- Maricopa County · 4,537,380 people
- City population
- 206,687
- Metro
- Phoenix-Mesa-Chandler, AZ
- Population (ZIP)
- 60,918
- Household income
- $67,380
- Rent vs Own
- Severe rent burden
- 1879.0
Population outlook (Maricopa County) Hauer SSP2
- Today (2025)
- 4,979,203 people
- By 2030
- 5,378,229 · +8.0%
- By 2040
- 6,156,598 · +23.6%
- By 2050
- 6,872,376 · +38.0%
- By 2075
- 8,401,270 · +68.7%
- By 2100
- 9,247,439 · +85.7%
Race, ethnicity, and origin ACS 2023
- Neighborhood character
- Diverse neighborhood (Simpson 0.62)
- Race & ethnicity
- White 51% Hispanic / Latino 34% Two or more races 14% Black 5% Asian 4% Native American 2%
- Hispanic origin (detail)
- Mexican 29%
- Common ancestry
- Romanian 2% Italian 2% Slovak 1%
- Foreign-born
- 13% · Canada, Vietnam
- Languages at home
- 76% English-only · Spanish 18% Other Indo-European 1% Vietnamese 1%
Political lean MEDSL · Maricopa
- 2024 margin
- Toss-up / Even · D 47.7% · R 51.2% · Other 1.1%
- 2008→2024 swing
- +7.1pp toward D · 2008: -10.6pp · 2024: -3.5pp
- All cycles
- 2024: R+3.5 2020: D+2.2 2016: R+3.5 2012: R+12.0 2008: R+10.6
Not yet ingested
- Civics
- —
Market trends
- HPI YoY
- ▼ -80.77%
- Current HPI
- 328.1069
- Rent YoY
- ▲ 0.62%
- Metro
- Phoenix-Mesa-Chandler, AZ
- State GDP YoY
- ▲ 4.54%
- F500 in state
- 20
Industry mix (Fortune 500 HQ in AZ)
| Industry | F500 HQs | Revenue |
|---|---|---|
| Technology | 2 | $13B |
|
||
| Mining / Metals | 1 | $23B |
|
||
| Environmental Services | 1 | $16B |
|
||
| Metals / Steel | 1 | $14B |
|
||
| Technology Distribution | 1 | $9B |
|
||
| Homebuilding | 1 | $8B |
|
||
Price history
1 event — show timeline
- 2026-05-15 Listed $89,900 ARMLS
Cash-flow waterfall
monthlySold comps — $/sqft
last 12 mo · ≤1 miLoading sold comps…