6200 W West Tidwell Rd Rd W #606 · Houston, TX
Flood risk 5/10 · Moderate
- FEMA flood zone
- X (unshaded)
- Chance of flooding over 30 yrs
- 0.51%
- Est. flood insurance / yr
- $507 – $1,088
Fire risk 1/10 · Minimal
- Est. fire insurance / yr
- $1,222 – $2,270
Heat risk 9/10 · Severe
- Hot days now (above 109°F)
- 7 days/yr
- Hot days in 30 yrs
- 25 days/yr
Wind risk 9/10 · Severe
- Chance of severe wind over 30 yrs
- 99.0%
Air-quality risk 3/10 · Minor
- Unhealthy air days now
- 3 days/yr
- Unhealthy air days in 30 yrs
- 4 days/yr
Risk factors via First Street. Map © Google.
Why this score? — see what drove the D grade
The composite is a weighted blend of 9 inputs, each scored 0–100. Each bar is that input's sub-score; the figure is the points it added to the 100-point composite (weight × sub-score).
- Cash flow +15.0/30.0
- ARV discount +7.5/15.0
- 1% rule +5.0/10.0
- DSCR +5.0/10.0
- Livability +3.7/5.0
- Condition / age +2.5/5.0
- Rent growth +1.9/5.0
- Schools +1.5/10.0
- Appreciation +0.0/10.0
$1,150
🖨 Deal sheet 📄 Offer letter ✓ Due diligence
Listing remarks MLS
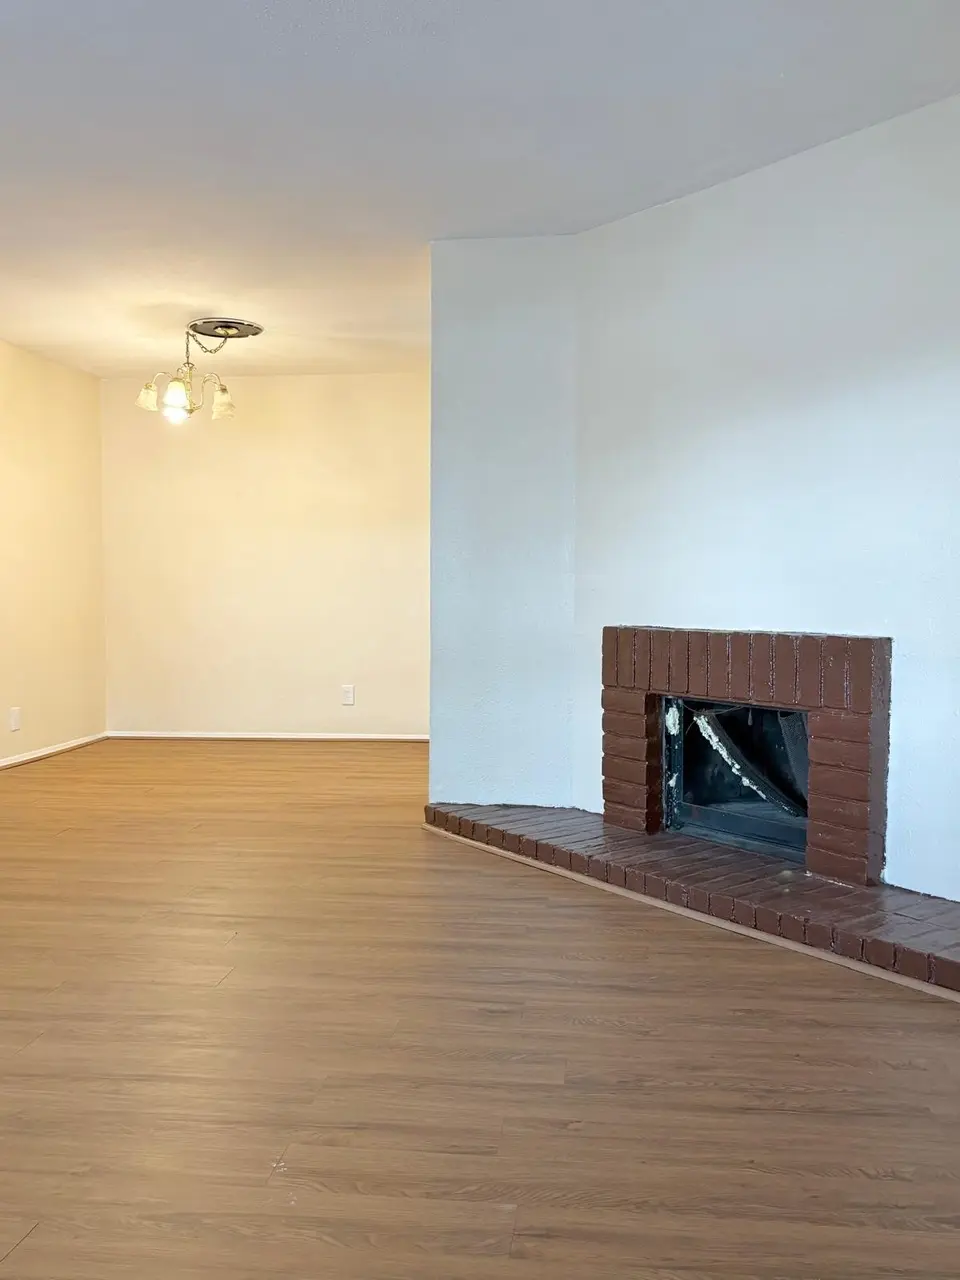
Charming 3 bed 2 bath 1 story condo ready your imagination! NEW PAINT, NEW CARPET, NEW BATHROOM! Ready for move-in immediately! Very desirable location, close to everything! Don't miss out on this opportunity! Priced for a quick sale!
Key facts
- Wood look tile
- Major freeways
- Close to shopping
Tags
Property features AI
Finance
- HOA & community: Association: ASBURY PARK CONDOS; Lease considered
Exterior
- Parking: Detached garage
- Utilities: Public water; Public sewer
- Home design: Residential property; Two-story building; Built in 1974; Slab foundation
- Construction: Brick and vinyl siding construction
- Exterior features: Composition roof
Interior
- Kitchen: Dishwasher; Electric oven; Garbage disposal; Refrigerator
- Bedrooms: Three bedrooms on the first floor (approx. 12 x 10, 12 x 10, and 12 x 12 for the primary)
- Bathrooms: One full bathroom; One half bathroom
- Heating & cooling: Central electric heating; Central air conditioning (electric)
- Interior features: Kitchen and family room combined; Ceiling fans
Neighborhood map
What this means for you Summary
Snapshot
- This is a 3-bed/2.0-bath condo listed at $1k.
Deal economics
- At list price, monthly cash flow is $631 ($8k/yr) — positive.
- The deal already cash-flows at list — no discount required.
- Meets the 1% rule at list price ($1k rent vs $1k).
- Cap rate 664.9% vs local median 3.2% in Houston — top-decile yield for the area; either an underpriced asset or a hidden risk that comps aren't pricing in. Stress-test before assuming the spread holds.
Location & tenants
- Location reads 74/100 on livability (#184 in TX, #4,771 nationally) — a middle-class / working-renter tenant base. Strengths: amenities A+, cost of living A+, housing A+; Watch: schools D, crime F.
- Aldine ISD (suburban): math 16% / reading 21% proficiency, ranked #790 of 826 in TX (top 96%) — low school quality limits family demand, transient renter base, plan for 1-2y turnover; 79% free/reduced lunch — lower-income household profile, screen leases tightly.
- Market conditions: Rents soft (-2.4%/yr); 191 active listings in the ZIP; 40 comparable units currently listed for rent nearby; rentals leasing fast (median 11d on market — plan ~1-2 weeks tenant-placement turnaround); 29,883 units permitted in Harris County in 2024 (8,621 in 5+ unit buildings).
Forward outlook
- Local home prices are declining (-3.0%/yr); year-one equity from $8 of loan paydown is wiped out by about $34 of value loss. Plan a longer hold.
- Harris County population projected at +47% by 2050 — long-run rental-demand tailwind backs the buy-and-hold thesis.
- At projected returns (-3.0% appreciation + 0.0% rent growth), your $322 cash investment doubles in ~1 year — after that, you're playing with house money.
Negotiation context
- Only 1 days on market — expect competitive offers; lowballing is unlikely to land.
- 4 sale attempts since 5y ago with the ask held roughly flat each time — persistent listings suggest the price (not the market) is what's stuck; bring a comps-based counter.
Risks & watch-outs
- Watch-outs: HOA is 33% of rent.
- Climate carrying-cost: moderate flood risk; severe wind risk, 99% chance of damaging wind over 30y; extreme-heat days projected 7→25/yr by 2055 (HVAC capex compounding) — expect insurance premiums to compound above CPI over the hold.
Questions for the listing agent
- Built in 1974 — when were the roof, HVAC, electrical panel, plumbing, and water heater last replaced?
- What does the HOA fee cover, when was the last increase, and are there any pending special assessments or reserve-fund shortfalls?
- Any open or pending special assessments — roof, HVAC, plumbing, elevator, façade? What's the per-unit balance and payoff schedule, and is the seller paying it off at close or rolling it to the buyer?
- Is there a deadline driving the sale (1031 exchange, divorce, estate, relocation)? That informs how much negotiation room exists.
- Schools are D-rated, which usually means shorter tenancies and higher turnover. Who's the typical renter profile here, and what's been the actual vacancy rate?
- Crime grade is F in this area — have there been break-ins, vandalism, or insurance claims at this property in the last 3 years? What carrier currently insures it and at what premium?
- The area grade is low — what's the realistic commute time and amenity access for the typical tenant pool here? Any planned neighborhood developments (good or bad) we should know about?
- What's the average days-on-market for RENTAL listings here right now (not sales)? A rising rental-DOM trend means longer vacancies and softer asking-rent achievability than the comps imply.
- What's the recent tenant-quality profile in this submarket — average credit score on applications, eviction rate, late-payment / NSF rate, and stable-employment percentage? A property-management company in the area should have these aggregated.
- How much new apartment / multifamily construction is in the pipeline within 1–3 miles? Heavy new supply (>2% of stock underway) typically softens rents 12–24 months out; light construction supports rent growth.
Investment metrics
- 1% rule
- 120.76% ✓
- Cap rate
- 664.91%
- Cash-on-cash
- 2352.20%
- DSCR
- 105.66
- GRM
- 0.1
CMA / ARV
No comps found within radius.
Projected returns pro-forma
-3.0% appreciation · 0.0% rent growth · sell at horizon
- IRR
- —
- Equity multiple
- 113.56×
- Total profit
- $36,246
- Equity at exit
- $171
- IRR
- —
- Equity multiple
- 214.74×
- Total profit
- $68,826
- Equity at exit
- $99
Cash invested: $322 (down + closing). Projections, not guarantees.
Landlord ↔ Tenant lean methodology
- Overall (STATE)
- 87 Strongly Landlord-Friendly
- State Texas
- 87 Strongly Landlord-Friendly · R+5
- County
- — inherits STATE
- City
- — inherits STATE
ZIP-level market 77092
- Home prices YoY
- -21.9%
- Rents YoY
- -2.4%
- Active inventory
- 191
- Price-to-rent
- 0.1×
Monthly cashflow live
- Estimated rent
- $1,389 high interval (Pro) →
- Mortgage (P&I)
- −$6
- Tax est. 1.5%
- −$1 /mo · $17/yr
- Insurance
- −$0
- HOA est. from 5 same-building comps
- −$458
- Vacancy / Maint / Mgmt
- −$292
- Net cashflow
- $631
Break-even live
UW: 25.0% down · 7.5% · 30yr · 1.5% tax · 5.0% vac · 8.0% maint · 8.0% mgmt
Financing live
Cash to close
- Down payment
- $288
- Closing costs
- $34
- Reserves months
- —
- Total cash needed
- —
Loan-product check · same deal, 3 products live
Conventional
25% down · 7.5% · 30yr
- Down + closing
- —
- Monthly P&I
- —
- Monthly cashflow
- —
- DSCR
- —
- Eligible?
- —
Personal DTI + credit; lowest rate.
DSCR
20% down · 8.5% · 30yr
- Down + closing
- —
- Monthly P&I
- —
- Monthly cashflow
- —
- DSCR
- —
- Eligible?
- —
No personal income docs; deal must DSCR.
Hard money
10% down · 12.0% · 12mo
- Down + closing
- —
- Monthly P&I
- —
- Monthly cashflow
- —
- DSCR
- —
- Eligible?
- —
Short-term bridge; refi at stabilization.
Rent comps 40 comps
| Address | Beds | Baths | Sqft | Rent | $/sqft | DOM | Units | Dist |
|---|---|---|---|---|---|---|---|---|
| 6200 W Tidwell Rd Houston, TX | 2.0–3.0 | 1.0–2.0 | 1101 | $1,300 | $1.18 | 2d | 11 | 0.05mi |
| 6150 W Tidwell Rd Unit 424 Houston, TX | 2.0 | 2.0 | 995 | $1,389 | $1.40 | 7d | 1 | 0.17mi |
| 6150 W Tidwell Rd Unit 6187 Houston, TX | 2.0 | 2.0 | 995 | $1,381 | $1.39 | 2d | 1 | 0.17mi |
| 6150 W Tidwell Rd Unit 6207 Houston, TX | 2.0 | 2.0 | 995 | $1,239 | $1.25 | 15d | 1 | 0.17mi |
| 5853 Village Forest Ct Houston, TX | 3.0 | 2.0 | 1142 | $1,600 | $1.40 | 43d | 1 | 0.42mi |
| 5801 N Houston Rosslyn Rd Houston, TX | 1.0–2.0 | 1.0–2.0 | 739 | $1,060 | $1.43 | 43d | 18 | 0.43mi |
| 5625 Antoine Dr Houston, TX | 1.0–2.0 | 1.0–2.0 | 1052 | $900 | $0.86 | 1d | 7 | 0.48mi |
| 5625 Antoine Dr Houston, TX | 1.0–2.0 | 1.0–2.5 | 888 | $900 | $1.01 | 24d | 12 | 0.48mi |
| 6101 Antoine Dr Houston, TX | 2.0 | 1.0–2.0 | 700 | $1,295 | $1.85 | 43d | 1 | 0.54mi |
| 5550 Bingle Rd Unit 2228 Houston, TX | 2.0 | 2.0 | 1190 | $1,379 | $1.16 | 2d | 1 | 0.58mi |
| 5550 Bingle Rd Unit 2112 Houston, TX | 2.0 | 2.0 | 1190 | $1,347 | $1.13 | 2d | 1 | 0.58mi |
| 5550 Bingle Rd Unit 5607 Houston, TX | 2.0 | 2.0 | 1190 | $1,379 | $1.16 | 10d | 1 | 0.58mi |
| 5550 Bingle Rd Apt 422 Houston, TX | 2.0 | 2.0 | 1190 | $1,355 | $1.14 | 7d | 1 | 0.58mi |
| 5550 Bingle Rd Unit 2162 Houston, TX | 2.0 | 2.0 | 1190 | $1,355 | $1.14 | 5d | 1 | 0.58mi |
| 6107 Antoine Dr Houston, TX | 2.0 | 2.0 | 1000 | $1,200 | $1.20 | 43d | 1 | 0.59mi |
| 6230 Rena St Unit 1316407P Houston, TX | 4.0 | 2.0 | 1765 | $6,957 | $3.94 | 3d | 1 | 0.61mi |
| 6240 Antoine Dr Unit 2047 Houston, TX | 2.0 | 2.0 | 890 | $981 | $1.10 | 2d | 1 | 0.62mi |
| 5550 Bingle Rd Houston, TX | 2.0 | 2.0 | 1190 | $1,580 | $1.33 | 19d | 1 | 0.63mi |
| 5550 Bingle Rd Unit 2047 Houston, TX | 2.0 | 2.0 | 1190 | $1,390 | $1.17 | 11d | 1 | 0.64mi |
| 5555 Antoine Dr Apt 502 Houston, TX | 2.0 | 1.0 | 917 | $781 | $0.85 | 7d | 1 | 0.64mi |
| 5555 Antoine Dr Apt 309 Houston, TX | 2.0 | 1.0 | 917 | $822 | $0.90 | 7d | 1 | 0.64mi |
| 5555 Antoine Dr Apt 401 Houston, TX | 2.0 | 2.0 | 1027 | $912 | $0.89 | 7d | 1 | 0.64mi |
| 5555 Antoine Dr Unit 0102 Houston, TX | 2.0 | 1.0 | 917 | $755 | $0.82 | 24d | 1 | 0.64mi |
| 5555 Antoine Dr Unit 0804 Houston, TX | 3.0 | 2.0 | 1179 | $1,008 | $0.85 | 1d | 1 | 0.64mi |
| 5950 Antoine Dr Houston, TX | 1.0–2.0 | 1.0–2.0 | 795 | $1,347 | $1.69 | 22d | 1 | 0.68mi |
| 6240 Antoine Dr Unit 6273 Houston, TX | 3.0 | 2.0 | 1484 | $1,432 | $0.96 | 2d | 1 | 0.68mi |
| 6240 Antoine Dr Unit 422 Houston, TX | 2.0 | 2.0 | 890 | $989 | $1.11 | 7d | 1 | 0.68mi |
| 5555 Antoine Dr Unit 0903 Houston, TX | 2.0 | 1.0 | 917 | $795 | $0.87 | 43d | 1 | 0.70mi |
| 5555 Antoine Dr Unit 0816 Houston, TX | 3.0 | 2.0 | 1179 | $1,260 | $1.07 | 1d | 1 | 0.70mi |
| 5555 Antoine Dr Unit 1012 Houston, TX | 2.0 | 2.0 | 1027 | $859 | $0.84 | 7d | 1 | 0.70mi |
| 5555 Antoine Dr Unit 0508 Houston, TX | 2.0 | 1.0 | 917 | $777 | $0.85 | 1d | 1 | 0.70mi |
| 5555 Antoine Dr Unit 0614 Houston, TX | 3.0 | 2.0 | 1179 | $985 | $0.84 | 43d | 1 | 0.70mi |
| 5555 Antoine Dr Unit 0405 Houston, TX | 2.0 | 2.0 | 1027 | $880 | $0.86 | 7d | 1 | 0.70mi |
| 5555 Antoine Dr Unit 0217 Houston, TX | 2.0 | 2.0 | 1027 | $880 | $0.86 | 43d | 1 | 0.70mi |
| 6318 Leaf Arbor Dr Houston, TX | 3.0 | 2.0 | 1478 | $2,250 | $1.52 | 43d | 1 | 0.73mi |
| 5500 Antoine Dr Unit 144 Houston, TX | 2.0 | 1.0 | 896 | $940 | $1.05 | 43d | 1 | 0.74mi |
| 5500 Antoine Dr Unit 232 Houston, TX | 2.0 | 2.0 | 1020 | $970 | $0.95 | 43d | 1 | 0.74mi |
| 5500 Antoine Dr Apt 222 Houston, TX | 2.0 | 2.0 | 1152 | $1,050 | $0.91 | 43d | 1 | 0.74mi |
| 5359 Deep Forest Dr Houston, TX | 3.0 | 2.0 | 1227 | $1,409 | $1.15 | 24d | 1 | 0.75mi |
| 5310 Lost Forest Dr Houston, TX | 1.0–2.0 | 1.0–2.0 | 808 | $1,147 | $1.42 | 12d | 7 | 0.77mi |
HOA detail condo
- Monthly dues
- $0 · $0/yr
- Assessments
- None detected in remarks — confirm with the listing agent.
Listing history 2 events
-
2026-06-09remarks 388-char remark
-
2026-06-09$1,150 Active 1 DOM
ⓘ Source: listings_history table (triggers on properties + properties_extension) + one-shot
backfill from property_details.listing_events for pre-trigger history.
Climate risk First Street
- Flood 5/10 Major FEMA zone X (unshaded) · 51% chance over 30 yrs
- Wildfire 1/10 Low
- Heat 9/10 Extreme 7 d/yr ≥109°F today · 25 d/yr by 30 yrs out
- Wind 9/10 Extreme 99% chance of damaging wind over 30 yrs
- Air quality 3/10 Moderate 3 unhealthy d/yr today · 4 by 30 yrs out
Nearby sold comps map
Loading sold comps map…
Walkable amenities ~0.75 mi
Loading nearby amenities…
Taxation est. · year 1
- Rental income
- $16,665
- − Mortgage interest
- −$64
- − Property taxes
- −$17
- − Insurance
- −$6
- − Repairs & maintenance
- −$1,333
- − Management
- −$1,333
- − HOA
- −$5,496
- − Depreciation
- −$33
- Taxable income
- $8,382
- Est. tax owed @ 24.0%
- −$2,012
- After-tax cash flow
- $5,562/yr
For passive investors: Depreciation is non-cash, so a rental often shows a tax loss while cash-flowing — sheltering income. Rental losses are passive: they offset passive income freely, and up to $25,000/yr can offset ordinary (W-2) income if you actively participate and your MAGI is under $100k (phasing out to $0 by $150k); unused losses carry forward. On sale, claimed depreciation is recaptured at up to 25%, and gains may owe capital-gains tax (a 1031 exchange can defer both). Figures are a year-1 estimate at your 24.0% rate — not tax advice; consult a CPA.
Schools (NCES district)
- District
- Aldine ISD
- NCES district ID
- 4807710
- Math proficiency
- 16% ▼ -23.00%
- Reading proficiency
- 21% ▼ -11.00%
- Median HH income
- $37,081
- Composite
- 15.42/100
- National rank
- #9317
- State rank
- #790 of 826 in TX
Livability — Houston
- Score
- 74/100
- State rank
- #184
- US rank
- #4771
Category grades
Schools grade is shown separately in the Schools card above.
Census & demographics
- Census place
- Houston, TX
- County
- Harris County · 4,702,590 people
- City population
- 3,226,434
- Metro
- Houston-The Woodlands-Sugar Land, TX
- Population (ZIP)
- 36,938
- Household income
- $58,728
- Rent vs Own
- Severe rent burden
- 1979.0
Population outlook (Harris County) Hauer SSP2
- Today (2025)
- 5,571,493 people
- By 2030
- 6,089,821 · +9.3%
- By 2040
- 7,142,806 · +28.2%
- By 2050
- 8,185,864 · +46.9%
- By 2075
- 10,574,329 · +89.8%
- By 2100
- 12,109,958 · +117.4%
Race, ethnicity, and origin ACS 2023
- Neighborhood character
- Diverse neighborhood (Simpson 0.56)
- Race & ethnicity
- Hispanic / Latino 60% White 25% Two or more races 22% Black 11% Native American 3% Asian 2%
- Hispanic origin (detail)
- Mexican 45%
- Common ancestry
- Lithuanian 1% Romanian 1% Italian 1%
- Foreign-born
- 30% · Canada
- Languages at home
- 47% English-only · Spanish 50% Other Indo-European 1%
Political lean MEDSL · Harris
- 2024 margin
- Lean D (+5.5) · D 52.0% · R 46.4% · Other 1.6%
- 2008→2024 swing
- +3.9pp toward D · 2008: 1.6pp · 2024: 5.5pp
- All cycles
- 2024: D+5.5 2020: D+13.3 2016: D+12.4 2012: D+0.1 2008: D+1.6
Not yet ingested
- Civics
- —
Market trends
- HPI YoY
- ▼ -84.24%
- Current HPI
- 300.5572
- Rent YoY
- ▼ -2.36%
- Metro
- Houston-The Woodlands-Sugar Land, TX
- State GDP YoY
- ▲ 3.95%
- F500 in state
- 110
Industry mix (Fortune 500 HQ in TX)
| Industry | F500 HQs | Revenue |
|---|---|---|
| Energy | 16 | $1,198B |
|
||
| Technology | 5 | $198B |
|
||
| Engineering / Construction | 4 | $72B |
|
||
| Energy Services | 3 | $60B |
|
||
| Utilities | 3 | $41B |
|
||
| Healthcare | 2 | $330B |
|
||
Price history
-98.4% since first listed14 events — show timeline
- 2026-06-08 Listed $1,150 HARMLS
- 2026-02-13 Rental Removed $1,100 HARMLS
- 2025-12-19 Listed for Rent $1,200 HARMLS
- 2025-12-18 Listing Removed — HARMLS
- 2025-12-18 Listed $1,200 HARMLS
- 2024-09-04 Sold (Public Records) — Public Records
- 2021-12-28 Sold (Public Records) — Public Records
- 2021-12-27 Sold (Public Records) — Public Records
- 2021-12-17 Sold (MLS) — HARMLS
- 2021-12-17 Pending — HARMLS
- 2021-12-14 Pending — HARMLS
- 2021-12-03 Listed $72,000 HARMLS
- 2014-06-30 Sold (Public Records) — Public Records
- 2011-01-06 Sold (Public Records) — Public Records
Property tax history
+10.7%/yrLatest (2025): $1,730 · -17.1% YoY. Source: county tax records.
Cash-flow waterfall
monthlySold comps — $/sqft
last 12 mo · ≤1 miLoading sold comps…