 🏷️ Likely Rental
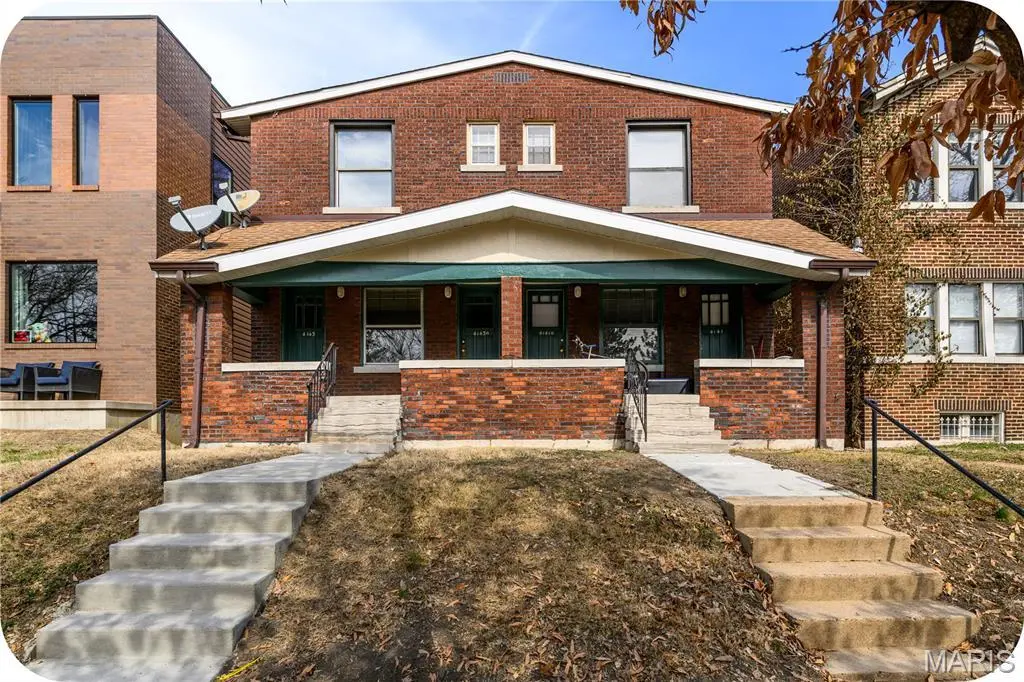
4141 Lafayette Ave · St. Louis, MO
Flood risk 1/10 · Minimal
- FEMA flood zone
- X (unshaded)
- Chance of flooding over 30 yrs
- 0.0%
- Est. flood insurance / yr
- $473 – $860
Fire risk 1/10 · Minimal
- Est. fire insurance / yr
- $1,054 – $1,958
Heat risk 5/10 · Moderate
- Hot days now (above 108°F)
- 7 days/yr
- Hot days in 30 yrs
- 21 days/yr
Wind risk 2/10 · Minimal
- Chance of severe wind over 30 yrs
- 1.0%
Air-quality risk 3/10 · Minor
- Unhealthy air days now
- 3 days/yr
- Unhealthy air days in 30 yrs
- 4 days/yr
Risk factors via First Street. Map © Google.
Why this score? — see what drove the B+ grade
The composite is a weighted blend of 9 inputs, each scored 0–100. Each bar is that input's sub-score; the figure is the points it added to the 100-point composite (weight × sub-score).
- Cash flow +30.0/30.0
- ARV discount +15.0/15.0
- 1% rule +10.0/10.0
- DSCR +10.0/10.0
- Rent growth +4.1/5.0
- Livability +2.5/5.0
- Condition / age +2.5/5.0
- Schools +1.2/10.0
- Appreciation +0.0/10.0
$349,500
🖨 Deal sheet 📄 Offer letter ✓ Due diligence
Multi-family units
County records classify this as Multi-Family (2-4 Unit). Listing-text estimate: 4 units. confirmed
Listing remarks MLS
Great investment opportunity in sought-after Botanical Heights! This well-maintained 4-family offers strong rental potential and is also ideal for an owner-occupant looking to have 3 tenants help cover the mortgage. Each unit is approximately 900 sq ft and features a private exterior entrance, spacious living room, dining room, kitchen, bathroom, and private bedroom. 3 units have recently been vacated and refreshed with cosmetic updates, fresh paint, and new kitchen cabinets; ready for immediate leasing. The 4th unit is currently on a month-to-month lease, providing value-add potential and flexibility for future rent increases. The basement offers laundry hookups and plenty of storage space. Tenants will appreciate the off-street parking in the rear with a brand-new concrete pad and sidewalk. Major improvements include a new TPO roof installed in 2020 and a new sewer lateral. Ideally located between Shaw and The Grove, you’re just a short walk to restaurants, nightlife, and the beautiful Missouri Botanical Garden. Nearby Tower Grove Park offers farmers markets, food trucks, festivals, and incredible green space. This is an unbeatable location that tenants love!
Key facts
- Fresh paint
- New kitchen cabinets
- Cosmetic updates
Tags
Neighborhood map
What this means for you Summary
Snapshot
- This is a 3×3bd/1.0ba + 1×1bd/1.0ba units multifamily listed at $350k.
Deal economics
- At list price, monthly cash flow is $3k ($32k/yr) — positive. Per door: $670/mo.
- The deal already cash-flows at list — no discount required.
- Meets the 1% rule at list price ($6k rent vs $350k).
- Recommended offer: $339k (3.0% below list) — sets the bar for market timing.
- Cap rate 15.5% vs local median 5.0% in St. Louis — top-decile yield for the area; either an underpriced asset or a hidden risk that comps aren't pricing in. Stress-test before assuming the spread holds.
Location & tenants
- Location reads: area grade B — affects rentability + tenant quality, not the cash-flow math above.
- St. Louis City (urban): math 10% / reading 18% proficiency, ranked #312 of 324 in MO (top 96%) — low school quality limits family demand, transient renter base, plan for 1-2y turnover; 80% free/reduced lunch — lower-income household profile, screen leases tightly.
- Market conditions: Rents rising fast (+6.2%/yr); 98 active listings in the ZIP; solid renter incomes; 294 units permitted in St. Louis city in 2024 (227 in 5+ unit buildings).
- At $5,997/mo this rent would consume 88% of the median local household income ($82k/yr) (locally 921% of renters already pay >50% of income on rent) — very limited rent-growth headroom before tenants either downsize or default.
Forward outlook
- Local home prices are declining (-3.0%/yr); year-one equity from $2k of loan paydown is wiped out by about $10k of value loss. Plan a longer hold.
- St. Louis County population projected to shrink 6% by 2050 — rents likely to lag national; underwrite the cash flow, not the appreciation.
- At projected returns (-3.0% appreciation + 6.2% rent growth), your $98k cash investment doubles in ~4 years — after that, you're playing with house money.
Negotiation context
- It's been on market 57 days — a 3% lower offer ($339k) is reasonable based on typical stale-listing flexibility.
- 3 sale attempts; this cycle's ask has dropped $26k (7%) from the opening price — seller is motivated, your offer sets the floor, not the list.
- Current owner paid $30k; list at $350k implies a 1065% gain — meaningful room to come down on a strong offer.
Risks & watch-outs
- Watch-outs: built in 1917 — expect roof / HVAC / electrical / plumbing capex.
- Climate carrying-cost: extreme-heat days projected 7→21/yr by 2055 (HVAC capex compounding) — expect insurance premiums to compound above CPI over the hold.
Questions for the listing agent
- It's been on market 57 days. Have you received any prior offers? Is the seller open to a 3% concession, seller financing, or rate buy-down credit?
- Can we see the unit-by-unit rent roll, current vacancy, and any below-market leases? What's the average tenancy length?
- What capital expenditures (roof, boiler, parking lot, exteriors) have been made in the last 5 years, and what's planned in the next 2?
- Built in 1917 — when were the roof, HVAC, electrical panel, plumbing, and water heater last replaced?
- Is there a deadline driving the sale (1031 exchange, divorce, estate, relocation)? That informs how much negotiation room exists.
- What's the average days-on-market for RENTAL listings here right now (not sales)? A rising rental-DOM trend means longer vacancies and softer asking-rent achievability than the comps imply.
- What's the recent tenant-quality profile in this submarket — average credit score on applications, eviction rate, late-payment / NSF rate, and stable-employment percentage? A property-management company in the area should have these aggregated.
- How much new apartment / multifamily construction is in the pipeline within 1–3 miles? Heavy new supply (>2% of stock underway) typically softens rents 12–24 months out; light construction supports rent growth.
Investment metrics
- 1% rule
- 1.72% ✓
- Cap rate
- 15.49%
- Cash-on-cash
- 32.85%
- DSCR
- 2.46
- GRM
- 4.9
CMA / ARV
- ARV (median comp)
- $458,598
- List price
- $349,500
- Delta
- -23.79%
- Verdict
- UNDERPRICED
- Comps
- 20 within 1.0 mi
Projected returns pro-forma
-3.0% appreciation · 6.24% rent growth · sell at horizon
- IRR
- 31.4%
- Equity multiple
- 2.37×
- Total profit
- $134,066
- Equity at exit
- $52,112
- IRR
- 40.2%
- Equity multiple
- 5.34×
- Total profit
- $424,485
- Equity at exit
- $30,218
Cash invested: $97,860 (down + closing). Projections, not guarantees.
Landlord ↔ Tenant lean methodology
- Overall (STATE)
- 81 Strongly Landlord-Friendly
- State Missouri
- 81 Strongly Landlord-Friendly · R+10
- County
- — inherits STATE
- City
- — inherits STATE
ZIP-level market 63110
- Rents YoY
- 6.2%
- Active inventory
- 98
- Price-to-rent
- 18.6×
Monthly cashflow live
- Estimated rent
- $5,997 high interval (Pro) →
- Mortgage (P&I)
- −$1,833
- Tax from tax record
- −$80 /mo · $959/yr
- Insurance
- −$146
- HOA
- −$0
- Vacancy / Maint / Mgmt
- −$1,259
- Net cashflow
- $2,679
Break-even live
4-unit breakdown (identical units grouped — click to expand)
| Units | Beds | Baths | Est. rent |
|---|---|---|---|
| 3× units | 3 | 1 | $4,704 |
| #1 | 3 | 1 | $1,568 |
| #2 | 3 | 1 | $1,568 |
| #3 | 3 | 1 | $1,568 |
| 1× unit | 1 | 1 | $1,294 |
| Total (4 units) | $5,997 | ||
UW: 25.0% down · 7.5% · 30yr · 1.5% tax · 5.0% vac · 8.0% maint · 8.0% mgmt
Financing live
Cash to close
- Down payment
- $87,375
- Closing costs
- $10,485
- Reserves months
- —
- Total cash needed
- —
Loan-product check · same deal, 3 products live
Conventional
25% down · 7.5% · 30yr
- Down + closing
- —
- Monthly P&I
- —
- Monthly cashflow
- —
- DSCR
- —
- Eligible?
- —
Personal DTI + credit; lowest rate.
DSCR
20% down · 8.5% · 30yr
- Down + closing
- —
- Monthly P&I
- —
- Monthly cashflow
- —
- DSCR
- —
- Eligible?
- —
No personal income docs; deal must DSCR.
Hard money
10% down · 12.0% · 12mo
- Down + closing
- —
- Monthly P&I
- —
- Monthly cashflow
- —
- DSCR
- —
- Eligible?
- —
Short-term bridge; refi at stabilization.
Listing history 20 events
-
2026-06-18days on market $349,500 Active 57 DOM
-
2026-06-17days on market $349,500 Active 56 DOM
-
2026-06-16days on market $349,500 Active 55 DOM
-
2026-06-15days on market $349,500 Active 54 DOM
-
2026-06-13days on market $349,500 Active 52 DOM
-
2026-06-09days on market $349,500 Active 48 DOM
-
2026-06-08days on market $349,500 Active 47 DOM
-
2026-06-07days on market $349,500 Active 46 DOM
-
2026-06-05days on market $349,500 Active 43 DOM
-
2026-06-03days on market $349,500 Active 42 DOM
-
2026-06-02days on market $349,500 Active 41 DOM
-
2026-06-01days on market $349,500 Active 40 DOM
-
2026-05-31days on market $349,500 Active 39 DOM
-
2026-05-05price $349,500 1185-char remark
Show marketing remark (1185 chars)
Great investment opportunity in sought-after Botanical Heights! This well-maintained 4-family offers strong rental potential and is also ideal for an owner-occupant looking to have 3 tenants help cover the mortgage. Each unit is approximately 900 sq ft and features a private exterior entrance, spacious living room, dining room, kitchen, bathroom, and private bedroom. 3 units have recently been vacated and refreshed with cosmetic updates, fresh paint, and new kitchen cabinets; ready for immediate leasing. The 4th unit is currently on a month-to-month lease, providing value-add potential and flexibility for future rent increases. The basement offers laundry hookups and plenty of storage space. Tenants will appreciate the off-street parking in the rear with a brand-new concrete pad and sidewalk. Major improvements include a new TPO roof installed in 2020 and a new sewer lateral. Ideally located between Shaw and The Grove, you’re just a short walk to restaurants, nightlife, and the beautiful Missouri Botanical Garden. Nearby Tower Grove Park offers farmers markets, food trucks, festivals, and incredible green space. This is an unbeatable location that tenants love!
-
2026-05-05price $349,500
Show marketing remark (1185 chars)
Great investment opportunity in sought-after Botanical Heights! This well-maintained 4-family offers strong rental potential and is also ideal for an owner-occupant looking to have 3 tenants help cover the mortgage. Each unit is approximately 900 sq ft and features a private exterior entrance, spacious living room, dining room, kitchen, bathroom, and private bedroom. 3 units have recently been vacated and refreshed with cosmetic updates, fresh paint, and new kitchen cabinets; ready for immediate leasing. The 4th unit is currently on a month-to-month lease, providing value-add potential and flexibility for future rent increases. The basement offers laundry hookups and plenty of storage space. Tenants will appreciate the off-street parking in the rear with a brand-new concrete pad and sidewalk. Major improvements include a new TPO roof installed in 2020 and a new sewer lateral. Ideally located between Shaw and The Grove, you’re just a short walk to restaurants, nightlife, and the beautiful Missouri Botanical Garden. Nearby Tower Grove Park offers farmers markets, food trucks, festivals, and incredible green space. This is an unbeatable location that tenants love!
-
2026-04-22$375,000 Active 1185-char remark
Show marketing remark (1185 chars)
Great investment opportunity in sought-after Botanical Heights! This well-maintained 4-family offers strong rental potential and is also ideal for an owner-occupant looking to have 3 tenants help cover the mortgage. Each unit is approximately 900 sq ft and features a private exterior entrance, spacious living room, dining room, kitchen, bathroom, and private bedroom. 3 units have recently been vacated and refreshed with cosmetic updates, fresh paint, and new kitchen cabinets; ready for immediate leasing. The 4th unit is currently on a month-to-month lease, providing value-add potential and flexibility for future rent increases. The basement offers laundry hookups and plenty of storage space. Tenants will appreciate the off-street parking in the rear with a brand-new concrete pad and sidewalk. Major improvements include a new TPO roof installed in 2020 and a new sewer lateral. Ideally located between Shaw and The Grove, you’re just a short walk to restaurants, nightlife, and the beautiful Missouri Botanical Garden. Nearby Tower Grove Park offers farmers markets, food trucks, festivals, and incredible green space. This is an unbeatable location that tenants love!
-
2026-04-06status Active
-
2026-03-17status Pending
-
2026-03-10$375,000 Active
-
2002-05-31soldstatus $30,000
ⓘ Source: listings_history table (triggers on properties + properties_extension) + one-shot
backfill from property_details.listing_events for pre-trigger history.
Tax reassessment forecast MO · Resets to sale price
- Current annual tax
- $959 · $80/mo
- Projected year-2 tax
- $3,390 · $283/mo
- Expected delta
- +$2,431/yr (+$203/mo · 253.6%)
ⓘ Screening estimate from a state-policy table — verify with the county assessor before closing.
Climate risk First Street
- Flood 1/10 Low FEMA zone X (unshaded) · 0% chance over 30 yrs
- Wildfire 1/10 Low
- Heat 5/10 Major 7 d/yr ≥108°F today · 21 d/yr by 30 yrs out
- Wind 2/10 Low 100% chance of damaging wind over 30 yrs
- Air quality 3/10 Moderate 3 unhealthy d/yr today · 4 by 30 yrs out
Nearby sold comps map
Loading sold comps map…
Walkable amenities ~0.75 mi
Loading nearby amenities…
Taxation est. · year 1
- Rental income
- $71,964
- − Mortgage interest
- −$19,577
- − Property taxes
- −$959
- − Insurance
- −$1,748
- − Repairs & maintenance
- −$5,757
- − Management
- −$5,757
- − Depreciation
- −$10,167
- Taxable income
- $27,999
- Est. tax owed @ 24.0%
- −$6,720
- After-tax cash flow
- $25,432/yr
For passive investors: Depreciation is non-cash, so a rental often shows a tax loss while cash-flowing — sheltering income. Rental losses are passive: they offset passive income freely, and up to $25,000/yr can offset ordinary (W-2) income if you actively participate and your MAGI is under $100k (phasing out to $0 by $150k); unused losses carry forward. On sale, claimed depreciation is recaptured at up to 25%, and gains may owe capital-gains tax (a 1031 exchange can defer both). Figures are a year-1 estimate at your 24.0% rate — not tax advice; consult a CPA.
Schools (NCES district)
- District
- St. Louis City
- NCES district ID
- 2929280
- Math proficiency
- 10% ▼ -6.00%
- Reading proficiency
- 18% ▼ -3.00%
- Median HH income
- $35,685
- Composite
- 11.54/100
- National rank
- #9699
- State rank
- #312 of 324 in MO
Livability — St. Louis
No livability data for this city. (Only ~50 U.S. cities are tracked.)
Census & demographics
- Census place
- St. Louis, MO
- County
- Saint Louis City · 254,015 people
- City population
- 283,259
- Metro
- St. Louis, MO-IL
- Population (ZIP)
- 17,645
- Household income
- $81,655
- Rent vs Own
- Severe rent burden
- 921.0
Population outlook (St. Louis County) Hauer SSP2
- Today (2025)
- 315,737 people
- By 2030
- 313,865 · -0.6%
- By 2040
- 305,439 · -3.3%
- By 2050
- 296,529 · -6.1%
- By 2075
- 271,028 · -14.2%
- By 2100
- 255,359 · -19.1%
Race, ethnicity, and origin ACS 2023
- Neighborhood character
- Majority White (65%)
- Race & ethnicity
- White 65% Black 19% Two or more races 9% Hispanic / Latino 8% Asian 4%
- Hispanic origin (detail)
- Mexican 5%
- Common ancestry
- Lithuanian 5% Slovak 3% Italian 3%
- Foreign-born
- 6% · Canada, China, South Korea
- Languages at home
- 91% English-only · Spanish 3% French/Haitian/Cajun 1% Other Asian/Pacific 1%
Political lean MEDSL · St. Louis
- 2024 margin
- Solid D (+64.7) · D 81.4% · R 16.7% · Other 2.0%
- 2008→2024 swing
- -3.5pp toward R · 2008: 68.2pp · 2024: 64.7pp
- All cycles
- 2024: D+64.7 2020: D+66.2 2016: D+63.7 2012: D+66.6 2008: D+68.2
Not yet ingested
- Civics
- —
Market trends
- HPI YoY
- ▼ -206.93%
- Current HPI
- 342.2466
- Rent YoY
- ▲ 6.24%
- Metro
- St. Louis, MO-IL
- State GDP YoY
- ▲ 1.84%
- F500 in state
- 20
Industry mix (Fortune 500 HQ in MO)
| Industry | F500 HQs | Revenue |
|---|---|---|
| Healthcare | 1 | $163B |
|
||
| Insurance | 1 | $21B |
|
||
| Industrial Technology | 1 | $17B |
|
||
| Retail | 1 | $16B |
|
||
| Industrial Distribution | 1 | $10B |
|
||
| Utilities | 1 | $9B |
|
||
Price history
+1065.0% since first listed7 events — show timeline
- 2026-05-05 Price Changed $349,500 MARIS as Distributed by MLS Grid
- 2026-05-05 Price Changed $349,500 MARIS as Distributed by MLS Grid
- 2026-04-22 Listed $375,000 MARIS as Distributed by MLS Grid
- 2026-04-06 Relisted — MARIS as Distributed by MLS Grid
- 2026-03-17 Pending — MARIS as Distributed by MLS Grid
- 2026-03-10 Listed $375,000 MARIS as Distributed by MLS Grid
- 2002-05-31 Sold (Public Records) $30,000 Public Records
Property tax history
+4.6%/yrLatest (2024): $959 · +5.0% YoY. Source: county tax records.
Cash-flow waterfall
monthlySold comps — $/sqft
last 12 mo · ≤1 miLoading sold comps…