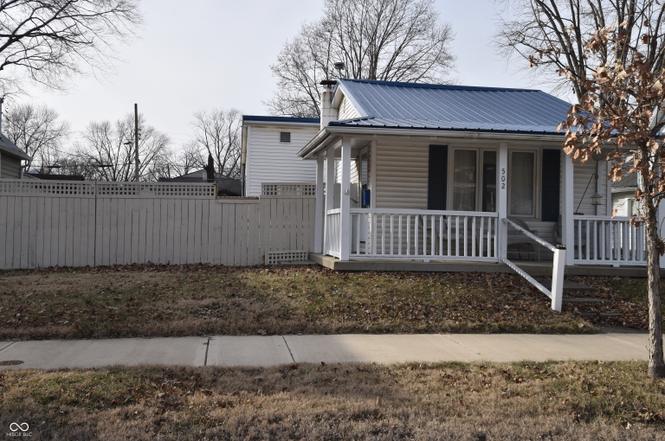
502 S State St · Greenfield, IN
Flood risk 1/10 · Minimal
- FEMA flood zone
- X (unshaded)
- Chance of flooding over 30 yrs
- 0.0%
- Est. flood insurance / yr
- $473 – $860
Fire risk 1/10 · Minimal
- Est. fire insurance / yr
- $717 – $1,331
Heat risk 3/10 · Minor
- Hot days now (above 102°F)
- 7 days/yr
- Hot days in 30 yrs
- 18 days/yr
Wind risk 2/10 · Minimal
- Chance of severe wind over 30 yrs
- 1.0%
Air-quality risk 2/10 · Minimal
- Unhealthy air days now
- 1 days/yr
- Unhealthy air days in 30 yrs
- 2 days/yr
Risk factors via First Street. Map © Google.
Why this score? — see what drove the C grade
The composite is a weighted blend of 9 inputs, each scored 0–100. Each bar is that input's sub-score; the figure is the points it added to the 100-point composite (weight × sub-score).
- Cash flow +18.3/30.0
- ARV discount +15.0/15.0
- DSCR +5.7/10.0
- 1% rule +4.2/10.0
- Schools +4.0/10.0
- Livability +3.7/5.0
- Rent growth +3.2/5.0
- Condition / age +2.5/5.0
- Appreciation +0.0/10.0
$109,900
🖨 Deal sheet (PDF) 📄 Offer letter ✓ Due diligence
Listing remarks MLS
Amazing opportunity for this cute 1 bedroom, 1 bath bungalow. The wrap around front covered porch adds to the appeal of this immaculate home. New metal roof(2021), new water heater, and 100 amp electric service(2022). Eat-in kitchen with tons of cabinets plus a formal dining rm. Fenced rear yard with 20x8 covered patio and 20x24 detached garage with single off door - leaves lots of room for workshop/storage. There is a lot here for the money - ACT NOW!
Key facts
- Covered front porch
- Metal roof
- Fenced yard
Tags
Property features AI
Finance
- Other: Lot under 1/4 acre (approximately 0.182 acre)
Exterior
- Parking: Detached gravel garage with storage and service door; Garage door opener; 1-car garage
- Utilities: Public water; Municipal sewer connected; Natural gas connected; Cable available
- Home design: Single-family residence; One story; East-facing
- Construction: Vinyl siding; Block foundation
- Exterior features: Covered porch; Full yard fence; Sidewalks; Street lights; Mature trees and small trees
Interior
- Kitchen: Gas oven; Range hood
- Bedrooms: One bedroom on the main level
- Bathrooms: One full bathroom on the main level
- Heating & cooling: Forced air heating (natural gas); Central air conditioning
- Interior features: Eat-in kitchen; Painted woodwork
- Laundry & utility: Main-level laundry; Gas water heater
Neighborhood map
What this means for you Summary
Snapshot
- This is a 1-bed/1.0-bath single-family listed at $110k.
Deal economics
- At list price, monthly cash flow is $100 ($1k/yr) — positive.
- The deal already cash-flows at list — no discount required.
- To meet the 1% rule (rent ≥ 1% of price), the offer needs to be $101k (8.4% below list).
- Recommended offer: $100k (9.0% below list) — sets the bar for market timing.
- Cap rate 7.4% vs local median 4.7% in Greenfield — top-decile yield for the area; either an underpriced asset or a hidden risk that comps aren't pricing in. Stress-test before assuming the spread holds.
Location & tenants
- Location reads 73/100 on livability (#88 in IN) — a middle-class / working-renter tenant base. Strengths: cost of living A+, housing A+; Watch: amenities F, commute F.
- Greenfield-Central Community Schools (other): math 47% / reading 45% proficiency, ranked #83 of 301 in IN (top 28%) — families likely to look elsewhere, expect single-tenant / working-renter base with shorter leases.
- Zoned schools: Harris Elementary School (math 57% / reading 37%, grade D-, #325 of 994 statewide, top 36%, 280 students, 57% FRL); Greenfield Central Junior High Sch (math 38% / reading 42%, grade F, #120 of 330 statewide, top 37%, 675 students, 45% FRL); Greenfield-Central High School (math 37% / reading 65%, grade D+, #115 of 369 statewide, top 31%, 1,462 students, 35% FRL) — zoned schools average 46% FRL vs 29% district-wide (17 pts higher); higher-poverty schools than district average — tighter screening recommended.
- Market conditions: Rents rising (+2.9%/yr); 481 active listings in the ZIP; 3 comparable units currently listed for rent nearby; rentals at typical pace (median 14d on market — plan ~3-4 weeks tenant-placement turnaround); solid renter incomes; 1,091 units permitted in Hancock County in 2024 (0 in 5+ unit buildings).
- This rent is only 15% of the median local income ($83k/yr) — well below the 30% rent-burden line; pricing power to push rent on renewal without tenant pushback.
Forward outlook
- Local home prices are declining (-3.0%/yr); year-one equity from $760 of loan paydown is wiped out by about $3k of value loss. Plan a longer hold.
- Hancock County population projected at +7% by 2050 — modest demand growth; plan on rents tracking national, not racing it.
Negotiation context
- It's been on market 100 days — a 9% lower offer ($100k) is reasonable based on typical stale-listing flexibility.
- 2 sale attempts since 4y ago; this cycle's ask has dropped $10k (8%) from the opening price — seller is motivated, your offer sets the floor, not the list.
Risks & watch-outs
- Watch-outs: built in 1900 — expect roof / HVAC / electrical / plumbing capex.
Questions for the listing agent
- It's been on market 100 days. Have you received any prior offers? Is the seller open to a 9% concession, seller financing, or rate buy-down credit?
- Built in 1900 — when were the roof, HVAC, electrical panel, plumbing, and water heater last replaced?
- Why hasn't it sold? Are there any deal-killer items the seller is aware of (foundation, flood, title, zoning, code violations)?
- Is there a deadline driving the sale (1031 exchange, divorce, estate, relocation)? That informs how much negotiation room exists.
- Schools are B-rated — typically a magnet for longer-tenancy family renters. What's the average tenant stay here, and is there a school-zone premium baked into asking?
- What's the average days-on-market for RENTAL listings here right now (not sales)? A rising rental-DOM trend means longer vacancies and softer asking-rent achievability than the comps imply.
- What's the recent tenant-quality profile in this submarket — average credit score on applications, eviction rate, late-payment / NSF rate, and stable-employment percentage? A property-management company in the area should have these aggregated.
- How much new for-sale + rental construction is in the pipeline within 1–3 miles? Heavy new supply typically softens prices + rents 12–24 months out; constrained supply supports both.
Investment metrics
- 1% rule
- 0.92% ✗
- Cap rate
- 7.39%
- Cash-on-cash
- 3.90%
- DSCR
- 1.17
- GRM
- 9.1
CMA / ARV
- ARV (on-the-fly)
- $171,360
- Comps found
- 2
Show comp detail 2 sales within ~0.75 mi
| Address | Dist | Beds/Ba | Sqft | Sold | Price | $/sf | Match |
|---|---|---|---|---|---|---|---|
| 502 S State St | 0.00mi | 1/1.0 | 720 (0%) | 0mo | $109,900 | $153 | 100 |
| 520 Mount St | 0.07mi | 2/1.0 (+1) | 672 (-7%) | 23mo | $160,000 | $238 | 62 |
Match score weights: distance 35% · size 25% · config 20% · recency 20%. Top-matched comps best support the ARV.
Projected returns pro-forma
-3.0% appreciation · 2.88% rent growth · sell at horizon
- IRR
- -10.3%
- Equity multiple
- 0.62×
- Total profit
- $-11,583
- Equity at exit
- $16,386
- IRR
- -1.2%
- Equity multiple
- 0.92×
- Total profit
- $-2,477
- Equity at exit
- $9,502
Cash invested: $30,772 (down + closing). Projections, not guarantees.
Landlord ↔ Tenant lean methodology
- Overall (STATE)
- 90 Strongly Landlord-Friendly
- State Indiana
- 90 Strongly Landlord-Friendly · R+11
- County
- — inherits STATE
- City
- — inherits STATE
ZIP-level market 46140
- Rents YoY
- 2.9%
- Active inventory
- 481
- Price-to-rent
- 9.1×
Monthly cashflow live
- Estimated rent
- $1,007 medium interval (Pro) →
- Mortgage (P&I)
- −$576
- Tax from tax record
- −$73 /mo · $878/yr
- Insurance
- −$46
- HOA
- −$0
- Vacancy / Maint / Mgmt
- −$211
- Net cashflow
- $100
Break-even live
Sensitivity live
| Price | -10% $162 | -5% $131 | +0% $100 | +5% $69 | +10% $38 |
|---|---|---|---|---|---|
| Rent | -10% $21 | -5% $60 | +0% $100 | +5% $140 | +10% $180 |
| Rate | -1.0pp $155 | -0.5pp $128 | base $100 | +0.5pp $72 | +1.0pp $43 |
UW: 25.0% down · 7.5% · 30yr · 1.5% tax · 5.0% vac · 8.0% maint · 8.0% mgmt
Financing live
Cash to close
- Down payment
- $27,475
- Closing costs
- $3,297
- Reserves months
- —
- Total cash needed
- —
Loan-product check · same deal, 3 products live
Conventional
25% down · 7.5% · 30yr
- Down + closing
- —
- Monthly P&I
- —
- Monthly cashflow
- —
- DSCR
- —
- Eligible?
- —
Personal DTI + credit; lowest rate.
DSCR
20% down · 8.5% · 30yr
- Down + closing
- —
- Monthly P&I
- —
- Monthly cashflow
- —
- DSCR
- —
- Eligible?
- —
No personal income docs; deal must DSCR.
Hard money
10% down · 12.0% · 12mo
- Down + closing
- —
- Monthly P&I
- —
- Monthly cashflow
- —
- DSCR
- —
- Eligible?
- —
Short-term bridge; refi at stabilization.
Rent comps 3 comps
| Address | Beds | Baths | Sqft | Rent | $/sqft | DOM | Units | Dist |
|---|---|---|---|---|---|---|---|---|
| 511 S Pennsylvania St Unit b Greenfield, IN | — | 1.0 | 600 | $850 | $1.42 | 19d | 1 | 0.10mi |
| 22 Wilson St Greenfield, IN | 2.0 | 1.0 | 600 | $925 | $1.54 | 14d | 1 | 0.60mi |
| 502 Ginny Trce Greenfield, IN | 1.0–3.0 | 1.0–2.5 | 978 | $1,104 | $1.13 | 0d | 23 | 1.40mi |
Listing history 6 events
-
2026-05-02status Pending
-
2026-04-07price $109,900
-
2026-01-22$119,900 Active
-
2022-09-15soldstatus $102,500 Closed 456-char remark
Show marketing remark (456 chars)
Amazing opportunity for this cute 1 bedroom, 1 bath bungalow. The wrap around front covered porch adds to the appeal of this immaculate home. New metal roof(2021), new water heater, and 100 amp electric service(2022). Eat-in kitchen with tons of cabinets plus a formal dining rm. Fenced rear yard with 20x8 covered patio and 20x24 detached garage with single off door - leaves lots of room for workshop/storage. There is a lot here for the money - ACT NOW!
-
2022-08-05status Pending 456-char remark
Show marketing remark (456 chars)
Amazing opportunity for this cute 1 bedroom, 1 bath bungalow. The wrap around front covered porch adds to the appeal of this immaculate home. New metal roof(2021), new water heater, and 100 amp electric service(2022). Eat-in kitchen with tons of cabinets plus a formal dining rm. Fenced rear yard with 20x8 covered patio and 20x24 detached garage with single off door - leaves lots of room for workshop/storage. There is a lot here for the money - ACT NOW!
-
2022-07-27$115,900 Active 456-char remark
Show marketing remark (456 chars)
Amazing opportunity for this cute 1 bedroom, 1 bath bungalow. The wrap around front covered porch adds to the appeal of this immaculate home. New metal roof(2021), new water heater, and 100 amp electric service(2022). Eat-in kitchen with tons of cabinets plus a formal dining rm. Fenced rear yard with 20x8 covered patio and 20x24 detached garage with single off door - leaves lots of room for workshop/storage. There is a lot here for the money - ACT NOW!
ⓘ Source: listings_history table (triggers on properties + properties_extension) + one-shot
backfill from property_details.listing_events for pre-trigger history.
Tax reassessment forecast IN · Partial reset (capped growth)
- Current annual tax
- $878 · $73/mo
- Projected year-2 tax
- $906 · $76/mo
- Expected delta
- +$28/yr (+$2/mo · 3.2%)
ⓘ Screening estimate from a state-policy table — verify with the county assessor before closing.
Climate risk First Street
- Flood 1/10 Low FEMA zone X (unshaded) · 0% chance over 30 yrs
- Wildfire 1/10 Low
- Heat 3/10 Moderate 7 d/yr ≥102°F today · 18 d/yr by 30 yrs out
- Wind 2/10 Low 100% chance of damaging wind over 30 yrs
- Air quality 2/10 Low 1 unhealthy d/yr today · 2 by 30 yrs out
Nearby sold comps map
Loading sold comps map…
Walkable amenities ~0.75 mi
Loading nearby amenities…
Taxation est. · year 1
- Rental income
- $12,081
- − Mortgage interest
- −$6,156
- − Property taxes
- −$878
- − Insurance
- −$550
- − Repairs & maintenance
- −$966
- − Management
- −$966
- − Depreciation
- −$3,197
- Taxable loss
- −$633
- Est. tax savings @ 24.0%
- +$152
- After-tax cash flow
- $1,352/yr
For passive investors: Depreciation is non-cash, so a rental often shows a tax loss while cash-flowing — sheltering income. Rental losses are passive: they offset passive income freely, and up to $25,000/yr can offset ordinary (W-2) income if you actively participate and your MAGI is under $100k (phasing out to $0 by $150k); unused losses carry forward. On sale, claimed depreciation is recaptured at up to 25%, and gains may owe capital-gains tax (a 1031 exchange can defer both). Figures are a year-1 estimate at your 24.0% rate — not tax advice; consult a CPA.
Schools (NCES district)
- District
- Greenfield-Central Community Schools
- NCES district ID
- 1804050
- Math proficiency
- 47% ▼ -12.00%
- Reading proficiency
- 45% ▼ -11.00%
- Median HH income
- $55,533
- Composite
- 40.01/100
- National rank
- #3827
- State rank
- #83 of 301 in IN
Livability — Greenfield
- Score
- 73/100
- State rank
- #88
- US rank
- #5094
Category grades
Schools grade is shown separately in the Schools card above.
Census & demographics
- Census place
- Greenfield, IN
- County
- Hancock County · 59,521 people
- City population
- 43,511
- Metro
- Indianapolis-Carmel-Anderson, IN
- Population (ZIP)
- 43,511
- Household income
- $83,056
- Rent vs Own
- Severe rent burden
- 795.0
Population outlook (Hancock County) Hauer SSP2
- Today (2025)
- 77,820 people
- By 2030
- 79,914 · +2.7%
- By 2040
- 82,734 · +6.3%
- By 2050
- 83,348 · +7.1%
- By 2075
- 82,439 · +5.9%
- By 2100
- 74,181 · -4.7%
Race, ethnicity, and origin ACS 2023
- Neighborhood character
- Predominantly White (92%)
- Race & ethnicity
- White 92% Two or more races 5% Hispanic / Latino 3% Black 1%
- Common ancestry
- Italian 3% Lithuanian 3% Slovak 1%
- Foreign-born
- 3% · Canada
- Languages at home
- 96% English-only · Spanish 2% Other Indo-European 1%
Political lean MEDSL · Hancock
- 2024 margin
- Solid R (+33.7) · D 32.2% · R 65.9% · Other 1.9%
- 2008→2024 swing
- -4.1pp toward R · 2008: -29.6pp · 2024: -33.7pp
- All cycles
- 2024: R+33.7 2020: R+37.5 2016: R+44.8 2012: R+41.0 2008: R+29.6
Not yet ingested
- Civics
- —
Market trends
- HPI YoY
- ▼ -131.67%
- Current HPI
- 225.0367
- Rent YoY
- ▲ 2.88%
- Metro
- Indianapolis-Carmel-Anderson, IN
- State GDP YoY
- ▲ 2.90%
- F500 in state
- 18
Industry mix (Fortune 500 HQ in IN)
| Industry | F500 HQs | Revenue |
|---|---|---|
| Industrial Machinery | 2 | $37B |
|
||
| Healthcare | 1 | $177B |
|
||
| Pharmaceuticals | 1 | $45B |
|
||
| Metals / Steel | 1 | $18B |
|
||
| Agriculture | 1 | $17B |
|
||
| Packaging | 1 | $12B |
|
||
Price history
-5.2% since first listed6 events — show timeline
- 2026-05-02 Pending — MIBOR as Distributed by MLS Grid
- 2026-04-07 Price Changed $109,900 MIBOR as Distributed by MLS Grid
- 2026-01-22 Listed $119,900 MIBOR as Distributed by MLS Grid
- 2022-09-15 Sold (MLS) $102,500 MIBOR as Distributed by MLS Grid
- 2022-08-05 Pending — MIBOR as Distributed by MLS Grid
- 2022-07-27 Listed $115,900 MIBOR as Distributed by MLS Grid
Property tax history
+8.8%/yrLatest (2025): $878 · -49.6% YoY. Source: county tax records.
Cash-flow waterfall
monthlySold comps — $/sqft
last 12 mo · ≤1 miLoading sold comps…