3460 S Ocean Blvd #209 · Palm Beach, FL
Flood risk 6/10 · Moderate
- FEMA flood zone
- X (shaded)
- Chance of flooding over 30 yrs
- 0.72%
- Est. flood insurance / yr
- $507 – $1,088
Fire risk 1/10 · Minimal
- Est. fire insurance / yr
- $947 – $1,759
Heat risk 9/10 · Severe
- Hot days now (above 104°F)
- 7 days/yr
- Hot days in 30 yrs
- 25 days/yr
Wind risk 10/10 · Severe
- Chance of severe wind over 30 yrs
- 99.0%
Air-quality risk 2/10 · Minimal
- Unhealthy air days now
- 2 days/yr
- Unhealthy air days in 30 yrs
- 2 days/yr
Risk factors via First Street. Map © Google.
Why this score? — see what drove the F grade
The composite is a weighted blend of 9 inputs, each scored 0–100. Each bar is that input's sub-score; the figure is the points it added to the 100-point composite (weight × sub-score).
- Appreciation +7.6/10.0
- ARV discount +7.5/15.0
- Schools +4.3/10.0
- Rent growth +3.5/5.0
- Livability +3.4/5.0
- Condition / age +2.5/5.0
- Cash flow +1.6/30.0
- 1% rule +1.6/10.0
- DSCR +0.0/10.0
$730,000
🖨 Deal sheet 📄 Offer letter ✓ Due diligence
Listing remarks
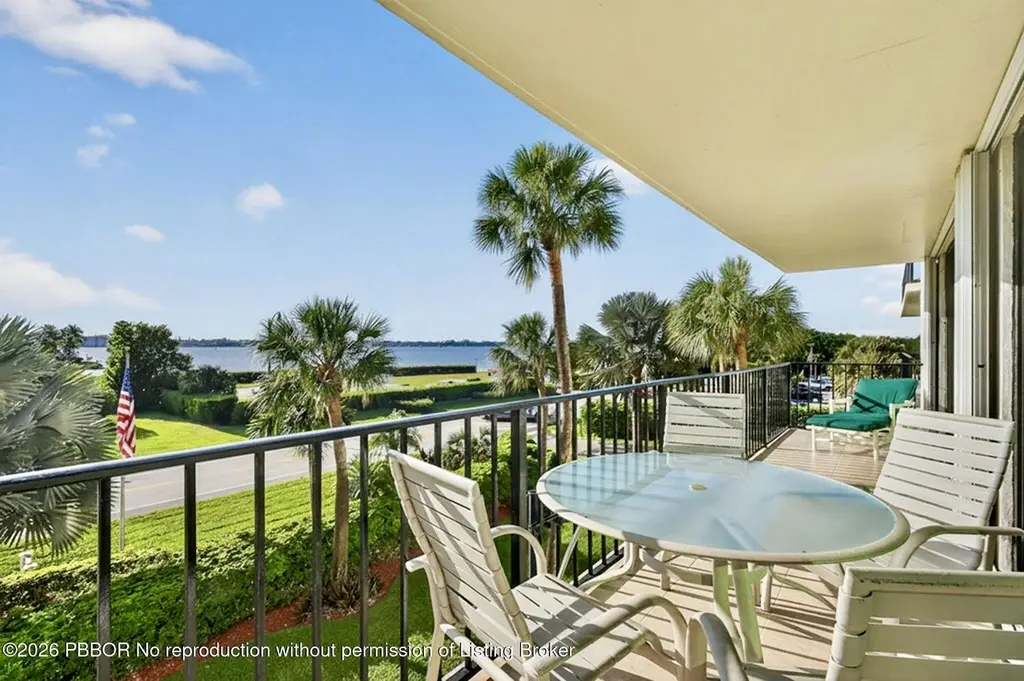
Wake up to sweeping Intracoastal views in this beautifully appointed 2-bedroom, 2 full bath condo, where comfort meets coastal elegance. This light-filled residence offers a spacious layout with an open living & dining area, perfect for relaxing or entertaining while enjoying serene water vistas from your private balcony. The primary suite features generous closet space and en-suite bath, while the second bedroom and bathroom provide ideal accommodations for guests. Every detail is designed for easy, breezy waterfront living. Residents enjoy exclusive access to a private beach and resort-style amenities including a sparkling oversized pool, fitness center, sauna, recreation room, and
Key facts
- Fitness center
- Private balcony
- Sauna
Tags
Property features AI
Finance
- HOA & community: Homeowners association; Community pool; HOA includes cable TV, pest control, and water
Exterior
- Parking: 1 parking space
- Utilities: Cable available
- Home design: Condominium; Residential property; 7-story building
- Construction: Claridges building
- Exterior features: Waterfront location; Private pool; Balcony
Interior
- Kitchen: Electric range; Dishwasher; Refrigerator; Freezer; Microwave
- Flooring: Carpet; Parquet; Tile
- Bathrooms: 2 full bathrooms
- Heating & cooling: Central air conditioning
- Interior features: Storage; Balcony
- Laundry & utility: Common area laundry
Neighborhood map
What this means for you Summary
Snapshot
- This is a 2-bed/2.0-bath condo listed at $730k.
Deal economics
- At list price, monthly cash flow is $-3k ($-34k/yr) — negative.
- To cash-flow at today's rent, offer at most $548k (25.0% below list).
- To meet the 1% rule (rent ≥ 1% of price), the offer needs to be $479k (34.4% below list).
- Recommended offer: $479k (34.4% below list) — sets the bar for 1% rule.
Location & tenants
- Location reads 68/100 on livability (#530 in FL) — a middle-class / working-renter tenant base. Strengths: schools A+, employment A+, crime A-; Watch: amenities F, commute F, cost of living F.
- Palm Beach (suburban): math 46% / reading 53% proficiency, ranked #34 of 73 in FL (top 47%) — families likely to look elsewhere, expect single-tenant / working-renter base with shorter leases.
- Market conditions: Rents rising (+3.9%/yr); 447 active listings in the ZIP; 40 comparable units currently listed for rent nearby; rentals at typical pace (median 25d on market — plan ~3-4 weeks tenant-placement turnaround); high-income renter base; 3,974 units permitted in Palm Beach County in 2024 (1,012 in 5+ unit buildings).
- This rent runs 38% of the median local income ($151k/yr) — at the standard rent-burdened threshold; future hikes will face affordability resistance.
Forward outlook
- In year one you build about $42k of equity ($5k loan paydown + $37k appreciation (5.1% local appreciation)).
- Palm Beach County population projected at +30% by 2050 — long-run rental-demand tailwind backs the buy-and-hold thesis.
- By year 2, paydown + projected appreciation supports a ~$68k cash-out refi (75% LTV) — recoverable capital for the next deal without selling this one.
Negotiation context
- It's been on market 77 days — a 6% lower offer ($686k) is reasonable based on typical stale-listing flexibility.
- 6 sale attempts since 22y ago with the ask held roughly flat each time — persistent listings suggest the price (not the market) is what's stuck; bring a comps-based counter.
- Current owner paid $415k; list at $730k implies a 76% gain — meaningful room to come down on a strong offer.
Risks & watch-outs
- Watch-outs: HOA is 32% of rent.
- Climate carrying-cost: major flood risk; severe wind risk, 99% chance of damaging wind over 30y; extreme-heat days projected 7→25/yr by 2055 (HVAC capex compounding) — expect insurance premiums to compound above CPI over the hold.
Questions for the listing agent
- What do current leases actually rent for vs. the listed asking? Can we see a recent rent roll and the last 12 months of T-12 income?
- It's been on market 77 days. Have you received any prior offers? Is the seller open to a 34% concession, seller financing, or rate buy-down credit?
- Built in 1973 — when were the roof, HVAC, electrical panel, plumbing, and water heater last replaced?
- What does the HOA fee cover, when was the last increase, and are there any pending special assessments or reserve-fund shortfalls?
- Any open or pending special assessments — roof, HVAC, plumbing, elevator, façade? What's the per-unit balance and payoff schedule, and is the seller paying it off at close or rolling it to the buyer?
- Why hasn't it sold? Are there any deal-killer items the seller is aware of (foundation, flood, title, zoning, code violations)?
- Is there a deadline driving the sale (1031 exchange, divorce, estate, relocation)? That informs how much negotiation room exists.
- Schools are A-rated — typically a magnet for longer-tenancy family renters. What's the average tenant stay here, and is there a school-zone premium baked into asking?
- The area grade is low — what's the realistic commute time and amenity access for the typical tenant pool here? Any planned neighborhood developments (good or bad) we should know about?
- What's the average days-on-market for RENTAL listings here right now (not sales)? A rising rental-DOM trend means longer vacancies and softer asking-rent achievability than the comps imply.
- What's the recent tenant-quality profile in this submarket — average credit score on applications, eviction rate, late-payment / NSF rate, and stable-employment percentage? A property-management company in the area should have these aggregated.
- How much new apartment / multifamily construction is in the pipeline within 1–3 miles? Heavy new supply (>2% of stock underway) typically softens rents 12–24 months out; light construction supports rent growth.
Investment metrics
- 1% rule
- 0.66% ✗
- Cap rate
- 1.68%
- Cash-on-cash
- -16.48%
- DSCR
- 0.27
- GRM
- 12.7
CMA / ARV
No comps found within radius.
Projected returns pro-forma
5.12% appreciation · 3.92% rent growth · sell at horizon
- IRR
- -0.0%
- Equity multiple
- 1.00×
- Total profit
- $-284
- Equity at exit
- $418,786
- IRR
- 4.0%
- Equity multiple
- 1.80×
- Total profit
- $162,724
- Equity at exit
- $727,024
Cash invested: $204,400 (down + closing). Projections, not guarantees.
Landlord ↔ Tenant lean methodology
- Overall (STATE)
- 87 Strongly Landlord-Friendly
- State Florida
- 87 Strongly Landlord-Friendly · R+3
- County
- — inherits STATE
- City
- — inherits STATE
ZIP-level market 33480
- Home prices YoY
- 1.1%
- Rents YoY
- 3.9%
- Active inventory
- 447
- Price-to-rent
- 12.7×
Monthly cashflow live
- Estimated rent
- $4,792 high interval (Pro) →
- Mortgage (P&I)
- −$3,828
- Tax est. 1.5%
- −$912 /mo · $10,950/yr
- Insurance
- −$304
- HOA est. from 7 same-building comps
- −$1,549
- Vacancy / Maint / Mgmt
- −$1,006
- Net cashflow
- $-2,808
Break-even live
UW: 25.0% down · 7.5% · 30yr · 1.5% tax · 5.0% vac · 8.0% maint · 8.0% mgmt
Financing live
Cash to close
- Down payment
- $182,500
- Closing costs
- $21,900
- Reserves months
- —
- Total cash needed
- —
Loan-product check · same deal, 3 products live
Conventional
25% down · 7.5% · 30yr
- Down + closing
- —
- Monthly P&I
- —
- Monthly cashflow
- —
- DSCR
- —
- Eligible?
- —
Personal DTI + credit; lowest rate.
DSCR
20% down · 8.5% · 30yr
- Down + closing
- —
- Monthly P&I
- —
- Monthly cashflow
- —
- DSCR
- —
- Eligible?
- —
No personal income docs; deal must DSCR.
Hard money
10% down · 12.0% · 12mo
- Down + closing
- —
- Monthly P&I
- —
- Monthly cashflow
- —
- DSCR
- —
- Eligible?
- —
Short-term bridge; refi at stabilization.
Rent comps 40 comps
| Address | Beds | Baths | Sqft | Rent | $/sqft | DOM | Units | Dist |
|---|---|---|---|---|---|---|---|---|
| 3460 S Ocean Blvd #4150 Palm Beach, FL | 2.0 | 2.0 | 1436 | $10,500 | $7.31 | 24d | 1 | 0.02mi |
| 3450 S Ocean Blvd Palm Beach, FL | 1.0–2.0 | 1.0–2.0 | 1236 | $9,500 | $7.69 | 8d | 9 | 0.04mi |
| 3450 S Ocean Blvd Palm Beach, FL | 1.0–2.0 | 1.0–2.0 | 1236 | $9,500 | $7.69 | 3d | 10 | 0.04mi |
| 3456 S Ocean Blvd #6050 Palm Beach, FL | 2.0 | 2.0 | 1482 | $4,650 | $3.14 | 24d | 1 | 0.04mi |
| 3450 S Ocean Blvd #3280 Palm Beach, FL | 1.0 | 1.0 | 952 | $2,500 | $2.63 | 24d | 1 | 0.04mi |
| 3450 S Ocean Blvd #1050 Palm Beach, FL | 1.0 | 1.0 | 952 | $2,950 | $3.10 | 24d | 1 | 0.04mi |
| 3450 S Ocean Blvd #4270 Palm Beach, FL | 1.0 | 1.0 | 924 | $3,250 | $3.52 | 24d | 1 | 0.04mi |
| 3450 S Ocean Blvd #8120 Palm Beach, FL | 1.0 | 1.5 | 1008 | $3,500 | $3.47 | 24d | 1 | 0.04mi |
| 3456 S Ocean Blvd Apt 705 Palm Beach, FL | 2.0 | 2.0 | 1457 | $3,500 | $2.40 | 24d | 1 | 0.04mi |
| 3456 S Ocean Blvd #105 Palm Beach, FL | 2.0 | 2.0 | 1482 | $12,000 | $8.10 | 24d | 1 | 0.04mi |
| 3475 S Ocean Blvd Palm Beach, FL | 2.0 | 2.0 | 1395 | $5,850 | $4.19 | 24d | 3 | 0.07mi |
| 3440 S Ocean Blvd Unit 307N Palm Beach, FL | 2.0 | 2.0 | 1457 | $8,500 | $5.83 | 24d | 1 | 0.09mi |
| 3475 S Ocean Blvd #6110 Palm Beach, FL | 1.0 | 1.5 | 891 | $3,500 | $3.93 | 24d | 1 | 0.09mi |
| 3475 S Ocean Blvd #3110 Palm Beach, FL | 1.0 | 1.5 | 891 | $2,600 | $2.92 | 24d | 1 | 0.09mi |
| 3475 S Ocean Blvd #3020 Palm Beach, FL | 2.0 | 2.0 | 1395 | $5,000 | $3.58 | 24d | 1 | 0.09mi |
| 3475 S Ocean Blvd #6150 Palm Beach, FL | 2.0 | 2.0 | 1395 | $8,750 | $6.27 | 24d | 1 | 0.09mi |
| 3475 S Ocean Blvd #1030 Palm Beach, FL | 1.0 | 2.0 | 1395 | $5,500 | $3.94 | 3d | 1 | 0.09mi |
| 3500 S Ocean Blvd Palm Beach, FL | 1.0 | 1.0 | 580 | $1,950 | $3.36 | 1d | 3 | 0.12mi |
| 3520 S Ocean Blvd Unit H404 Palm Beach, FL | 2.0 | 2.0 | 1176 | $5,900 | $5.02 | 24d | 1 | 0.18mi |
| 3540 S Ocean Blvd Palm Beach, FL | 1.0 | 2.0 | 983 | $4,000 | $4.07 | 24d | 1 | 0.22mi |
| 3540 S Ocean Blvd #208 Palm Beach, FL | 2.0 | 2.0 | 983 | $2,750 | $2.80 | 4d | 1 | 0.22mi |
| 3540 S Ocean Blvd #612 Palm Beach, FL | 2.0 | 2.0 | 983 | $4,700 | $4.78 | 8d | 1 | 0.22mi |
| 3540 S Ocean Blvd #216 Palm Beach, FL | 2.0 | 2.0 | 983 | $2,550 | $2.59 | 22d | 1 | 0.22mi |
| 3540 S Ocean Blvd #309 Palm Beach, FL | 1.0 | 1.5 | 785 | $2,300 | $2.93 | 5d | 1 | 0.22mi |
| 3540 S Ocean Blvd #608 Palm Beach, FL | 2.0 | 2.0 | 983 | $2,950 | $3.00 | 24d | 1 | 0.22mi |
| 3540 S Ocean Blvd #310 Palm Beach, FL | 1.0 | 1.5 | 785 | $2,100 | $2.68 | 8d | 1 | 0.22mi |
| 3540 S Ocean Blvd #309 Palm Beach, FL | 1.0 | 1.5 | 785 | $2,400 | $3.06 | 5d | 1 | 0.22mi |
| 3560 S Ocean Blvd #706 Palm Beach, FL | 2.0 | 2.0 | 1340 | $12,000 | $8.96 | 21d | 1 | 0.33mi |
| 3560 S Ocean Blvd #502 Palm Beach, FL | 2.0 | 2.0 | 1340 | $9,500 | $7.09 | 24d | 1 | 0.33mi |
| 3560 S Ocean Blvd #907 Palm Beach, FL | 2.0 | 2.0 | 1340 | $7,800 | $5.82 | 11d | 1 | 0.33mi |
| 3560 S Ocean Blvd #907 Palm Beach, FL | 2.0 | 2.0 | 1340 | $7,500 | $5.60 | 11d | 1 | 0.33mi |
| 3560 S Ocean Blvd #306 Palm Beach, FL | 2.0 | 2.0 | 1380 | $7,000 | $5.07 | 19d | 1 | 0.33mi |
| 3560 S Ocean Blvd #4 Palm Beach, FL | 2.0 | 2.0 | 1340 | $7,950 | $5.93 | 24d | 1 | 0.33mi |
| 3580 S Ocean Blvd Unit 6B Palm Beach, FL | 1.0 | 1.5 | 1013 | $2,500 | $2.47 | 15d | 1 | 0.41mi |
| 3581 S Ocean Blvd Unit 9A Palm Beach, FL | 2.0 | 2.0 | 1192 | $2,600 | $2.18 | 17d | 1 | 0.42mi |
| 3581 S Ocean Blvd Unit 2B Palm Beach, FL | 1.0 | 1.5 | 940 | $2,900 | $3.09 | 17d | 1 | 0.42mi |
| 3601 S Ocean Blvd Palm Beach, FL | 2.0 | 2.5 | 1408 | $2,900 | $2.06 | 20d | 2 | 0.49mi |
| 3601 S Ocean Blvd #308 Palm Beach, FL | 2.0 | 2.5 | 1408 | $3,250 | $2.31 | 19d | 1 | 0.50mi |
| 3610 S Ocean Blvd Palm Beach, FL | 1.0–3.0 | 1.5–2.0 | 1490 | $8,348 | $5.60 | 24d | 4 | 0.54mi |
| 3605 S Ocean Blvd Palm Beach, FL | 2.0 | 2.0 | 1162 | $3,350 | $2.88 | 24d | 2 | 0.54mi |
HOA detail condo
- Monthly dues
- $0 · $0/yr
- Likely covers
- waterpoolgym
- Assessments
- None detected in remarks — confirm with the listing agent.
Listing history 25 events
-
2026-06-18days on market $730,000 Active 77 DOM
-
2026-06-17days on market $730,000 Active 76 DOM
-
2026-06-16days on market $730,000 Active 75 DOM
-
2026-06-15days on market $730,000 Active 74 DOM
-
2026-06-13days on market $730,000 Active 72 DOM
-
2026-06-09days on market $730,000 Active 68 DOM
-
2026-06-08days on market $730,000 Active 67 DOM
-
2026-06-07days on market $730,000 Active 66 DOM
-
2026-06-04days on market $730,000 Active 63 DOM
-
2026-06-03days on market $730,000 Active 62 DOM
-
2026-06-02days on market $730,000 Active 61 DOM
-
2026-06-01days on market $730,000 Active 60 DOM
-
2026-05-31days on market $730,000 Active 59 DOM
-
2026-03-31$730,000 Active
-
2021-03-05historical
-
2020-09-04$379,000 Active
-
2014-10-16historical
-
2013-09-22historical
-
2008-01-21historical
-
2007-10-15$425,000
-
2006-06-20$489,000
-
2005-11-11soldstatus $415,000
-
2005-10-18historical
-
2005-09-03$439,000
-
2004-09-07$415,000
ⓘ Source: listings_history table (triggers on properties + properties_extension) + one-shot
backfill from property_details.listing_events for pre-trigger history.
Climate risk First Street
- Flood 6/10 Major FEMA zone X (shaded) · 72% chance over 30 yrs
- Wildfire 1/10 Low
- Heat 9/10 Extreme 7 d/yr ≥104°F today · 25 d/yr by 30 yrs out
- Wind 10/10 Extreme 99% chance of damaging wind over 30 yrs
- Air quality 2/10 Low 2 unhealthy d/yr today · 2 by 30 yrs out
Nearby sold comps map
Loading sold comps map…
Walkable amenities ~0.75 mi
Loading nearby amenities…
Taxation est. · year 1
- Rental income
- $57,508
- − Mortgage interest
- −$40,891
- − Property taxes
- −$10,950
- − Insurance
- −$3,650
- − Repairs & maintenance
- −$4,601
- − Management
- −$4,601
- − HOA
- −$18,588
- − Depreciation
- −$21,236
- Taxable loss
- −$47,009
- Est. tax savings @ 24.0%
- +$11,282
- After-tax cash flow
- $-22,413/yr
For passive investors: Depreciation is non-cash, so a rental often shows a tax loss while cash-flowing — sheltering income. Rental losses are passive: they offset passive income freely, and up to $25,000/yr can offset ordinary (W-2) income if you actively participate and your MAGI is under $100k (phasing out to $0 by $150k); unused losses carry forward. On sale, claimed depreciation is recaptured at up to 25%, and gains may owe capital-gains tax (a 1031 exchange can defer both). Figures are a year-1 estimate at your 24.0% rate — not tax advice; consult a CPA.
Schools (NCES district)
- District
- Palm Beach
- NCES district ID
- 1201500
- Math proficiency
- 46% ▼ -16.00%
- Reading proficiency
- 53% ▼ -4.00%
- Median HH income
- $53,943
- Composite
- 42.72/100
- National rank
- #3160
- State rank
- #34 of 73 in FL
Livability — Palm Beach
- Score
- 68/100
- State rank
- #530
- US rank
- #9896
Category grades
Schools grade is shown separately in the Schools card above.
Census & demographics
- Census place
- Palm Beach, FL
- County
- Palm Beach County · 1,438,312 people
- City population
- 10,924
- Metro
- Miami-Fort Lauderdale-Pompano Beach, FL
- Population (ZIP)
- 10,924
- Household income
- $150,633
- Rent vs Own
- Severe rent burden
- 213.0
Population outlook (Palm Beach County) Hauer SSP2
- Today (2025)
- 1,637,487 people
- By 2030
- 1,743,255 · +6.5%
- By 2040
- 1,948,712 · +19.0%
- By 2050
- 2,132,979 · +30.3%
- By 2075
- 2,530,027 · +54.5%
- By 2100
- 2,706,979 · +65.3%
Race, ethnicity, and origin ACS 2023
- Neighborhood character
- Predominantly White (89%)
- Race & ethnicity
- White 89% Hispanic / Latino 7% Two or more races 6% Asian 1%
- Hispanic origin (detail)
- Mexican 1% Puerto Rican 1% Cuban 1%
- Common ancestry
- Scotch-Irish 7% Romanian 5% Italian 3%
- Foreign-born
- 20% · Canada, Dominican Republic, China
- Languages at home
- 84% English-only · Spanish 7% Other Indo-European 3% Russian/Polish/Slavic 2%
Political lean MEDSL · Palm Beach
- 2024 margin
- Toss-up / Even · D 50.0% · R 49.2%
- 2008→2024 swing
- -22.1pp toward R · 2008: 22.9pp · 2024: 0.8pp
- All cycles
- 2024: D+0.8 2020: D+12.8 2016: D+15.3 2012: D+17.0 2008: D+22.9
Not yet ingested
- Civics
- —
Market trends
- HPI YoY
- ▲ 5.12%
- Current HPI
- 464.2769
- Rent YoY
- ▲ 3.92%
- Metro
- Miami-Fort Lauderdale-Pompano Beach, FL
- State GDP YoY
- ▲ 3.28%
- F500 in state
- 36
Industry mix (Fortune 500 HQ in FL)
| Industry | F500 HQs | Revenue |
|---|---|---|
| Industrial Technology | 2 | $29B |
|
||
| Insurance | 2 | $17B |
|
||
| Retail | 1 | $60B |
|
||
| Technology Distribution | 1 | $58B |
|
||
| Homebuilding | 1 | $35B |
|
||
| Technology Manufacturing | 1 | $35B |
|
||
Price history
+75.9% since first listed12 events — show timeline
- 2026-03-31 Listed $730,000 PBBOR
- 2021-03-05 Listing Removed — Beaches MLS
- 2020-09-04 Listed $379,000 Beaches MLS
- 2014-10-16 Listing Removed — Beaches MLS
- 2013-09-22 Listing Removed — Beaches MLS
- 2008-01-21 Listing Removed — Beaches MLS
- 2007-10-15 Listed $425,000 Beaches MLS
- 2006-06-20 Listed $489,000 Beaches MLS
- 2005-11-11 Sold (MLS) $415,000 Beaches MLS
- 2005-10-18 Listing Removed — Beaches MLS
- 2005-09-03 Listed $439,000 Beaches MLS
- 2004-09-07 Listed $415,000 Beaches MLS
Cash-flow waterfall
monthlySold comps — $/sqft
last 12 mo · ≤1 miLoading sold comps…