 🏗️ New Construction
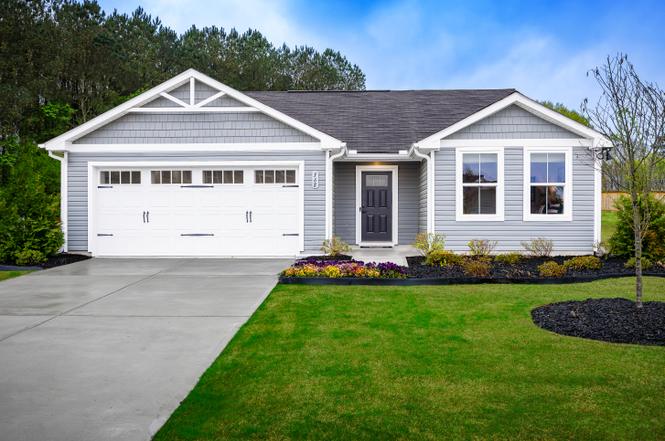
Spruce Plan · Santee, SC
Flood risk No data
- FEMA flood zone
- —
- Chance of flooding over 30 yrs
- —
- Est. flood insurance / yr
- —
Fire risk No data
- Est. fire insurance / yr
- —
Heat risk No data
- Hot days now (above threshold)
- —
- Hot days in 30 yrs
- —
Wind risk No data
- Chance of severe wind over 30 yrs
- —
Air-quality risk No data
- Unhealthy air days now
- —
- Unhealthy air days in 30 yrs
- —
Risk factors via First Street. Map © Google.
Why this score? — see what drove the B- grade
The composite is a weighted blend of 9 inputs, each scored 0–100. Each bar is that input's sub-score; the figure is the points it added to the 100-point composite (weight × sub-score).
- Cash flow +25.6/30.0
- DSCR +8.5/10.0
- ARV discount +7.5/15.0
- 1% rule +6.8/10.0
- Appreciation +6.7/10.0
- Schools +5.0/10.0
- Livability +3.1/5.0
- Rent growth +2.5/5.0
- Condition / age +2.5/5.0
$243,990
🖨 Deal sheet 📄 Offer letter ✓ Due diligence
Listing remarks
Welcome to Somerset! A new home community where you can feel confident in owning a new home with simple living and space to relax in Santee. The Spruce exemplifies the convenience of main-level living. From the foyer, a hall leads to a full bath and 2 spacious bedrooms. The heart of the home is the living area with its light-filled open-concept design. The gourmet kitchen features a large island with room for seating and a cozy eating. The attached 2-car garage offers everyday ease, with plenty of space for parking and storage. Tucked away in a small recessed space, the luxury owner's suite features a private bath and a walk-in closet. Receive up to $7,500 in closing cost assistance with us
Key facts
- Private bath
- Gourmet kitchen
- Large island
Tags
Property features AI
Finance
- Financial info: List price $253,990
Exterior
- Parking: 2 parking spaces
- Utilities: Central air
- Home design: New construction plan named Spruce; Address: Santee, SC
Interior
- Bedrooms: 3 bedrooms
- Bathrooms: 2 full bathrooms
- Heating & cooling: Central air conditioning
- Interior features: Central air conditioning
Neighborhood map
What this means for you Summary
Snapshot
- This is a 3-bed/2.0-bath single-family listed at $244k.
Deal economics
- At list price, monthly cash flow is $475 ($6k/yr) — positive.
- The deal already cash-flows at list — no discount required.
- To meet the 1% rule (rent ≥ 1% of price), the offer needs to be $235k (3.8% below list).
- Recommended offer: $215k (12.0% below list) — sets the bar for market timing.
- Cap rate 9.1% vs local median 5.4% in Santee — top-decile yield for the area; either an underpriced asset or a hidden risk that comps aren't pricing in. Stress-test before assuming the spread holds.
Location & tenants
- Location reads 61/100 on livability (#202 in SC) — a middle-class / working-renter tenant base. Strengths: cost of living A+, health & safety A+; Watch: schools D+, crime F, amenities F.
- Market conditions: 154 active listings in the ZIP; 3 comparable units currently listed for rent nearby; rentals at typical pace (median 24d on market — plan ~3-4 weeks tenant-placement turnaround); 87 units permitted in Orangeburg County in 2024 (0 in 5+ unit buildings).
Forward outlook
- In year one you build about $8k of equity ($1k loan paydown + $7k appreciation (3.5% local appreciation)).
- Orangeburg County population projected at -27% by 2050 — secular population decline; favor cash flow + early exit over multi-decade hold.
- At projected returns (3.5% appreciation + 3.0% rent growth), your $56k cash investment doubles in ~4 years — after that, you're playing with house money.
- By year 5, paydown + projected appreciation supports a ~$36k cash-out refi (75% LTV) — recoverable capital for the next deal without selling this one.
Negotiation context
- It's been on market 162 days — a 12% lower offer ($215k) is reasonable based on typical stale-listing flexibility.
Questions for the listing agent
- It's been on market 162 days. Have you received any prior offers? Is the seller open to a 12% concession, seller financing, or rate buy-down credit?
- Why hasn't it sold? Are there any deal-killer items the seller is aware of (foundation, flood, title, zoning, code violations)?
- Is there a deadline driving the sale (1031 exchange, divorce, estate, relocation)? That informs how much negotiation room exists.
- Schools are D-rated, which usually means shorter tenancies and higher turnover. Who's the typical renter profile here, and what's been the actual vacancy rate?
- Crime grade is F in this area — have there been break-ins, vandalism, or insurance claims at this property in the last 3 years? What carrier currently insures it and at what premium?
- What's the average days-on-market for RENTAL listings here right now (not sales)? A rising rental-DOM trend means longer vacancies and softer asking-rent achievability than the comps imply.
- What's the recent tenant-quality profile in this submarket — average credit score on applications, eviction rate, late-payment / NSF rate, and stable-employment percentage? A property-management company in the area should have these aggregated.
- How much new for-sale + rental construction is in the pipeline within 1–3 miles? Heavy new supply typically softens prices + rents 12–24 months out; constrained supply supports both.
Investment metrics
- 1% rule
- 1.18% ✓
- Cap rate
- 9.15%
- Cash-on-cash
- 10.20%
- DSCR
- 1.45
- GRM
- 7.1
CMA / ARV
- ARV (on-the-fly)
- $199,584
- Comps found
- 7
Show comp detail 7 sales within ~0.75 mi
| Address | Dist | Beds/Ba | Sqft | Sold | Price | $/sf | Match |
|---|---|---|---|---|---|---|---|
| 9148 Ace Dr | 0.05mi | 3/2.5 | 1,307 (+1%) | 11mo | $254,990 | $195 | 86 |
| 632 Mulligan Way | 0.11mi | 3/2.0 | 1,307 (+1%) | 11mo | $254,990 | $195 | 84 |
| 188 Fargo Dr | 0.32mi | 3/2.0 | 1,348 (+4%) | 13mo | $313,990 | $233 | 67 |
| 27 Andre Michaux Rd | 0.67mi | 2/2.0 (-1) | 1,320 (+2%) | 18mo | $150,000 | $114 | 46 |
| 13 Thomas Walter Cir | 0.71mi | 2/2.0 (-1) | 1,332 (+3%) | 20mo | $205,000 | $154 | 41 |
| 5 John Fothergill Cir | 0.72mi | 2/2.0 (-1) | 1,405 (+8%) | 10mo | $214,500 | $153 | 39 |
| 7L Thomas Walters Cir | 0.69mi | 2/2.0 (-1) | 1,400 (+8%) | 23mo | $160,000 | $114 | 30 |
Match score weights: distance 35% · size 25% · config 20% · recency 20%. Top-matched comps best support the ARV.
Projected returns pro-forma
3.47% appreciation · 3.0% rent growth · sell at horizon
- IRR
- 18.2%
- Equity multiple
- 2.06×
- Total profit
- $59,378
- Equity at exit
- $95,110
- IRR
- 19.2%
- Equity multiple
- 3.92×
- Total profit
- $162,932
- Equity at exit
- $150,894
Cash invested: $55,884 (down + closing). Projections, not guarantees.
Landlord ↔ Tenant lean methodology
- Overall (STATE)
- 90 Strongly Landlord-Friendly
- State South Carolina
- 90 Strongly Landlord-Friendly · R+6
- County
- — inherits STATE
- City
- — inherits STATE
ZIP-level market 29142
- Home prices YoY
- 1.8%
- Active inventory
- 154
- Price-to-rent
- 8.7×
Monthly cashflow live
- Estimated rent
- $2,347 medium interval (Pro) →
- Mortgage (P&I)
- −$1,047
- Tax est. 1.5%
- −$249 /mo · $2,994/yr
- Insurance
- −$83
- HOA
- −$0
- Vacancy / Maint / Mgmt
- −$493
- Net cashflow
- $475
Break-even live
UW: 25.0% down · 7.5% · 30yr · 1.5% tax · 5.0% vac · 8.0% maint · 8.0% mgmt
Financing live
Cash to close
- Down payment
- $49,896
- Closing costs
- $5,988
- Reserves months
- —
- Total cash needed
- —
Loan-product check · same deal, 3 products live
Conventional
25% down · 7.5% · 30yr
- Down + closing
- —
- Monthly P&I
- —
- Monthly cashflow
- —
- DSCR
- —
- Eligible?
- —
Personal DTI + credit; lowest rate.
DSCR
20% down · 8.5% · 30yr
- Down + closing
- —
- Monthly P&I
- —
- Monthly cashflow
- —
- DSCR
- —
- Eligible?
- —
No personal income docs; deal must DSCR.
Hard money
10% down · 12.0% · 12mo
- Down + closing
- —
- Monthly P&I
- —
- Monthly cashflow
- —
- DSCR
- —
- Eligible?
- —
Short-term bridge; refi at stabilization.
Rent comps 3 comps
| Address | Beds | Baths | Sqft | Rent | $/sqft | DOM | Units | Dist |
|---|---|---|---|---|---|---|---|---|
| 764 Striped Bass Ct Santee, SC | 3.0 | 2.0 | 1183 | $2,000 | $1.69 | 23d | 1 | 1.03mi |
| 208 Trillium Ct Santee, SC | 3.0 | 3.0 | 1500 | $2,100 | $1.40 | 23d | 1 | 1.31mi |
| 127 Ballard Ln Santee, SC | 2.0 | 2.0 | 1300 | $2,999 | $2.31 | 23d | 1 | 1.39mi |
Listing history 16 events
-
2026-06-19days on market $243,990 Active 162 DOM
-
2026-06-18days on market $243,990 Active 161 DOM
-
2026-06-17days on market $243,990 Active 160 DOM
-
2026-06-16days on market $243,990 Active 159 DOM
-
2026-06-15days on market $243,990 Active 158 DOM
-
2026-06-14days on market $243,990 Active 156 DOM
-
2026-06-12days on market $243,990 Active 155 DOM
-
2026-06-09days on market $243,990 Active 152 DOM
-
2026-06-08days on market $243,990 Active 151 DOM
-
2026-06-07days on market $243,990 Active 150 DOM
-
2026-06-07days on market $243,990 Active 149 DOM
-
2026-06-04days on market $243,990 Active 146 DOM
-
2026-06-02pricedays on market $243,990 Active 145 DOM
-
2026-06-01days on market $253,990 Active 144 DOM
-
2026-05-31days on market $253,990 Active 143 DOM
-
2026-05-31days on market $253,990 Active 142 DOM
ⓘ Source: listings_history table (triggers on properties + properties_extension) + one-shot
backfill from property_details.listing_events for pre-trigger history.
Nearby sold comps map
Loading sold comps map…
Walkable amenities ~0.75 mi
Loading nearby amenities…
Taxation est. · year 1
- Rental income
- $28,166
- − Mortgage interest
- −$11,180
- − Property taxes
- −$2,994
- − Insurance
- −$998
- − Repairs & maintenance
- −$2,253
- − Management
- −$2,253
- − Depreciation
- −$5,806
- Taxable income
- $2,682
- Est. tax owed @ 24.0%
- −$644
- After-tax cash flow
- $5,056/yr
For passive investors: Depreciation is non-cash, so a rental often shows a tax loss while cash-flowing — sheltering income. Rental losses are passive: they offset passive income freely, and up to $25,000/yr can offset ordinary (W-2) income if you actively participate and your MAGI is under $100k (phasing out to $0 by $150k); unused losses carry forward. On sale, claimed depreciation is recaptured at up to 25%, and gains may owe capital-gains tax (a 1031 exchange can defer both). Figures are a year-1 estimate at your 24.0% rate — not tax advice; consult a CPA.
Schools (NCES district)
No district data.
Livability — Santee
- Score
- 61/100
- State rank
- #202
- US rank
- #17354
Category grades
Schools grade is shown separately in the Schools card above.
Census & demographics
- Census place
- Santee, SC
- Population (ZIP)
- 4,658
Population outlook (Orangeburg County) Hauer SSP2
- Today (2025)
- 82,698 people
- By 2030
- 78,615 · -4.9%
- By 2040
- 69,308 · -16.2%
- By 2050
- 60,629 · -26.7%
- By 2075
- 42,678 · -48.4%
- By 2100
- 28,136 · -66.0%
Race, ethnicity, and origin ACS 2023
- Neighborhood character
- Majority Black (64%)
- Race & ethnicity
- Black 64% White 31% Asian 3% Hispanic / Latino 2%
- Common ancestry
- Lithuanian 2% Romanian 2%
- Foreign-born
- 1%
- Languages at home
- 96% English-only · Other Indo-European 2% Spanish 1%
Political lean MEDSL · Orangeburg
- 2024 margin
- Strong D (+24.6) · D 61.8% · R 37.2% · Other 1.1%
- 2008→2024 swing
- -13.5pp toward R · 2008: 38.1pp · 2024: 24.6pp
- All cycles
- 2024: D+24.6 2020: D+33.2 2016: D+37.0 2012: D+43.5 2008: D+38.1
Not yet ingested
- Civics
- —
Market trends
- HPI YoY
- ▲ 3.47%
- Current HPI
- 193.5623
- Rent YoY
- —
- Metro
- —
- State GDP YoY
- ▲ 4.51%
- F500 in state
- 2
Industry mix (Fortune 500 HQ in SC)
| Industry | F500 HQs | Revenue |
|---|---|---|
| Packaging | 1 | $7B |
|
||
Cash-flow waterfall
monthlySold comps — $/sqft
last 12 mo · ≤1 miLoading sold comps…