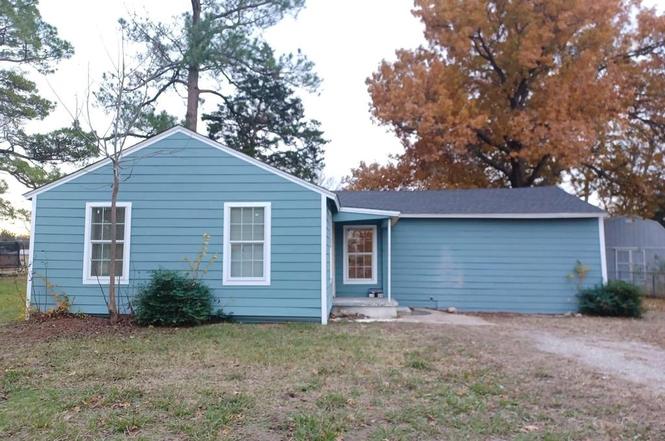
1309 S 5th St · Bonham, TX
Flood risk 1/10 · Minimal
- FEMA flood zone
- X (unshaded)
- Chance of flooding over 30 yrs
- 0.0%
- Est. flood insurance / yr
- $507 – $1,088
Fire risk 7/10 · Major
- Est. fire insurance / yr
- $1,222 – $2,270
Heat risk 7/10 · Major
- Hot days now (above 111°F)
- 7 days/yr
- Hot days in 30 yrs
- 22 days/yr
Wind risk 5/10 · Moderate
- Chance of severe wind over 30 yrs
- 26.0%
Air-quality risk 2/10 · Minimal
- Unhealthy air days now
- 1 days/yr
- Unhealthy air days in 30 yrs
- 1 days/yr
Risk factors via First Street. Map © Google.
Why this score? — see what drove the D grade
The composite is a weighted blend of 9 inputs, each scored 0–100. Each bar is that input's sub-score; the figure is the points it added to the 100-point composite (weight × sub-score).
- Cash flow +20.6/30.0
- DSCR +6.6/10.0
- 1% rule +6.1/10.0
- Schools +3.2/10.0
- Livability +3.2/5.0
- Rent growth +2.5/5.0
- Condition / age +2.5/5.0
- ARV discount +0.0/15.0
- Appreciation +0.0/10.0
$130,000
🖨 Deal sheet (PDF) 📄 Offer letter ✓ Due diligence
Listing remarks
This cozy, newly renovated 3-bedroom home is move-in ready with fresh updates throughout, including new flooring, modern fixtures, and a bright, welcoming layout. Enjoy an updated kitchen and bathroom, comfortable bedrooms, and a spacious yard with the freedom of no HOA. A storm cellar adds extra safety and storage. Seller had it appraised and that came back at 180K. Home is priced below market value for quick sale!
Key facts
- Spacious yard
- Updated kitchen
- No hoa
Tags
Property features AI
Finance
- Financial info: No second mortgage indicated; Listed for sale
- HOA & community: No homeowners association
Exterior
- Parking: Driveway parking; Additional off-street parking
- Utilities: City water; City sewer; Co-op electric; Not in a municipal utility district
- Home design: Single-family residence; Residential property; Attached property; One story
- Construction: Built in 1960
- Exterior features: Additional parking; Driveway
Interior
- Kitchen: Dishwasher; Convection oven
- Bedrooms: 3 bedrooms on the main level
- Bathrooms: 1 full bathroom
- Interior features: Open floorplan; One living area; One dining area; Total of 5 rooms
- Laundry & utility: Tankless water heater; Other utility features
Neighborhood map
What this means for you Summary
Snapshot
- This is a 3-bed/1.0-bath single-family listed at $130k.
Deal economics
- At list price, monthly cash flow is $174 ($2k/yr) — positive.
- The deal already cash-flows at list — no discount required.
- Meets the 1% rule at list price ($1k rent vs $130k).
- Cap rate 7.9% vs local median 3.2% in Bonham — top-decile yield for the area; either an underpriced asset or a hidden risk that comps aren't pricing in. Stress-test before assuming the spread holds.
Location & tenants
- Location reads 64/100 on livability (#785 in TX) — a middle-class / working-renter tenant base. Strengths: crime A+, cost of living A+, housing A+; Watch: employment D, amenities F, commute F.
- Bonham ISD (town): math 37% / reading 38% proficiency, ranked #477 of 826 in TX (top 58%) — families likely to look elsewhere, expect single-tenant / working-renter base with shorter leases.
- Zoned schools: Finley-Oates El (math 17% / reading 32%, grade F, #3,052 of 4,322 statewide, top 74%, 533 students, 73% FRL); Evans El (math 41% / reading 33%, grade F, #756 of 1,662 statewide, top 47%, 374 students, 69% FRL); Bonham H S (math 37% / reading 32%, grade F, #963 of 1,632 statewide, top 61%, 548 students, 59% FRL).
- Market conditions: 278 active listings in the ZIP; 11 comparable units currently listed for rent nearby; rentals lingering (median 46d on market — plan ~5-8 weeks vacancy on turnover, expect pricing pressure); 91% of comp listings sitting > 30 days — soft ceiling on asking rent; 82 units permitted in Fannin County in 2024 (0 in 5+ unit buildings).
Forward outlook
- Local home prices are declining (-3.0%/yr); year-one equity from $899 of loan paydown is wiped out by about $4k of value loss. Plan a longer hold.
- Fannin County population projected to shrink 6% by 2050 — rents likely to lag national; underwrite the cash flow, not the appreciation.
Negotiation context
- Only 4 days on market — expect competitive offers; lowballing is unlikely to land.
- 6 sale attempts since 19y ago with the ask held roughly flat each time — persistent listings suggest the price (not the market) is what's stuck; bring a comps-based counter.
Risks & watch-outs
- Climate carrying-cost: moderate wind risk, 26% chance of damaging wind over 30y; major wildfire risk; extreme-heat days projected 7→22/yr by 2055 (HVAC capex compounding) — expect insurance premiums to compound above CPI over the hold.
Questions for the listing agent
- Built in 1960 — when were the roof, HVAC, electrical panel, plumbing, and water heater last replaced?
- Is there a deadline driving the sale (1031 exchange, divorce, estate, relocation)? That informs how much negotiation room exists.
- Schools are D-rated, which usually means shorter tenancies and higher turnover. Who's the typical renter profile here, and what's been the actual vacancy rate?
- The area grade is low — what's the realistic commute time and amenity access for the typical tenant pool here? Any planned neighborhood developments (good or bad) we should know about?
- What's the average days-on-market for RENTAL listings here right now (not sales)? A rising rental-DOM trend means longer vacancies and softer asking-rent achievability than the comps imply.
- What's the recent tenant-quality profile in this submarket — average credit score on applications, eviction rate, late-payment / NSF rate, and stable-employment percentage? A property-management company in the area should have these aggregated.
- How much new for-sale + rental construction is in the pipeline within 1–3 miles? Heavy new supply typically softens prices + rents 12–24 months out; constrained supply supports both.
Investment metrics
- 1% rule
- 1.11% ✓
- Cap rate
- 7.90%
- Cash-on-cash
- 5.74%
- DSCR
- 1.26
- GRM
- 7.5
CMA / ARV
- ARV (on-the-fly)
- $103,100
- Comps found
- 3
Show comp detail 3 sales within ~0.75 mi
| Address | Dist | Beds/Ba | Sqft | Sold | Price | $/sf | Match |
|---|---|---|---|---|---|---|---|
| 1304 S 5th St | 0.04mi | 3/2.0 | 1,120 (+9%) | 6mo | $97,000 | $87 | 75 |
| 608 Oldham St | 0.22mi | 2/1.0 (-1) | 896 (-13%) | 14mo | $89,999 | $100 | 51 |
| 512 Beech St | 0.67mi | 2/1.0 (-1) | 883 (-14%) | 16mo | $120,000 | $136 | 27 |
Match score weights: distance 35% · size 25% · config 20% · recency 20%. Top-matched comps best support the ARV.
Projected returns pro-forma
-3.0% appreciation · 3.0% rent growth · sell at horizon
- IRR
- -7.4%
- Equity multiple
- 0.73×
- Total profit
- $-9,920
- Equity at exit
- $19,383
- IRR
- 2.3%
- Equity multiple
- 1.16×
- Total profit
- $5,883
- Equity at exit
- $11,240
Cash invested: $36,400 (down + closing). Projections, not guarantees.
Landlord ↔ Tenant lean methodology
- Overall (STATE)
- 87 Strongly Landlord-Friendly
- State Texas
- 87 Strongly Landlord-Friendly · R+5
- County
- — inherits STATE
- City
- — inherits STATE
ZIP-level market 75418
- Home prices YoY
- -8.9%
- Active inventory
- 278
- Price-to-rent
- 7.5×
Monthly cashflow live
- Estimated rent
- $1,438 high interval (Pro) →
- Mortgage (P&I)
- −$682
- Tax from tax record
- −$226 /mo · $2,717/yr
- Insurance
- −$54
- HOA
- −$0
- Vacancy / Maint / Mgmt
- −$302
- Net cashflow
- $174
Break-even live
Sensitivity live
| Price | -10% $248 | -5% $211 | +0% $174 | +5% $137 | +10% $100 |
|---|---|---|---|---|---|
| Rent | -10% $60 | -5% $117 | +0% $174 | +5% $231 | +10% $288 |
| Rate | -1.0pp $240 | -0.5pp $207 | base $174 | +0.5pp $140 | +1.0pp $106 |
UW: 25.0% down · 7.5% · 30yr · 1.5% tax · 5.0% vac · 8.0% maint · 8.0% mgmt
Financing live
Cash to close
- Down payment
- $32,500
- Closing costs
- $3,900
- Reserves months
- —
- Total cash needed
- —
Loan-product check · same deal, 3 products live
Conventional
25% down · 7.5% · 30yr
- Down + closing
- —
- Monthly P&I
- —
- Monthly cashflow
- —
- DSCR
- —
- Eligible?
- —
Personal DTI + credit; lowest rate.
DSCR
20% down · 8.5% · 30yr
- Down + closing
- —
- Monthly P&I
- —
- Monthly cashflow
- —
- DSCR
- —
- Eligible?
- —
No personal income docs; deal must DSCR.
Hard money
10% down · 12.0% · 12mo
- Down + closing
- —
- Monthly P&I
- —
- Monthly cashflow
- —
- DSCR
- —
- Eligible?
- —
Short-term bridge; refi at stabilization.
Rent comps 11 comps
| Address | Beds | Baths | Sqft | Rent | $/sqft | DOM | Units | Dist |
|---|---|---|---|---|---|---|---|---|
| 805 S 6th St Unit 1 Bonham, TX | 3.0 | 2.5 | 1229 | $1,450 | $1.18 | 45d | 1 | 0.33mi |
| 406 S 6th St Unit 1 Bonham, TX | 3.0 | 2.0 | 1198 | $1,300 | $1.09 | 45d | 1 | 0.45mi |
| 406 W 6th St Bonham, TX | 3.0 | 2.0 | 1198 | $1,350 | $1.13 | 45d | 1 | 0.77mi |
| 913 W 12th St Bonham, TX | 3.0 | 2.0 | 1355 | $1,700 | $1.25 | 45d | 1 | 0.92mi |
| 412 E 7th St Unit 2 Bonham, TX | 3.0 | 2.5 | 1366 | $1,500 | $1.10 | 45d | 1 | 1.12mi |
| 708 Union Ave Bonham, TX | 2.0 | 1.0 | 828 | $1,100 | $1.33 | 45d | 1 | 1.15mi |
| 317 Jones St Bonham, TX | 3.0 | 2.0 | 1067 | $1,500 | $1.41 | 45d | 1 | 1.16mi |
| 608 E 3rd St Unit 2 Bonham, TX | 3.0 | 2.0 | 1197 | $1,295 | $1.08 | 45d | 1 | 1.18mi |
| 613 E 3rd St Bonham, TX | 3.0 | 2.0 | 1197 | $1,299 | $1.09 | 23d | 1 | 1.19mi |
| 1014 Pine St Bonham, TX | 3.0 | 2.0 | 1200 | $1,475 | $1.23 | 45d | 1 | 1.38mi |
| 1624 Cedar St Bonham, TX | 3.0 | 2.0 | 1004 | $1,275 | $1.27 | 45d | 1 | 1.39mi |
Listing history 4 events
-
2026-06-21days on market $130,000 Active 4 DOM
-
2026-06-19days on market $130,000 Active 2 DOM
-
2026-06-17remarks 419-char remark
-
2026-06-17$130,000 Active 1 DOM
ⓘ Source: listings_history table (triggers on properties + properties_extension) + one-shot
backfill from property_details.listing_events for pre-trigger history.
Tax reassessment forecast TX · Resets to sale price
- Current annual tax
- $2,717 · $226/mo
- Projected year-2 tax
- $2,717 · $226/mo
- Expected delta
- $0/yr ($0/mo · 0.0%)
ⓘ Screening estimate from a state-policy table — verify with the county assessor before closing.
Climate risk First Street
- Flood 1/10 Low FEMA zone X (unshaded) · 0% chance over 30 yrs
- Wildfire 7/10 Severe
- Heat 7/10 Severe 7 d/yr ≥111°F today · 22 d/yr by 30 yrs out
- Wind 5/10 Major 26% chance of damaging wind over 30 yrs
- Air quality 2/10 Low 1 unhealthy d/yr today · 1 by 30 yrs out
Nearby sold comps map
Loading sold comps map…
Walkable amenities ~0.75 mi
Loading nearby amenities…
Taxation est. · year 1
- Rental income
- $17,261
- − Mortgage interest
- −$7,282
- − Property taxes
- −$2,717
- − Insurance
- −$650
- − Repairs & maintenance
- −$1,381
- − Management
- −$1,381
- − Depreciation
- −$3,782
- Taxable income
- $68
- Est. tax owed @ 24.0%
- −$16
- After-tax cash flow
- $2,072/yr
For passive investors: Depreciation is non-cash, so a rental often shows a tax loss while cash-flowing — sheltering income. Rental losses are passive: they offset passive income freely, and up to $25,000/yr can offset ordinary (W-2) income if you actively participate and your MAGI is under $100k (phasing out to $0 by $150k); unused losses carry forward. On sale, claimed depreciation is recaptured at up to 25%, and gains may owe capital-gains tax (a 1031 exchange can defer both). Figures are a year-1 estimate at your 24.0% rate — not tax advice; consult a CPA.
Schools (NCES district)
- District
- Bonham ISD
- NCES district ID
- 4810800
- Math proficiency
- 37% ▼ -1.00%
- Reading proficiency
- 38% ▼ -2.00%
- Median HH income
- $41,740
- Composite
- 31.63/100
- National rank
- #5937
- State rank
- #477 of 826 in TX
Livability — Bonham
- Score
- 64/100
- State rank
- #785
- US rank
- #14360
Category grades
Schools grade is shown separately in the Schools card above.
Census & demographics
- Census place
- Bonham, TX
- County
- Fannin County · 15,155 people
- City population
- 15,155
- Metro
- Bonham, TX
- Population (ZIP)
- 15,155
- Household income
- $68,918
- Rent vs Own
- Severe rent burden
- 281.0
Population outlook (Fannin County) Hauer SSP2
- Today (2025)
- 33,423 people
- By 2030
- 33,035 · -1.2%
- By 2040
- 32,250 · -3.5%
- By 2050
- 31,462 · -5.9%
- By 2075
- 29,447 · -11.9%
- By 2100
- 25,459 · -23.8%
Race, ethnicity, and origin ACS 2023
- Neighborhood character
- Predominantly White (68%)
- Race & ethnicity
- White 68% Hispanic / Latino 17% Black 10% Two or more races 8%
- Hispanic origin (detail)
- Mexican 16%
- Common ancestry
- Lithuanian 3% Slovak 1% Italian 1%
- Foreign-born
- 7% · Canada, Philippines
- Languages at home
- 85% English-only · Spanish 14%
Political lean MEDSL · Fannin
- 2024 margin
- Solid R (+67.4) · D 15.9% · R 83.3%
- 2008→2024 swing
- -27.8pp toward R · 2008: -39.6pp · 2024: -67.4pp
- All cycles
- 2024: R+67.4 2020: R+63.4 2016: R+61.9 2012: R+52.5 2008: R+39.6
Not yet ingested
- Civics
- —
Market trends
- HPI YoY
- ▼ -25.59%
- Current HPI
- 262.7177
- Rent YoY
- —
- Metro
- Bonham, TX
- State GDP YoY
- ▲ 3.95%
- F500 in state
- 110
Industry mix (Fortune 500 HQ in TX)
| Industry | F500 HQs | Revenue |
|---|---|---|
| Energy | 16 | $1,198B |
|
||
| Technology | 5 | $198B |
|
||
| Engineering / Construction | 4 | $72B |
|
||
| Energy Services | 3 | $60B |
|
||
| Utilities | 3 | $41B |
|
||
| Healthcare | 2 | $330B |
|
||
Price history
+340.7% since first listed19 events — show timeline
- 2026-06-17 Listed $130,000 NTREIS
- 2026-02-17 Listing Removed — NTREIS
- 2026-01-06 Price Changed $162,000 NTREIS
- 2025-12-02 Listed $165,000 NTREIS
- 2023-03-04 Price Changed $159,900 NTREIS
- 2023-02-17 Listed $185,000 NTREIS
- 2016-12-28 Sold (Public Records) — Public Records
- 2016-12-16 Sold (MLS) — NTREIS
- 2016-11-28 Pending — NTREIS
- 2016-11-07 Listed $21,500 NTREIS
- 2016-01-14 Sold (Public Records) — Public Records
- 2016-01-08 Sold (MLS) — NTREIS
- 2015-12-18 Pending — NTREIS
- 2015-07-20 Price Changed $18,400 NTREIS
- 2011-07-26 Listed $19,900 NTREIS
- 2008-06-20 Sold (Public Records) — Public Records
- 2008-06-05 Sold (MLS) — NTREIS
- 2008-05-16 Listing Removed — NTREIS
- 2007-06-05 Listed $29,500 NTREIS
Property tax history
+20.1%/yrLatest (2025): $2,717 · -0.8% YoY. Source: county tax records.
Cash-flow waterfall
monthlySold comps — $/sqft
last 12 mo · ≤1 miLoading sold comps…