1128 Rashell Dr · Crystal, MI
Flood risk 1/10 · Minimal
- FEMA flood zone
- —
- Chance of flooding over 30 yrs
- 0.0%
- Est. flood insurance / yr
- —
Fire risk 1/10 · Minimal
- Est. fire insurance / yr
- $784 – $1,456
Heat risk 2/10 · Minimal
- Hot days now (above 98°F)
- 7 days/yr
- Hot days in 30 yrs
- 14 days/yr
Wind risk 1/10 · Minimal
- Chance of severe wind over 30 yrs
- —
Air-quality risk 2/10 · Minimal
- Unhealthy air days now
- 1 days/yr
- Unhealthy air days in 30 yrs
- 2 days/yr
Risk factors via First Street. Map © Google.
Why this score? — see what drove the C- grade
The composite is a weighted blend of 9 inputs, each scored 0–100. Each bar is that input's sub-score; the figure is the points it added to the 100-point composite (weight × sub-score).
- Cash flow +22.2/30.0
- ARV discount +7.5/15.0
- DSCR +7.1/10.0
- 1% rule +5.8/10.0
- Rent growth +2.5/5.0
- Livability +2.5/5.0
- Condition / age +2.5/5.0
- Schools +1.9/10.0
- Appreciation +0.0/10.0
$118,000
🖨 Deal sheet 📄 Offer letter ✓ Due diligence
Listing remarks MLS
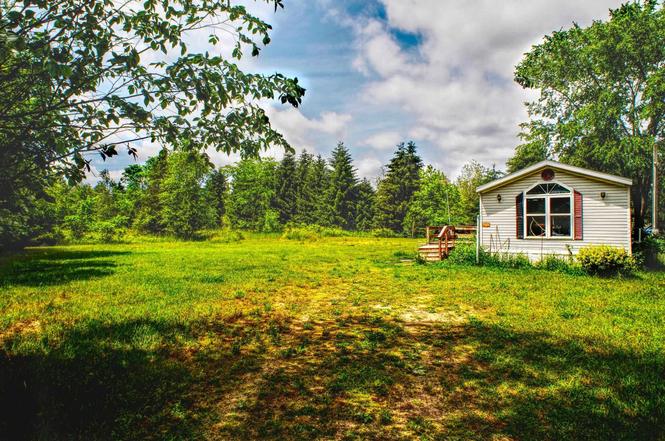
Escape to peaceful country living with this charming 2-bedroom 2-bathroom home situated on a spacious 1-acre lot. This home features a functional floor plan with comfortable living spaces, a primary bedroom with it's own private bath, and plenty of room to make it your own. Outside, the expansive acreage offers endless possibilities for gardening, outdoor recreation, pets, or future improvements. The property is equipped with a private well and septic system, helping to reduce monthly costs. Whether you're looking for an affordable primary residence, peaceful retreat, or investment opportunity, this property offers country charm and room to grow! Don't miss your chance to own a slice of the countryside- schedule your private showing today!
Key facts
- 1.13 acre lot
- Built 1994
- Listed 3 days
Property features AI
Finance
- Other: Located in CRYSTAL TOWNSHIP subdivision; Cross streets: Stanton/Ithaca Rd / Pake's Rd.
- HOA & community: Homeowners association present
Exterior
- Utilities: Private well water; Septic tank sewer
- Home design: Single-family residence; One level
- Construction: Vinyl siding; 1,000 square feet above grade finished area
- Exterior features: Lot approximately 225 x 225; Lot about 1.13 acres
Interior
- Bathrooms: 2 full bathrooms
- Heating & cooling: Forced air heating (natural gas); No cooling
- Interior features: Crawl space basement; Total of 5 rooms
Neighborhood map
What this means for you Summary
Snapshot
- This is a 2-bed/2.0-bath single-family listed at $118k.
Deal economics
- At list price, monthly cash flow is $193 ($2k/yr) — positive.
- The deal already cash-flows at list — no discount required.
- Meets the 1% rule at list price ($1k rent vs $118k).
Location & tenants
- Location reads: area grade C — affects rentability + tenant quality, not the cash-flow math above.
- Carson City-Crystal Area Schools (rural): math 17% / reading 27% proficiency, ranked #449 of 540 in MI (top 83%) — low school quality limits family demand, transient renter base, plan for 1-2y turnover.
- Market conditions: 21 active listings in the ZIP; 273 units permitted in Montcalm County in 2024 (5 in 5+ unit buildings).
Forward outlook
- Local home prices are declining (-3.0%/yr); year-one equity from $816 of loan paydown is wiped out by about $4k of value loss. Plan a longer hold.
- Montcalm County population projected at -17% by 2050 — secular population decline; favor cash flow + early exit over multi-decade hold.
Negotiation context
- Only 3 days on market — expect competitive offers; lowballing is unlikely to land.
- 4 sale attempts since 11y ago with the ask held roughly flat each time — persistent listings suggest the price (not the market) is what's stuck; bring a comps-based counter.
- Current owner paid $33k; list at $118k implies a 259% gain — meaningful room to come down on a strong offer.
Questions for the listing agent
- Is there a deadline driving the sale (1031 exchange, divorce, estate, relocation)? That informs how much negotiation room exists.
- What's the average days-on-market for RENTAL listings here right now (not sales)? A rising rental-DOM trend means longer vacancies and softer asking-rent achievability than the comps imply.
- What's the recent tenant-quality profile in this submarket — average credit score on applications, eviction rate, late-payment / NSF rate, and stable-employment percentage? A property-management company in the area should have these aggregated.
- How much new for-sale + rental construction is in the pipeline within 1–3 miles? Heavy new supply typically softens prices + rents 12–24 months out; constrained supply supports both.
Investment metrics
- 1% rule
- 1.08% ✓
- Cap rate
- 8.26%
- Cash-on-cash
- 7.01%
- DSCR
- 1.31
- GRM
- 7.7
CMA / ARV
No comps found within radius.
Projected returns pro-forma
-3.0% appreciation · 3.0% rent growth · sell at horizon
- IRR
- -5.5%
- Equity multiple
- 0.79×
- Total profit
- $-6,809
- Equity at exit
- $17,594
- IRR
- 4.1%
- Equity multiple
- 1.30×
- Total profit
- $9,978
- Equity at exit
- $10,202
Cash invested: $33,040 (down + closing). Projections, not guarantees.
Landlord ↔ Tenant lean methodology
- Overall (STATE)
- 62 Landlord-Friendly
- State Michigan
- 62 Landlord-Friendly · EVEN
- County
- — inherits STATE
- City
- — inherits STATE
ZIP-level market 48818
- Home prices YoY
- -26.2%
- Active inventory
- 21
- Price-to-rent
- 7.7×
Monthly cashflow live
- Estimated rent
- $1,277 medium interval (Pro) →
- Mortgage (P&I)
- −$619
- Tax est. 1.5%
- −$148 /mo · $1,770/yr
- Insurance
- −$49
- HOA
- −$0
- Vacancy / Maint / Mgmt
- −$268
- Net cashflow
- $193
Break-even live
UW: 25.0% down · 7.5% · 30yr · 1.5% tax · 5.0% vac · 8.0% maint · 8.0% mgmt
Financing live
Cash to close
- Down payment
- $29,500
- Closing costs
- $3,540
- Reserves months
- —
- Total cash needed
- —
Loan-product check · same deal, 3 products live
Conventional
25% down · 7.5% · 30yr
- Down + closing
- —
- Monthly P&I
- —
- Monthly cashflow
- —
- DSCR
- —
- Eligible?
- —
Personal DTI + credit; lowest rate.
DSCR
20% down · 8.5% · 30yr
- Down + closing
- —
- Monthly P&I
- —
- Monthly cashflow
- —
- DSCR
- —
- Eligible?
- —
No personal income docs; deal must DSCR.
Hard money
10% down · 12.0% · 12mo
- Down + closing
- —
- Monthly P&I
- —
- Monthly cashflow
- —
- DSCR
- —
- Eligible?
- —
Short-term bridge; refi at stabilization.
Listing history 4 events
-
2026-06-18days on market $118,000 Active 3 DOM
-
2026-06-17days on market $118,000 Active 2 DOM
-
2026-06-16remarks 699-char remark
-
2026-06-16$118,000 Active 1 DOM
ⓘ Source: listings_history table (triggers on properties + properties_extension) + one-shot
backfill from property_details.listing_events for pre-trigger history.
Climate risk First Street
- Flood 1/10 Low 0% chance over 30 yrs
- Wildfire 1/10 Low
- Heat 2/10 Low 7 d/yr ≥98°F today · 14 d/yr by 30 yrs out
- Wind 1/10 Low
- Air quality 2/10 Low 1 unhealthy d/yr today · 2 by 30 yrs out
Nearby sold comps map
Loading sold comps map…
Walkable amenities ~0.75 mi
Loading nearby amenities…
Taxation est. · year 1
- Rental income
- $15,319
- − Mortgage interest
- −$6,610
- − Property taxes
- −$1,770
- − Insurance
- −$590
- − Repairs & maintenance
- −$1,225
- − Management
- −$1,225
- − Depreciation
- −$3,433
- Taxable income
- $465
- Est. tax owed @ 24.0%
- −$112
- After-tax cash flow
- $2,204/yr
For passive investors: Depreciation is non-cash, so a rental often shows a tax loss while cash-flowing — sheltering income. Rental losses are passive: they offset passive income freely, and up to $25,000/yr can offset ordinary (W-2) income if you actively participate and your MAGI is under $100k (phasing out to $0 by $150k); unused losses carry forward. On sale, claimed depreciation is recaptured at up to 25%, and gains may owe capital-gains tax (a 1031 exchange can defer both). Figures are a year-1 estimate at your 24.0% rate — not tax advice; consult a CPA.
Schools (NCES district)
- District
- Carson City-Crystal Area Schools
- NCES district ID
- 2608130
- Math proficiency
- 17% ▼ -15.00%
- Reading proficiency
- 27% ▼ -9.00%
- Median HH income
- $42,566
- Composite
- 18.83/100
- National rank
- #8865
- State rank
- #449 of 540 in MI
Livability — Crystal
No livability data for this city. (Only ~50 U.S. cities are tracked.)
Census & demographics
- Population (ZIP)
- 2,541
Population outlook (Montcalm County) Hauer SSP2
- Today (2025)
- 61,011 people
- By 2030
- 59,467 · -2.5%
- By 2040
- 55,427 · -9.2%
- By 2050
- 50,517 · -17.2%
- By 2075
- 38,731 · -36.5%
- By 2100
- 26,770 · -56.1%
Race, ethnicity, and origin ACS 2023
- Neighborhood character
- Predominantly White (86%)
- Race & ethnicity
- White 86% Black 7% Hispanic / Latino 6% Two or more races 5%
- Hispanic origin (detail)
- Cuban 5%
- Common ancestry
- Iranian 4% Lithuanian 2% Slovak 1%
- Foreign-born
- 5% · Canada, China
- Languages at home
- 99% English-only · Chinese 1%
Political lean MEDSL · Montcalm
- 2024 margin
- Solid R (+39.0) · D 29.8% · R 68.7% · Other 1.5%
- 2008→2024 swing
- -38.7pp toward R · 2008: -0.3pp · 2024: -39.0pp
- All cycles
- 2024: R+39.0 2020: R+37.7 2016: R+34.0 2012: R+8.6 2008: R+0.3
Not yet ingested
- Civics
- —
Market trends
- HPI YoY
- ▼ -71.34%
- Current HPI
- 200.7585
- Rent YoY
- —
- Metro
- —
- State GDP YoY
- ▲ 1.37%
- F500 in state
- 28
Industry mix (Fortune 500 HQ in MI)
| Industry | F500 HQs | Revenue |
|---|---|---|
| Automotive Parts | 3 | $48B |
|
||
| Automotive | 2 | $372B |
|
||
| Chemicals | 1 | $45B |
|
||
| Automotive Retail | 1 | $29B |
|
||
| Healthcare / Medical Devices | 1 | $23B |
|
||
| Automotive Technology | 1 | $20B |
|
||
Price history
+1080.0% since first listed8 events — show timeline
- 2026-06-11 Listed $118,000 REALCOMP
- 2026-06-11 Listed $118,000 MiRealSource-MiMLS
- 2016-05-13 Listing Removed — REALCOMP
- 2016-05-13 Listing Removed — MiRealSource-MiMLS
- 2015-11-12 Listed $29,900 REALCOMP
- 2015-11-12 Listed $29,900 MiRealSource-MiMLS
- 2007-05-10 Sold (Public Records) $32,900 Public Records
- 1999-03-31 Sold (Public Records) $10,000 Public Records
Cash-flow waterfall
monthlySold comps — $/sqft
last 12 mo · ≤1 miLoading sold comps…