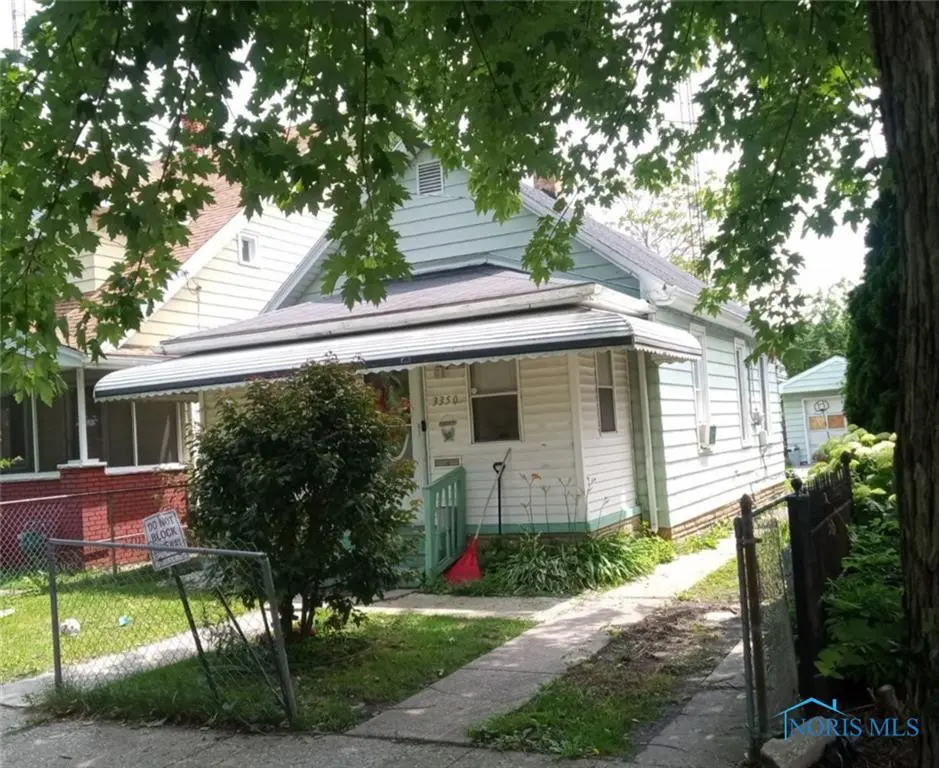
3350 Maple St · Toledo, OH
Flood risk 1/10 · Minimal
- FEMA flood zone
- X (unshaded)
- Chance of flooding over 30 yrs
- 0.0%
- Est. flood insurance / yr
- $507 – $1,088
Fire risk 1/10 · Minimal
- Est. fire insurance / yr
- $713 – $1,323
Heat risk 3/10 · Minor
- Hot days now (above 100°F)
- 7 days/yr
- Hot days in 30 yrs
- 16 days/yr
Wind risk 2/10 · Minimal
- Chance of severe wind over 30 yrs
- —
Air-quality risk 2/10 · Minimal
- Unhealthy air days now
- 1 days/yr
- Unhealthy air days in 30 yrs
- 3 days/yr
Risk factors via First Street. Map © Google.
Why this score? — see what drove the C+ grade
The composite is a weighted blend of 9 inputs, each scored 0–100. Each bar is that input's sub-score; the figure is the points it added to the 100-point composite (weight × sub-score).
- Cash flow +28.1/30.0
- DSCR +10.0/10.0
- ARV discount +7.5/15.0
- 1% rule +7.4/10.0
- Rent growth +3.5/5.0
- Livability +3.3/5.0
- Condition / age +2.5/5.0
- Schools +1.6/10.0
- Appreciation +0.0/10.0
$69,000
🖨 Deal sheet (PDF) 📄 Offer letter ✓ Due diligence
Listing remarks MLS
NOTICE: We are not considering seller financing or creative financing offers that do not consist of us in recorded first lien position with a minimum of 30% down. Thank you for understanding! This property is being sold as part of an 46-unit portfolio or a 10-unit sub-portfolio. In place cap is ~8.5%, pro forma cap is ~11.0%, and occupancy is 100%. Asking price for the 46-unit portfolio is $3.57M and asking price for the 5-unit sub-portfolio is $768.5K. The sub-portfolio includes 1820 Marne, 2002 Brame, 343 Heffner, 1215 Woodstock, 323 Champion, 3350 Maple, 811 Collins, 17 E Oakland, and 522 Saint Louis. The entire 46-unit list can be found in the attachments. Property is occupied and photos are from the last time it was vacant.
Key facts
- 3,598 sq ft lot
- Garage
- Built 1897
Neighborhood map
What this means for you Summary
Snapshot
- This is a 2-bed/1.5-bath single-family listed at $69k.
Deal economics
- At list price, monthly cash flow is $217 ($3k/yr) — positive.
- The deal already cash-flows at list — no discount required.
- Meets the 1% rule at list price ($853 rent vs $69k).
- Recommended offer: $61k (12.0% below list) — sets the bar for market timing.
- Cap rate 10.1% vs local median 7.6% in Toledo — top-decile yield for the area; either an underpriced asset or a hidden risk that comps aren't pricing in. Stress-test before assuming the spread holds.
Location & tenants
- Location reads 66/100 on livability (#645 in OH) — a middle-class / working-renter tenant base. Strengths: cost of living A+, housing A+, health & safety A+; Watch: amenities C-, schools D-, crime F.
- Toledo City (urban): math 15% / reading 24% proficiency, ranked #634 of 656 in OH (top 97%) — low school quality limits family demand, transient renter base, plan for 1-2y turnover; 72% free/reduced lunch — lower-income household profile, screen leases tightly.
- Market conditions: Rents rising (+3.9%/yr); 58 active listings in the ZIP; 8 comparable units currently listed for rent nearby; rentals at typical pace (median 22d on market — plan ~3-4 weeks tenant-placement turnaround); lower-income renter base — watch delinquency; 415 units permitted in Lucas County in 2024 (122 in 5+ unit buildings).
- This rent runs 35% of the median local income ($29k/yr) — at the standard rent-burdened threshold; future hikes will face affordability resistance.
Forward outlook
- Local home prices are declining (-3.0%/yr); year-one equity from $477 of loan paydown is wiped out by about $2k of value loss. Plan a longer hold.
- Lucas County population projected at -16% by 2050 — secular population decline; favor cash flow + early exit over multi-decade hold.
- At projected returns (-3.0% appreciation + 3.9% rent growth), your $19k cash investment doubles in ~8 years — after that, you're playing with house money.
Negotiation context
- It's been on market 262 days — a 12% lower offer ($61k) is reasonable based on typical stale-listing flexibility.
- 3 sale attempts since 15y ago; this cycle's ask has dropped $16k (19%) from the opening price — seller is motivated, your offer sets the floor, not the list.
- Current owner paid $36k; list at $69k implies a 89% gain — meaningful room to come down on a strong offer.
Risks & watch-outs
- Watch-outs: built in 1897 — expect roof / HVAC / electrical / plumbing capex.
Questions for the listing agent
- It's been on market 262 days. Have you received any prior offers? Is the seller open to a 12% concession, seller financing, or rate buy-down credit?
- Built in 1897 — when were the roof, HVAC, electrical panel, plumbing, and water heater last replaced?
- Why hasn't it sold? Are there any deal-killer items the seller is aware of (foundation, flood, title, zoning, code violations)?
- Is there a deadline driving the sale (1031 exchange, divorce, estate, relocation)? That informs how much negotiation room exists.
- Schools are D-rated, which usually means shorter tenancies and higher turnover. Who's the typical renter profile here, and what's been the actual vacancy rate?
- Crime grade is F in this area — have there been break-ins, vandalism, or insurance claims at this property in the last 3 years? What carrier currently insures it and at what premium?
- What's the average days-on-market for RENTAL listings here right now (not sales)? A rising rental-DOM trend means longer vacancies and softer asking-rent achievability than the comps imply.
- What's the recent tenant-quality profile in this submarket — average credit score on applications, eviction rate, late-payment / NSF rate, and stable-employment percentage? A property-management company in the area should have these aggregated.
- How much new for-sale + rental construction is in the pipeline within 1–3 miles? Heavy new supply typically softens prices + rents 12–24 months out; constrained supply supports both.
Investment metrics
- 1% rule
- 1.24% ✓
- Cap rate
- 10.07%
- Cash-on-cash
- 13.48%
- DSCR
- 1.60
- GRM
- 6.7
CMA / ARV
- ARV (median comp)
- $43,555
- List price
- $69,000
- Delta
- 58.42%
- Verdict
- OVERPRICED
- Comps
- 20 within 1.0 mi
Show comp detail 12 sales within ~0.75 mi
| Address | Dist | Beds/Ba | Sqft | Sold | Price | $/sf | Match |
|---|---|---|---|---|---|---|---|
| 3245 Elm St | 0.18mi | 2/1.0 | 756 (+5%) | 3mo | $33,000 | $44 | 79 |
| 246 E Manhattan Blvd | 0.19mi | 2/1.0 | 732 (+2%) | 14mo | $77,500 | $106 | 75 |
| 419 E Streicher St | 0.28mi | 2/1.0 | 672 (-7%) | 5mo | $17,500 | $26 | 69 |
| 30 W Oakland St | 0.44mi | 1/1.0 (-1) | 730 (+1%) | 6mo | $28,000 | $38 | 65 |
| 326 Bronson Ave | 0.45mi | 2/1.0 | 740 (+3%) | 14mo | $28,000 | $38 | 61 |
| 3545 Dean Ave | 0.22mi | 2/1.0 | 816 (+13%) | 6mo | $70,000 | $86 | 61 |
| 328 E Central Ave | 0.36mi | 2/1.0 | 776 (+8%) | 10mo | $25,500 | $33 | 60 |
| 34 E Streicher St | 0.38mi | 2/1.0 | 760 (+6%) | 17mo | $25,000 | $33 | 57 |
| 222 E Park St | 0.30mi | 2/1.0 | 810 (+12%) | 10mo | $41,800 | $52 | 55 |
| 531 E Park St | 0.41mi | 2/1.0 | 819 (+14%) | 5mo | $8,500 | $10 | 52 |
| 161 Mettler St | 0.60mi | 2/1.0 | 796 (+11%) | 1mo | $23,500 | $30 | 51 |
| 233 Bronson Ave | 0.43mi | 2/1.0 | 822 (+14%) | 14mo | $30,000 | $36 | 43 |
Match score weights: distance 35% · size 25% · config 20% · recency 20%. Top-matched comps best support the ARV.
Projected returns pro-forma
-3.0% appreciation · 3.89% rent growth · sell at horizon
- IRR
- 4.5%
- Equity multiple
- 1.18×
- Total profit
- $3,412
- Equity at exit
- $10,288
- IRR
- 14.8%
- Equity multiple
- 2.24×
- Total profit
- $23,992
- Equity at exit
- $5,966
Cash invested: $19,320 (down + closing). Projections, not guarantees.
Landlord ↔ Tenant lean methodology
- Overall (STATE)
- 73 Landlord-Friendly
- State Ohio
- 73 Landlord-Friendly · R+6
- County
- — inherits STATE
- City
- — inherits STATE
ZIP-level market 43608
- Home prices YoY
- -21.3%
- Rents YoY
- 3.9%
- Active inventory
- 58
- Price-to-rent
- 6.7×
Monthly cashflow live
- Estimated rent
- $853 high interval (Pro) →
- Mortgage (P&I)
- −$362
- Tax from tax record
- −$66 /mo · $796/yr
- Insurance
- −$29
- HOA
- −$0
- Vacancy / Maint / Mgmt
- −$179
- Net cashflow
- $217
Break-even live
Sensitivity live
| Price | -10% $256 | -5% $237 | +0% $217 | +5% $197 | +10% $178 |
|---|---|---|---|---|---|
| Rent | -10% $150 | -5% $183 | +0% $217 | +5% $251 | +10% $284 |
| Rate | -1.0pp $252 | -0.5pp $235 | base $217 | +0.5pp $199 | +1.0pp $181 |
UW: 25.0% down · 7.5% · 30yr · 1.5% tax · 5.0% vac · 8.0% maint · 8.0% mgmt
Financing live
Cash to close
- Down payment
- $17,250
- Closing costs
- $2,070
- Reserves months
- —
- Total cash needed
- —
Loan-product check · same deal, 3 products live
Conventional
25% down · 7.5% · 30yr
- Down + closing
- —
- Monthly P&I
- —
- Monthly cashflow
- —
- DSCR
- —
- Eligible?
- —
Personal DTI + credit; lowest rate.
DSCR
20% down · 8.5% · 30yr
- Down + closing
- —
- Monthly P&I
- —
- Monthly cashflow
- —
- DSCR
- —
- Eligible?
- —
No personal income docs; deal must DSCR.
Hard money
10% down · 12.0% · 12mo
- Down + closing
- —
- Monthly P&I
- —
- Monthly cashflow
- —
- DSCR
- —
- Eligible?
- —
Short-term bridge; refi at stabilization.
Rent comps 8 comps
| Address | Beds | Baths | Sqft | Rent | $/sqft | DOM | Units | Dist |
|---|---|---|---|---|---|---|---|---|
| 340 E Lake St Toledo, OH | 2.0 | 1.0 | 683 | $775 | $1.13 | 24d | 1 | 0.09mi |
| 2807 Chestnut St Unit 2 Toledo, OH | 1.0 | 1.0 | 745 | $495 | $0.66 | 21d | 1 | 0.64mi |
| 3474 Maher St Toledo, OH | 2.0 | 1.0 | 736 | $1,125 | $1.53 | 44d | 1 | 0.96mi |
| 4039 Vermaas Ave Toledo, OH | 1.0 | 1.0 | 612 | $675 | $1.10 | 44d | 1 | 1.31mi |
| 4412 Packard Rd Toledo, OH | 2.0 | 1.0 | 672 | $900 | $1.34 | 14d | 1 | 1.38mi |
| 244 Sunset Blvd Toledo, OH | 2.0 | 1.0 | 726 | $1,045 | $1.44 | 21d | 1 | 1.41mi |
| 3805 Berkeley Unit 3 Toledo, OH | 1.0 | 1.0 | 700 | $735 | $1.05 | 14d | 1 | 1.49mi |
| 426 Beacon St Toledo, OH | 1.0–2.0 | 1.0–1.5 | 809 | $882 | $1.09 | 14d | 10 | 1.49mi |
Listing history 26 events
-
2026-06-18days on market $69,000 Active 262 DOM
-
2026-06-17days on market $69,000 Active 261 DOM
-
2026-06-16days on market $69,000 Active 260 DOM
-
2026-06-15days on market $69,000 Active 259 DOM
-
2026-06-14days on market $69,000 Active 257 DOM
-
2026-06-10days on market $69,000 Active 254 DOM
-
2026-06-09days on market $69,000 Active 253 DOM
-
2026-06-08days on market $69,000 Active 252 DOM
-
2026-06-07days on market $69,000 Active 251 DOM
-
2026-06-05days on market $69,000 Active 248 DOM
-
2026-06-03days on market $69,000 Active 247 DOM
-
2026-06-02days on market $69,000 Active 246 DOM
-
2026-06-01days on market $69,000 Active 245 DOM
-
2026-05-31days on market $69,000 Active 244 DOM
-
2026-05-30days on market $69,000 Active 243 DOM
-
2026-01-14price $76,500 739-char remark
Show marketing remark (739 chars)
NOTICE: We are not considering seller financing or creative financing offers that do not consist of us in recorded first lien position with a minimum of 30% down. Thank you for understanding! This property is being sold as part of an 46-unit portfolio or a 10-unit sub-portfolio. In place cap is ~8.5%, pro forma cap is ~11.0%, and occupancy is 100%. Asking price for the 46-unit portfolio is $3.57M and asking price for the 5-unit sub-portfolio is $768.5K. The sub-portfolio includes 1820 Marne, 2002 Brame, 343 Heffner, 1215 Woodstock, 323 Champion, 3350 Maple, 811 Collins, 17 E Oakland, and 522 Saint Louis. The entire 46-unit list can be found in the attachments. Property is occupied and photos are from the last time it was vacant.
-
2025-11-10price $80,450 739-char remark
Show marketing remark (739 chars)
NOTICE: We are not considering seller financing or creative financing offers that do not consist of us in recorded first lien position with a minimum of 30% down. Thank you for understanding! This property is being sold as part of an 46-unit portfolio or a 10-unit sub-portfolio. In place cap is ~8.5%, pro forma cap is ~11.0%, and occupancy is 100%. Asking price for the 46-unit portfolio is $3.57M and asking price for the 5-unit sub-portfolio is $768.5K. The sub-portfolio includes 1820 Marne, 2002 Brame, 343 Heffner, 1215 Woodstock, 323 Champion, 3350 Maple, 811 Collins, 17 E Oakland, and 522 Saint Louis. The entire 46-unit list can be found in the attachments. Property is occupied and photos are from the last time it was vacant.
-
2025-10-14price $36,500 310-char remark
Show marketing remark (310 chars)
Stop by and take a look at what could be your next real estate investment addition to your portfolio or first-time buyer just starting out. This home has an approximately 1 year old, 40-year shingled roof installed. Don't let this easy to maintain and very affordable utilities home slip away before it's gone.
-
2025-09-26$85,000 Active 739-char remark
Show marketing remark (739 chars)
NOTICE: We are not considering seller financing or creative financing offers that do not consist of us in recorded first lien position with a minimum of 30% down. Thank you for understanding! This property is being sold as part of an 46-unit portfolio or a 10-unit sub-portfolio. In place cap is ~8.5%, pro forma cap is ~11.0%, and occupancy is 100%. Asking price for the 46-unit portfolio is $3.57M and asking price for the 5-unit sub-portfolio is $768.5K. The sub-portfolio includes 1820 Marne, 2002 Brame, 343 Heffner, 1215 Woodstock, 323 Champion, 3350 Maple, 811 Collins, 17 E Oakland, and 522 Saint Louis. The entire 46-unit list can be found in the attachments. Property is occupied and photos are from the last time it was vacant.
-
2022-09-20soldstatus $36,500 Closed 310-char remark
Show marketing remark (310 chars)
Stop by and take a look at what could be your next real estate investment addition to your portfolio or first-time buyer just starting out. This home has an approximately 1 year old, 40-year shingled roof installed. Don't let this easy to maintain and very affordable utilities home slip away before it's gone.
-
2022-09-08status Pending 310-char remark
Show marketing remark (310 chars)
Stop by and take a look at what could be your next real estate investment addition to your portfolio or first-time buyer just starting out. This home has an approximately 1 year old, 40-year shingled roof installed. Don't let this easy to maintain and very affordable utilities home slip away before it's gone.
-
2022-08-29historical Contingent 310-char remark
Show marketing remark (310 chars)
Stop by and take a look at what could be your next real estate investment addition to your portfolio or first-time buyer just starting out. This home has an approximately 1 year old, 40-year shingled roof installed. Don't let this easy to maintain and very affordable utilities home slip away before it's gone.
-
2022-08-19$39,900 Active 310-char remark
Show marketing remark (310 chars)
Stop by and take a look at what could be your next real estate investment addition to your portfolio or first-time buyer just starting out. This home has an approximately 1 year old, 40-year shingled roof installed. Don't let this easy to maintain and very affordable utilities home slip away before it's gone.
-
2011-12-19historical
-
2011-02-02$14,900
-
1992-10-07soldstatus $14,500
ⓘ Source: listings_history table (triggers on properties + properties_extension) + one-shot
backfill from property_details.listing_events for pre-trigger history.
Tax reassessment forecast OH · Partial reset (capped growth)
- Current annual tax
- $796 · $66/mo
- Projected year-2 tax
- $936 · $78/mo
- Expected delta
- +$140/yr (+$12/mo · 17.6%)
ⓘ Screening estimate from a state-policy table — verify with the county assessor before closing.
Climate risk First Street
- Flood 1/10 Low FEMA zone X (unshaded) · 0% chance over 30 yrs
- Wildfire 1/10 Low
- Heat 3/10 Moderate 7 d/yr ≥100°F today · 16 d/yr by 30 yrs out
- Wind 2/10 Low
- Air quality 2/10 Low 1 unhealthy d/yr today · 3 by 30 yrs out
Nearby sold comps map
Loading sold comps map…
Walkable amenities ~0.75 mi
Loading nearby amenities…
Taxation est. · year 1
- Rental income
- $10,238
- − Mortgage interest
- −$3,865
- − Property taxes
- −$796
- − Insurance
- −$345
- − Repairs & maintenance
- −$819
- − Management
- −$819
- − Depreciation
- −$2,007
- Taxable income
- $1,586
- Est. tax owed @ 24.0%
- −$381
- After-tax cash flow
- $2,224/yr
For passive investors: Depreciation is non-cash, so a rental often shows a tax loss while cash-flowing — sheltering income. Rental losses are passive: they offset passive income freely, and up to $25,000/yr can offset ordinary (W-2) income if you actively participate and your MAGI is under $100k (phasing out to $0 by $150k); unused losses carry forward. On sale, claimed depreciation is recaptured at up to 25%, and gains may owe capital-gains tax (a 1031 exchange can defer both). Figures are a year-1 estimate at your 24.0% rate — not tax advice; consult a CPA.
Schools (NCES district)
- District
- Toledo City
- NCES district ID
- 3904490
- Math proficiency
- 15% ▼ -16.00%
- Reading proficiency
- 24% ▼ -13.00%
- Median HH income
- $32,137
- Composite
- 15.76/100
- National rank
- #9276
- State rank
- #634 of 656 in OH
Livability — Toledo
- Score
- 66/100
- State rank
- #645
- US rank
- #11442
Category grades
Schools grade is shown separately in the Schools card above.
Census & demographics
- Census place
- Toledo, OH
- County
- Lucas County · 380,724 people
- City population
- 280,811
- Metro
- Toledo, OH
- Population (ZIP)
- 13,593
- Household income
- $29,275
- Rent vs Own
- Severe rent burden
- 911.0
Population outlook (Lucas County) Hauer SSP2
- Today (2025)
- 420,751 people
- By 2030
- 410,187 · -2.5%
- By 2040
- 384,019 · -8.7%
- By 2050
- 355,125 · -15.6%
- By 2075
- 291,683 · -30.7%
- By 2100
- 233,670 · -44.5%
Race, ethnicity, and origin ACS 2023
- Neighborhood character
- Diverse neighborhood (Simpson 0.60)
- Race & ethnicity
- Black 57% White 25% Two or more races 9% Hispanic / Latino 8% Asian 2%
- Hispanic origin (detail)
- Mexican 4%
- Common ancestry
- Romanian 4% Lithuanian 2% Slovak 1%
- Foreign-born
- 4% · Canada, China
- Languages at home
- 91% English-only · Spanish 7%
Political lean MEDSL · Lucas
- 2024 margin
- D (+12.6) · D 55.8% · R 43.2%
- 2008→2024 swing
- -18.9pp toward R · 2008: 31.4pp · 2024: 12.6pp
- All cycles
- 2024: D+12.6 2020: D+16.8 2016: D+17.4 2012: D+30.4 2008: D+31.4
Not yet ingested
- Civics
- —
Market trends
- HPI YoY
- ▼ -37.73%
- Current HPI
- 139.4964
- Rent YoY
- ▲ 3.89%
- Metro
- Toledo, OH
- State GDP YoY
- ▲ 1.98%
- F500 in state
- 48
Industry mix (Fortune 500 HQ in OH)
| Industry | F500 HQs | Revenue |
|---|---|---|
| Insurance | 3 | $145B |
|
||
| Industrial Machinery | 3 | $49B |
|
||
| Financial Services | 3 | $24B |
|
||
| Consumer Goods | 2 | $93B |
|
||
| Aerospace / Defense | 2 | $47B |
|
||
| Utilities | 2 | $33B |
|
||
Price history
+427.6% since first listed11 events — show timeline
- 2026-01-14 Price Changed $76,500 NORIS
- 2025-11-10 Price Changed $80,450 NORIS
- 2025-10-14 Price Changed $36,500 NORIS
- 2025-09-26 Listed $85,000 NORIS
- 2022-09-20 Sold (MLS) $36,500 NORIS
- 2022-09-08 Pending — NORIS
- 2022-08-29 Contingent — NORIS
- 2022-08-19 Listed $39,900 NORIS
- 2011-12-19 Listing Removed — NORIS
- 2011-02-02 Listed $14,900 NORIS
- 1992-10-07 Sold (Public Records) $14,500 Public Records
Property tax history
+3.8%/yrLatest (2025): $796 · +2.1% YoY. Source: county tax records.
Cash-flow waterfall
monthlySold comps — $/sqft
last 12 mo · ≤1 miLoading sold comps…