57 Southview Dr · Arcade, NY
Flood risk 7/10 · Major
- FEMA flood zone
- X
- Chance of flooding over 30 yrs
- 0.99%
- Est. flood insurance / yr
- $507 – $1,088
Fire risk 1/10 · Minimal
- Est. fire insurance / yr
- $691 – $1,283
Heat risk 2/10 · Minimal
- Hot days now (above 90°F)
- 8 days/yr
- Hot days in 30 yrs
- 19 days/yr
Wind risk 1/10 · Minimal
- Chance of severe wind over 30 yrs
- —
Air-quality risk 2/10 · Minimal
- Unhealthy air days now
- 0 days/yr
- Unhealthy air days in 30 yrs
- 1 days/yr
Risk factors via First Street. Map © Google.
Why this score? — see what drove the A grade
The composite is a weighted blend of 9 inputs, each scored 0–100. Each bar is that input's sub-score; the figure is the points it added to the 100-point composite (weight × sub-score).
- Cash flow +30.0/30.0
- ARV discount +15.0/15.0
- 1% rule +10.0/10.0
- DSCR +10.0/10.0
- Appreciation +7.8/10.0
- Schools +4.4/10.0
- Condition / age +3.8/5.0
- Livability +3.2/5.0
- Rent growth +2.5/5.0
$59,900
🖨 Deal sheet 📄 Offer letter ✓ Due diligence
Listing remarks
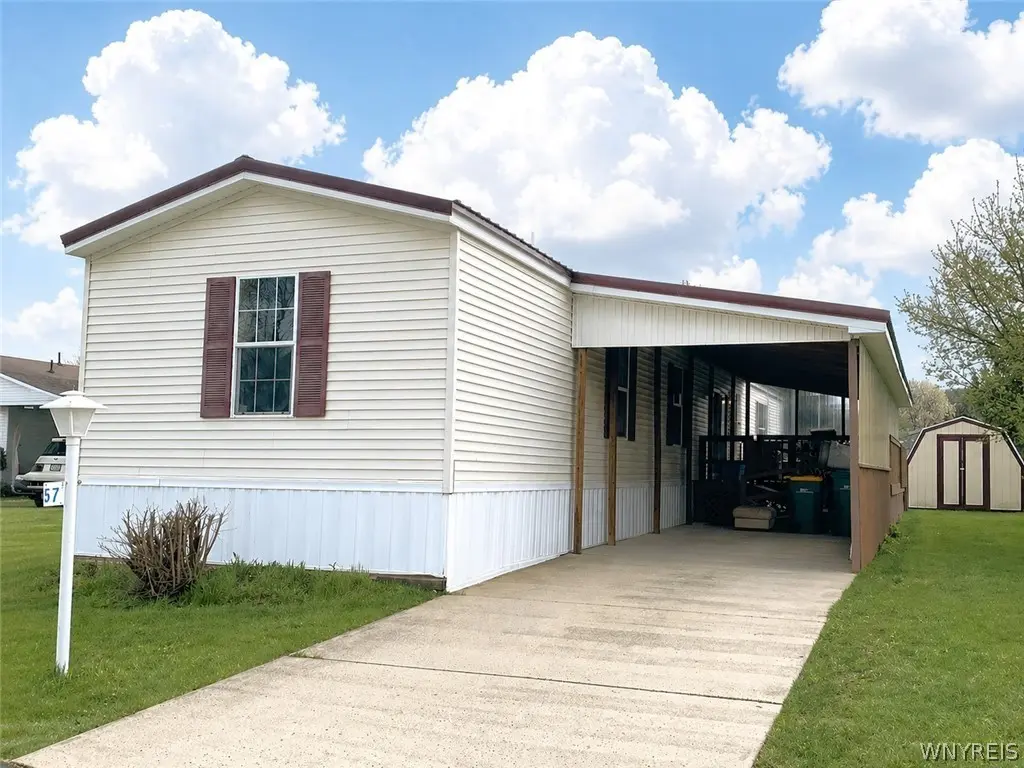
Well-maintained 2008 single-wide home located in Arcade Valley Estates. The spacious kitchen features a center island for added storage and prep space, all appliances, including the washer and dryer will stay. Nice size pantry and a separate laundry area for convenience. Offering three bedrooms and two full baths, this home provides a comfortable and functional layout. A sturdy covered wooden ramp leads to a covered deck and main entrance, with an additional open deck perfect for enjoying the outdoors. The property also includes central air, carport for one vehicle, plus extra parking in the concrete driveway. The metal roof was newly installed in 2024. Negotiations begin on Tuesday, May 5t
Key facts
- Covered deck
- Open deck
- Metal roof
Tags
Property features AI
Finance
- HOA & community: Land lease: $390
Exterior
- Parking: One covered carport; One garage space
- Utilities: Public water connected; Sewer connected; Electric service
- Home design: Single-wide mobile home; One story; Existing/resale unit; Fairmont / Bayview model
- Construction: Vinyl siding; Metal roof; Pillar/post/pier foundation
- Exterior features: Concrete driveway; Deck; Covered porch; Porch; Shed(s) / storage
Interior
- Kitchen: Electric oven and range; Microwave; Dishwasher; Refrigerator; Kitchen island; Eat-in kitchen
- Bedrooms: Three main-level bedrooms
- Flooring: Carpet; Vinyl; Varied flooring
- Bathrooms: Two full bathrooms (both on the main level)
- Heating & cooling: Forced air heat (electric); Central air conditioning
- Interior features: Eat-in kitchen; Kitchen island; Separate/formal living room; Window treatments; Drapes; Main level primary suite
- Laundry & utility: Washer and dryer on the main level; Electric water heater
Neighborhood map
What this means for you Summary
Snapshot
- This is a 3-bed/2.0-bath manufactured listed at $60k. Condition is rated good.
Deal economics
- At list price, monthly cash flow is $321 ($4k/yr) — positive.
- The deal already cash-flows at list — no discount required.
- Meets the 1% rule at list price ($1k rent vs $60k).
Location & tenants
- Location reads 64/100 on livability (#774 in NY) — a middle-class / working-renter tenant base. Strengths: housing A+, cost of living A, crime A-; Watch: schools C-, amenities F, commute F.
- Yorkshire-Pioneer Central School District (town): math 50% / reading 54% proficiency, ranked #358 of 590 in NY (top 61%) — acceptable for families but not a draw, mixed tenant base, ~2y average lease.
- Market conditions: 39 active listings in the ZIP; 1 comparable units currently listed for rent nearby; 83 units permitted in Wyoming County in 2024 (0 in 5+ unit buildings).
Forward outlook
- In year one you build about $4k of equity ($414 loan paydown + $3k appreciation (5.7% local appreciation)).
- Wyoming County population projected at -16% by 2050 — secular population decline; favor cash flow + early exit over multi-decade hold.
- At projected returns (5.7% appreciation + 3.0% rent growth), your $17k cash investment doubles in ~3 years — after that, you're playing with house money.
- By year 9, paydown + projected appreciation supports a ~$34k cash-out refi (75% LTV) — recoverable capital for the next deal without selling this one.
Negotiation context
- Only 10 days on market — expect competitive offers; lowballing is unlikely to land.
Risks & watch-outs
- Watch-outs: flood insurance adds $66/mo.
- Climate carrying-cost: major flood risk — expect insurance premiums to compound above CPI over the hold.
Questions for the listing agent
- What's the actual annual flood-insurance premium (NFIP or private), and is the property in a SFHA with mandatory coverage?
- Is there a deadline driving the sale (1031 exchange, divorce, estate, relocation)? That informs how much negotiation room exists.
- What's the average days-on-market for RENTAL listings here right now (not sales)? A rising rental-DOM trend means longer vacancies and softer asking-rent achievability than the comps imply.
- What's the recent tenant-quality profile in this submarket — average credit score on applications, eviction rate, late-payment / NSF rate, and stable-employment percentage? A property-management company in the area should have these aggregated.
- How much new for-sale + rental construction is in the pipeline within 1–3 miles? Heavy new supply typically softens prices + rents 12–24 months out; constrained supply supports both.
Investment metrics
- 1% rule
- 1.69% ✓
- Cap rate
- 14.06%
- Cash-on-cash
- 27.75%
- DSCR
- 2.23
- GRM
- 4.9
CMA / ARV
- ARV (median comp)
- $88,875
- List price
- $59,900
- Delta
- -32.60%
- Verdict
- UNDERPRICED
- Comps
- 20 within 1.0 mi
Show comp detail 11 sales within ~0.75 mi
| Address | Dist | Beds/Ba | Sqft | Sold | Price | $/sf | Match |
|---|---|---|---|---|---|---|---|
| 57 Southview Dr | 0.00mi | 3/2.0 | 1,216 (0%) | 1mo | $70,000 | $58 | 99 |
| 127 Sunset | 0.12mi | 3/2.0 | 1,344 (+10%) | 2mo | $82,000 | $61 | 75 |
| 487 Carter | 0.08mi | 3/1.0 | 1,120 (-8%) | 5mo | $106,000 | $95 | 75 |
| 67 Winterview Dr | 0.02mi | 2/2.0 (-1) | 1,088 (-10%) | 4mo | $65,000 | $60 | 73 |
| 114 Summerview Dr | 0.08mi | 3/2.0 | 1,344 (+10%) | 12mo | $71,000 | $53 | 69 |
| 128 Lilac Ln | 0.12mi | 3/2.0 | 1,387 (+14%) | 5mo | $110,000 | $79 | 67 |
| 377 Southview Dr | 0.27mi | 2/2.0 (-1) | 1,100 (-10%) | 11mo | $74,469 | $68 | 58 |
| 342 Circle Ct | 0.25mi | 2/1.5 (-1) | 1,064 (-12%) | 10mo | $36,700 | $34 | 52 |
| 387 Southview Dr | 0.29mi | 2/1.5 (-1) | 1,100 (-10%) | 16mo | $28,000 | $25 | 50 |
| 50 Southview | 0.04mi | 2/1.0 (-1) | 1,056 (-13%) | 22mo | $105,000 | $99 | 49 |
| 386 Southview Dr | 0.35mi | 2/1.0 (-1) | 1,057 (-13%) | 8mo | $30,000 | $28 | 46 |
Match score weights: distance 35% · size 25% · config 20% · recency 20%. Top-matched comps best support the ARV.
Projected returns pro-forma
5.65% appreciation · 3.0% rent growth · sell at horizon
- IRR
- 34.1%
- Equity multiple
- 3.18×
- Total profit
- $36,579
- Equity at exit
- $36,333
- IRR
- 32.0%
- Equity multiple
- 6.49×
- Total profit
- $92,033
- Equity at exit
- $64,775
Cash invested: $16,772 (down + closing). Projections, not guarantees.
Landlord ↔ Tenant lean methodology
- Overall (STATE)
- 15 Strongly Tenant-Friendly
- State New York
- 15 Strongly Tenant-Friendly · D+10
- County
- — inherits STATE
- City
- — inherits STATE
ZIP-level market 14009
- Home prices YoY
- 2.0%
- Active inventory
- 39
- Price-to-rent
- 4.9×
Monthly cashflow live
- Estimated rent
- $1,015 medium interval (Pro) →
- Mortgage (P&I)
- −$314
- Tax est. 1.5%
- −$75 /mo · $898/yr
- Insurance
- −$25
- Flood insurance flood zone
- −$66 /mo · $798/yr
- HOA
- −$0
- Vacancy / Maint / Mgmt
- −$213
- Net cashflow
- $321
Break-even live
UW: 25.0% down · 7.5% · 30yr · 1.5% tax · 5.0% vac · 8.0% maint · 8.0% mgmt
Financing live
Cash to close
- Down payment
- $14,975
- Closing costs
- $1,797
- Reserves months
- —
- Total cash needed
- —
Loan-product check · same deal, 3 products live
Conventional
25% down · 7.5% · 30yr
- Down + closing
- —
- Monthly P&I
- —
- Monthly cashflow
- —
- DSCR
- —
- Eligible?
- —
Personal DTI + credit; lowest rate.
DSCR
20% down · 8.5% · 30yr
- Down + closing
- —
- Monthly P&I
- —
- Monthly cashflow
- —
- DSCR
- —
- Eligible?
- —
No personal income docs; deal must DSCR.
Hard money
10% down · 12.0% · 12mo
- Down + closing
- —
- Monthly P&I
- —
- Monthly cashflow
- —
- DSCR
- —
- Eligible?
- —
Short-term bridge; refi at stabilization.
Rent comps 1 comps
| Address | Beds | Baths | Sqft | Rent | $/sqft | DOM | Units | Dist |
|---|---|---|---|---|---|---|---|---|
| 12100 Countyline Rd Arcade, NY | 2.0 | 1.0 | 810 | $1,015 | $1.25 | 15d | 1 | 0.15mi |
Listing history 2 events
-
2026-05-06status Pending 712-char remark
-
2026-04-26$59,900 Active 712-char remark
ⓘ Source: listings_history table (triggers on properties + properties_extension) + one-shot
backfill from property_details.listing_events for pre-trigger history.
Climate risk First Street
- Flood 7/10 Severe FEMA zone X · 99% chance over 30 yrs
- Wildfire 1/10 Low
- Heat 2/10 Low 8 d/yr ≥90°F today · 19 d/yr by 30 yrs out
- Wind 1/10 Low
- Air quality 2/10 Low 0 unhealthy d/yr today · 1 by 30 yrs out
Nearby sold comps map
Loading sold comps map…
Walkable amenities ~0.75 mi
Loading nearby amenities…
Taxation est. · year 1
- Rental income
- $12,180
- − Mortgage interest
- −$3,355
- − Property taxes
- −$898
- − Insurance
- −$1,097
- − Repairs & maintenance
- −$974
- − Management
- −$974
- − Depreciation
- −$1,743
- Taxable income
- $3,138
- Est. tax owed @ 24.0%
- −$753
- After-tax cash flow
- $3,104/yr
For passive investors: Depreciation is non-cash, so a rental often shows a tax loss while cash-flowing — sheltering income. Rental losses are passive: they offset passive income freely, and up to $25,000/yr can offset ordinary (W-2) income if you actively participate and your MAGI is under $100k (phasing out to $0 by $150k); unused losses carry forward. On sale, claimed depreciation is recaptured at up to 25%, and gains may owe capital-gains tax (a 1031 exchange can defer both). Figures are a year-1 estimate at your 24.0% rate — not tax advice; consult a CPA.
Condition & rehab AI · 2 photos
This 2008 single-wide manufactured home in Arcade Valley Estates is well-maintained and ready for a new owner. Fresh paint and landscaping would further enhance its curb appeal and value.
Value-add opportunities
- Resale Paint exterior siding — Fresh paint enhances curb appeal and home value
- Both Landscaping — Improved landscaping can increase both resale and rental value
Renovation cost estimate screening
Value-add ROI direction
- Resale Paint exterior siding — Fresh paint enhances curb appeal and home value ↑
- Both Landscaping — Improved landscaping can increase both resale and rental value ↑
ⓘ Cost ranges are severity-bucket heuristics (US national rule-of-thumb). Get contractor quotes + a written scope before underwriting a rehab budget.
Schools (NCES district)
- District
- Yorkshire-Pioneer Central School District
- NCES district ID
- 3608970
- Math proficiency
- 50% ▼ -17.00%
- Reading proficiency
- 54% ▼ -1.00%
- Median HH income
- $45,735
- Composite
- 44.02/100
- National rank
- #2885
- State rank
- #358 of 590 in NY
Livability — Arcade
- Score
- 64/100
- State rank
- #774
- US rank
- #14787
Category grades
Schools grade is shown separately in the Schools card above.
Census & demographics
- Population (ZIP)
- 5,787
Population outlook (Wyoming County) Hauer SSP2
- Today (2025)
- 38,976 people
- By 2030
- 37,826 · -3.0%
- By 2040
- 35,585 · -8.7%
- By 2050
- 32,841 · -15.7%
- By 2075
- 25,920 · -33.5%
- By 2100
- 19,082 · -51.0%
Race, ethnicity, and origin ACS 2023
- Neighborhood character
- Predominantly White (94%)
- Race & ethnicity
- White 94% Two or more races 3% Asian 2%
- Common ancestry
- Romanian 9% Iranian 2% Subsaharan African 1%
- Foreign-born
- 2% · Canada
- Languages at home
- 96% English-only · Tagalog/Filipino 2% Other Asian/Pacific 1%
Political lean MEDSL · Wyoming
- 2024 margin
- Solid R (+48.2) · D 25.9% · R 74.1%
- 2008→2024 swing
- -22.1pp toward R · 2008: -26.1pp · 2024: -48.2pp
- All cycles
- 2024: R+48.2 2020: R+45.5 2016: R+51.0 2012: R+29.6 2008: R+26.1
Not yet ingested
- Civics
- —
Market trends
- HPI YoY
- ▲ 5.65%
- Current HPI
- 281.8451
- Rent YoY
- —
- Metro
- —
- State GDP YoY
- ▲ 2.60%
- F500 in state
- 92
Industry mix (Fortune 500 HQ in NY)
| Industry | F500 HQs | Revenue |
|---|---|---|
| Financial Services | 10 | $950B |
|
||
| Consumer Goods | 9 | $162B |
|
||
| Insurance | 4 | $225B |
|
||
| Telecommunications | 2 | $144B |
|
||
| Pharmaceuticals | 2 | $112B |
|
||
| Media / Entertainment | 2 | $69B |
|
||
Price history
+16.9% since first listed3 events — show timeline
- 2026-05-25 Sold (MLS) $70,000 WNYREIS
- 2026-05-06 Pending — WNYREIS
- 2026-04-26 Listed $59,900 WNYREIS
Cash-flow waterfall
monthlySold comps — $/sqft
last 12 mo · ≤1 miLoading sold comps…