2500 E Harmony Rd #149 · Fort Collins, CO
Flood risk 1/10 · Minimal
- FEMA flood zone
- X (unshaded)
- Chance of flooding over 30 yrs
- 0.0%
- Est. flood insurance / yr
- $507 – $1,088
Fire risk 5/10 · Moderate
- Est. fire insurance / yr
- $939 – $1,743
Heat risk 3/10 · Minor
- Hot days now (above 92°F)
- 7 days/yr
- Hot days in 30 yrs
- 18 days/yr
Wind risk 1/10 · Minimal
- Chance of severe wind over 30 yrs
- —
Air-quality risk 6/10 · Moderate
- Unhealthy air days now
- 11 days/yr
- Unhealthy air days in 30 yrs
- 12 days/yr
Risk factors via First Street. Map © Google.
Why this score? — see what drove the A- grade
The composite is a weighted blend of 9 inputs, each scored 0–100. Each bar is that input's sub-score; the figure is the points it added to the 100-point composite (weight × sub-score).
- Cash flow +30.0/30.0
- ARV discount +11.6/15.0
- 1% rule +10.0/10.0
- DSCR +10.0/10.0
- Schools +4.5/10.0
- Appreciation +4.3/10.0
- Livability +4.0/5.0
- Rent growth +3.4/5.0
- Condition / age +2.5/5.0
$68,250
🖨 Deal sheet 📄 Offer letter ✓ Due diligence
Listing remarks
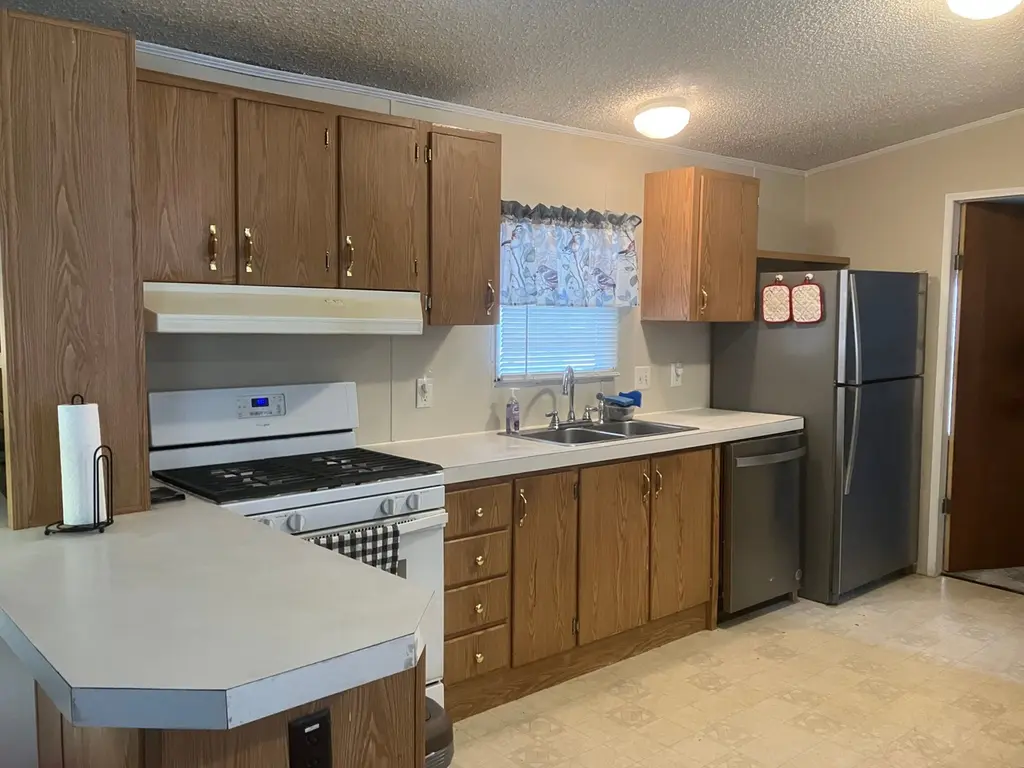
* THIS IS A RESALE LISTING * You'll love living in this 3 bedroom, 2 bathroom home within a wonderful family-friendly community. Check out the awesome amenities your community has to offer such as community events, scenic views, a playground, and more! This home won't be on the market long, so call us today for more information or to schedule a tour. Deposits & Fees are subject to change.
Key facts
- Built 2026
- Listed 80 days
Property features AI
Finance
- Other: Listing status: Active
- Financial info: List price $68,250
Exterior
- Utilities: Natural gas heating; Central air conditioning
- Home design: Spec new construction (Plan 93022); Located at 2500 E Harmony Rd #149, Fort Collins, CO
- Exterior features: Living area approximately 1,120
Interior
- Bedrooms: Three bedrooms
- Bathrooms: Two bathrooms
- Heating & cooling: Natural gas heating; Central air conditioning
- Interior features: 2 total bathrooms; 3 bedrooms
Neighborhood map
What this means for you Summary
Snapshot
- This is a 3-bed/2.0-bath manufactured listed at $68k.
Deal economics
- At list price, monthly cash flow is $1k ($16k/yr) — positive.
- The deal already cash-flows at list — no discount required.
- Meets the 1% rule at list price ($2k rent vs $68k).
- Recommended offer: $64k (6.0% below list) — sets the bar for market timing.
- Cap rate 29.9% vs local median 2.6% in Fort Collins — top-decile yield for the area; either an underpriced asset or a hidden risk that comps aren't pricing in. Stress-test before assuming the spread holds.
Location & tenants
- Location reads 80/100 on livability (#11 in CO, #1,750 nationally) — a professional / high-income tenant draw. Strengths: amenities A+, commute A+, health & safety A+; Watch: cost of living F.
- Poudre School District R-1 (urban): math 45% / reading 60% proficiency, ranked #10 of 86 in CO (top 12%) — acceptable for families but not a draw, mixed tenant base, ~2y average lease.
- Market conditions: Rents rising (+3.6%/yr); 189 active listings in the ZIP; 8 comparable units currently listed for rent nearby; rentals leasing fast (median 14d on market — plan ~1-2 weeks tenant-placement turnaround); high-income renter base; 1,786 units permitted in Larimer County in 2024 (402 in 5+ unit buildings).
Forward outlook
- Local home prices are declining (-1.4%/yr); year-one equity from $472 of loan paydown is wiped out by about $966 of value loss. Plan a longer hold.
- Larimer County population projected at +51% by 2050 — long-run rental-demand tailwind backs the buy-and-hold thesis.
- At projected returns (-1.4% appreciation + 3.6% rent growth), your $19k cash investment doubles in ~2 years — after that, you're playing with house money.
Negotiation context
- It's been on market 81 days — a 6% lower offer ($64k) is reasonable based on typical stale-listing flexibility.
Risks & watch-outs
- Climate carrying-cost: moderate wildfire risk — expect insurance premiums to compound above CPI over the hold.
Questions for the listing agent
- It's been on market 81 days. Have you received any prior offers? Is the seller open to a 6% concession, seller financing, or rate buy-down credit?
- Why hasn't it sold? Are there any deal-killer items the seller is aware of (foundation, flood, title, zoning, code violations)?
- Is there a deadline driving the sale (1031 exchange, divorce, estate, relocation)? That informs how much negotiation room exists.
- Schools are B-rated — typically a magnet for longer-tenancy family renters. What's the average tenant stay here, and is there a school-zone premium baked into asking?
- What's the average days-on-market for RENTAL listings here right now (not sales)? A rising rental-DOM trend means longer vacancies and softer asking-rent achievability than the comps imply.
- What's the recent tenant-quality profile in this submarket — average credit score on applications, eviction rate, late-payment / NSF rate, and stable-employment percentage? A property-management company in the area should have these aggregated.
- How much new for-sale + rental construction is in the pipeline within 1–3 miles? Heavy new supply typically softens prices + rents 12–24 months out; constrained supply supports both.
Investment metrics
- 1% rule
- 3.36% ✓
- Cap rate
- 29.86%
- Cash-on-cash
- 84.17%
- DSCR
- 4.75
- GRM
- 2.5
CMA / ARV
- ARV (on-the-fly)
- $75,040
- Comps found
- 7
Show comp detail 7 sales within ~0.75 mi
| Address | Dist | Beds/Ba | Sqft | Sold | Price | $/sf | Match |
|---|---|---|---|---|---|---|---|
| 2500 E Harmony Rd #166 | 0.00mi | 3/2.0 | 1,186 (+6%) | 5mo | $48,000 | $40 | 86 |
| 2500 E Harmony Rd #269 | 0.00mi | 3/2.0 | 1,232 (+10%) | 3mo | $82,000 | $67 | 81 |
| 2500 E Harmony Rd #439 | 0.00mi | 3/2.0 | 1,248 (+11%) | 2mo | $105,000 | $84 | 80 |
| 2500 E Harmony Rd #293 | 0.00mi | 3/2.0 | 1,241 (+11%) | 8mo | $75,000 | $60 | 76 |
| 2500 E Harmony Rd #281 | 0.00mi | 3/2.0 | 1,152 (+3%) | 24mo | $65,000 | $56 | 76 |
| 2500 E Harmony Rd #484 | 0.00mi | 3/2.0 | 1,216 (+9%) | 14mo | $105,000 | $86 | 74 |
| 2500 E Harmony Rd #104 | 0.00mi | 3/2.0 | 1,038 (-7%) | 22mo | $81,000 | $78 | 69 |
Match score weights: distance 35% · size 25% · config 20% · recency 20%. Top-matched comps best support the ARV.
Projected returns pro-forma
-1.42% appreciation · 3.6% rent growth · sell at horizon
- IRR
- 86.2%
- Equity multiple
- 5.21×
- Total profit
- $80,392
- Equity at exit
- $15,122
- IRR
- 88.6%
- Equity multiple
- 10.95×
- Total profit
- $190,138
- Equity at exit
- $14,753
Cash invested: $19,110 (down + closing). Projections, not guarantees.
Landlord ↔ Tenant lean methodology
- Overall (STATE)
- 38 Tenant-Leaning
- State Colorado
- 38 Tenant-Leaning · D+4
- County
- — inherits STATE
- City
- — inherits STATE
ZIP-level market 80528
- Home prices YoY
- -0.6%
- Rents YoY
- 3.6%
- Active inventory
- 189
- Price-to-rent
- 2.5×
Monthly cashflow live
- Estimated rent
- $2,294 high interval (Pro) →
- Mortgage (P&I)
- −$358
- Tax est. 1.5%
- −$85 /mo · $1,024/yr
- Insurance
- −$28
- HOA
- −$0
- Vacancy / Maint / Mgmt
- −$482
- Net cashflow
- $1,340
Break-even live
UW: 25.0% down · 7.5% · 30yr · 1.5% tax · 5.0% vac · 8.0% maint · 8.0% mgmt
Financing live
Cash to close
- Down payment
- $17,062
- Closing costs
- $2,048
- Reserves months
- —
- Total cash needed
- —
Loan-product check · same deal, 3 products live
Conventional
25% down · 7.5% · 30yr
- Down + closing
- —
- Monthly P&I
- —
- Monthly cashflow
- —
- DSCR
- —
- Eligible?
- —
Personal DTI + credit; lowest rate.
DSCR
20% down · 8.5% · 30yr
- Down + closing
- —
- Monthly P&I
- —
- Monthly cashflow
- —
- DSCR
- —
- Eligible?
- —
No personal income docs; deal must DSCR.
Hard money
10% down · 12.0% · 12mo
- Down + closing
- —
- Monthly P&I
- —
- Monthly cashflow
- —
- DSCR
- —
- Eligible?
- —
Short-term bridge; refi at stabilization.
Rent comps 8 comps
| Address | Beds | Baths | Sqft | Rent | $/sqft | DOM | Units | Dist |
|---|---|---|---|---|---|---|---|---|
| 2921 Timberwood Dr Fort Collins, CO | 2.0–3.0 | 2.0 | 1048 | $1,920 | $1.83 | 13d | 3 | 0.61mi |
| 2002 Battlecreek Dr Fort Collins, CO | 1.0–2.0 | 1.0–2.0 | 929 | $2,265 | $2.44 | 13d | 15 | 0.88mi |
| 5225 White Willow Dr Fort Collins, CO | 2.0 | 2.0 | 1003 | $1,940 | $1.93 | 13d | 1 | 1.00mi |
| 4545 Wheaton Dr Fort Collins, CO | 1.0–3.0 | 1.0–2.0 | 903 | $2,200 | $2.44 | 13d | 5 | 1.21mi |
| 1314 Armsley Ct Fort Collins, CO | 3.0 | 2.0 | 1248 | $2,400 | $1.92 | 23d | 1 | 1.22mi |
| 2212 Vermont Dr Fort Collins, CO | 1.0–2.0 | 1.0–2.0 | 852 | $2,089 | $2.45 | 13d | 7 | 1.31mi |
| 4470 S Lemay Ave Fort Collins, CO | 1.0–2.0 | 1.0–2.0 | 870 | $2,229 | $2.56 | 13d | 10 | 1.35mi |
| 3465 Lochwood Dr Unit J39 Fort Collins, CO | 2.0 | 1.5 | 1057 | $1,795 | $1.70 | 13d | 1 | 1.44mi |
Listing history 9 events
-
2026-06-10days on market $68,250 Active 81 DOM
-
2026-06-09days on market $68,250 Active 80 DOM
-
2026-06-08days on market $68,250 Active 79 DOM
-
2026-06-07days on market $68,250 Active 78 DOM
-
2026-06-03days on market $68,250 Active 74 DOM
-
2026-06-02days on market $68,250 Active 73 DOM
-
2026-06-01days on market $68,250 Active 72 DOM
-
2026-05-31days on market $68,250 Active 71 DOM
-
2026-05-30days on market $68,250 Active 70 DOM
ⓘ Source: listings_history table (triggers on properties + properties_extension) + one-shot
backfill from property_details.listing_events for pre-trigger history.
Climate risk First Street
- Flood 1/10 Low FEMA zone X (unshaded) · 0% chance over 30 yrs
- Wildfire 5/10 Major
- Heat 3/10 Moderate 7 d/yr ≥92°F today · 18 d/yr by 30 yrs out
- Wind 1/10 Low
- Air quality 6/10 Major 11 unhealthy d/yr today · 12 by 30 yrs out
Nearby sold comps map
Loading sold comps map…
Walkable amenities ~0.75 mi
Loading nearby amenities…
Taxation est. · year 1
- Rental income
- $27,526
- − Mortgage interest
- −$3,823
- − Property taxes
- −$1,024
- − Insurance
- −$341
- − Repairs & maintenance
- −$2,202
- − Management
- −$2,202
- − Depreciation
- −$1,985
- Taxable income
- $15,948
- Est. tax owed @ 24.0%
- −$3,828
- After-tax cash flow
- $12,258/yr
For passive investors: Depreciation is non-cash, so a rental often shows a tax loss while cash-flowing — sheltering income. Rental losses are passive: they offset passive income freely, and up to $25,000/yr can offset ordinary (W-2) income if you actively participate and your MAGI is under $100k (phasing out to $0 by $150k); unused losses carry forward. On sale, claimed depreciation is recaptured at up to 25%, and gains may owe capital-gains tax (a 1031 exchange can defer both). Figures are a year-1 estimate at your 24.0% rate — not tax advice; consult a CPA.
Schools (NCES district)
- District
- Poudre School District R-1
- NCES district ID
- 0803990
- Math proficiency
- 45% ▼ -7.00%
- Reading proficiency
- 60% ▼ -2.00%
- Median HH income
- $57,281
- Composite
- 45.5/100
- National rank
- #2610
- State rank
- #10 of 86 in CO
Livability — Fort Collins
- Score
- 80/100
- State rank
- #11
- US rank
- #1750
Category grades
Schools grade is shown separately in the Schools card above.
Census & demographics
- Census place
- Fort Collins, CO
- County
- Larimer County · 338,255 people
- City population
- 202,303
- Metro
- Fort Collins, CO
- Population (ZIP)
- 24,960
- Household income
- $130,350
- Rent vs Own
- Severe rent burden
- 378.0
Population outlook (Larimer County) Hauer SSP2
- Today (2025)
- 415,361 people
- By 2030
- 457,762 · +10.2%
- By 2040
- 542,310 · +30.6%
- By 2050
- 627,048 · +51.0%
- By 2075
- 833,722 · +100.7%
- By 2100
- 952,590 · +129.3%
Race, ethnicity, and origin ACS 2023
- Neighborhood character
- Predominantly White (73%)
- Race & ethnicity
- White 73% Hispanic / Latino 15% Two or more races 12% Asian 6% Black 2%
- Hispanic origin (detail)
- Mexican 10% Puerto Rican 2%
- Common ancestry
- Italian 4% Lithuanian 3% Romanian 3%
- Foreign-born
- 10% · Canada, China, South Korea
- Languages at home
- 86% English-only · Spanish 4% Other Indo-European 4% Chinese 1%
Political lean MEDSL · Larimer
- 2024 margin
- D (+17.6) · D 57.4% · R 39.8% · Other 2.9%
- 2008→2024 swing
- +7.9pp toward D · 2008: 9.7pp · 2024: 17.6pp
- All cycles
- 2024: D+17.6 2020: D+15.4 2016: D+4.9 2012: D+5.2 2008: D+9.7
Not yet ingested
- Civics
- —
Market trends
- HPI YoY
- ▼ -1.42%
- Current HPI
- 244.4061
- Rent YoY
- ▲ 3.60%
- Metro
- Fort Collins, CO
- State GDP YoY
- ▲ 1.95%
- F500 in state
- 14
Industry mix (Fortune 500 HQ in CO)
| Industry | F500 HQs | Revenue |
|---|---|---|
| Technology Distribution | 1 | $31B |
|
||
| Food / Agriculture | 1 | $18B |
|
||
| Packaging | 1 | $14B |
|
||
| Healthcare | 1 | $13B |
|
||
| Energy | 1 | $10B |
|
||
| Technology | 1 | $4B |
|
||
Cash-flow waterfall
monthlySold comps — $/sqft
last 12 mo · ≤1 miLoading sold comps…