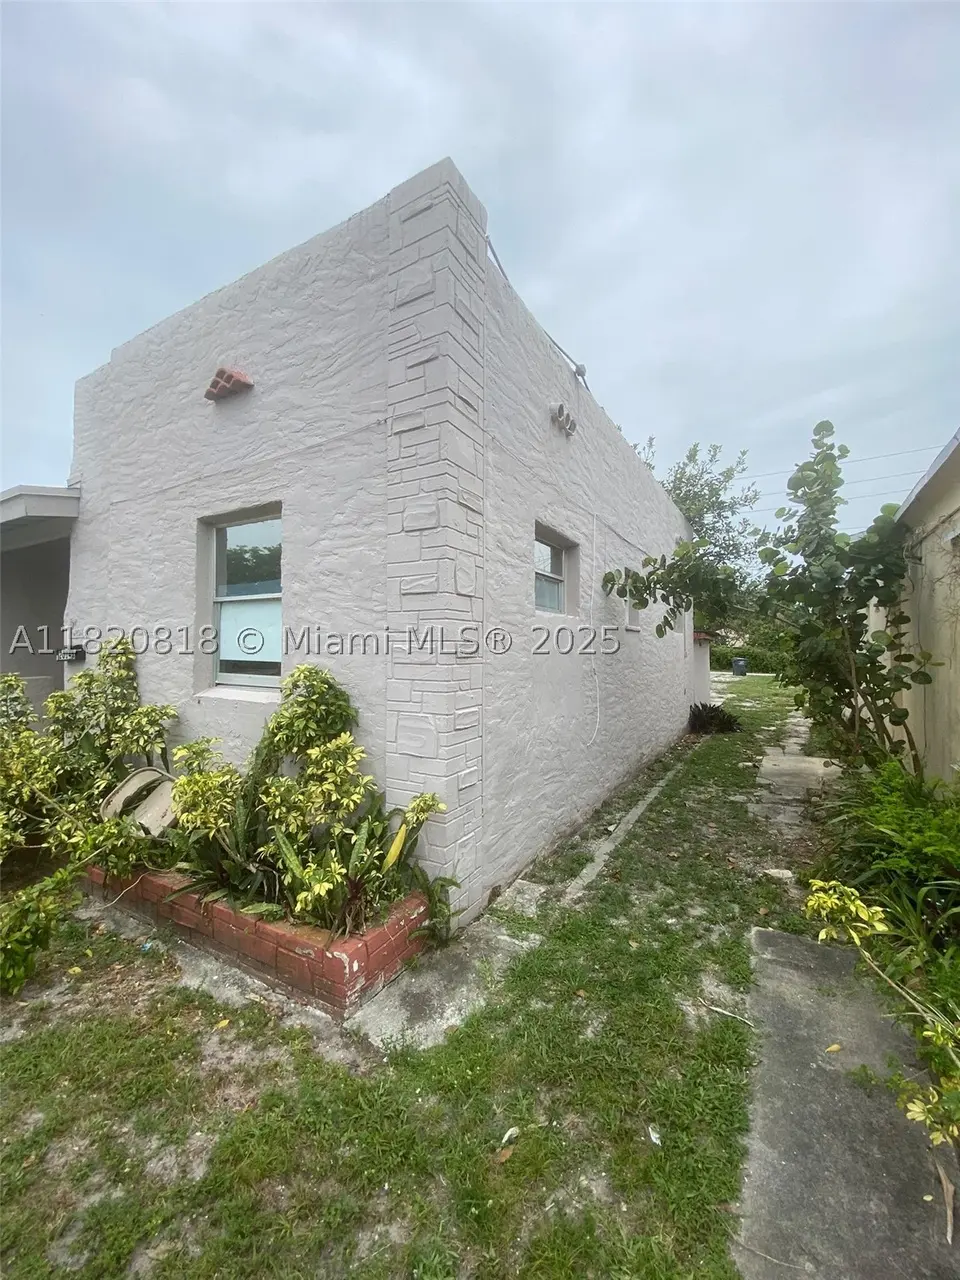
 Duplex
2014 Funston St · Hollywood, FL
Flood risk 5/10 · Moderate
- FEMA flood zone
- X (shaded)
- Chance of flooding over 30 yrs
- 0.48%
- Est. flood insurance / yr
- $507 – $1,088
Fire risk 1/10 · Minimal
- Est. fire insurance / yr
- $947 – $1,759
Heat risk 10/10 · Severe
- Hot days now (above 105°F)
- 7 days/yr
- Hot days in 30 yrs
- 26 days/yr
Wind risk 10/10 · Severe
- Chance of severe wind over 30 yrs
- 99.0%
Air-quality risk 2/10 · Minimal
- Unhealthy air days now
- 1 days/yr
- Unhealthy air days in 30 yrs
- 2 days/yr
Risk factors via First Street. Map © Google.
Why this score? — see what drove the D- grade
The composite is a weighted blend of 9 inputs, each scored 0–100. Each bar is that input's sub-score; the figure is the points it added to the 100-point composite (weight × sub-score).
- Cash flow +11.4/30.0
- ARV discount +7.5/15.0
- Schools +4.1/10.0
- Livability +3.8/5.0
- 1% rule +3.3/10.0
- DSCR +3.3/10.0
- Rent growth +2.6/5.0
- Condition / age +2.5/5.0
- Appreciation +0.0/10.0
$495,000
🖨 Deal sheet 📄 Offer letter ✓ Due diligence
Multi-family units
County records classify this as Multi-Family (2-4 Unit). Listing-text estimate: 2 units. confirmed
Listing remarks MLS
DUPLEX. FULL LEASED, EXCELLENT LOCATION. GREAT INCOME, GOOD TENANTS. DO NOT DISTURB OR TALK TO THE TENANTS.
Key facts
- Parking for 8 cars
- Duplex
- 8 parking spots
Tags
Property features AI
Finance
- Other: Annual tax listed (financial details excluded per instructions)
- Financial info: Rent includes electricity, gas, and hot water
Exterior
- Parking: 8 parking spaces
- Utilities: Public sewer; Cable not available
- Home design: Single-story; Flat roof; Block construction; Resale property
- Construction: Block construction; Flat roof; Built as resale (year built details listed as resale)
- Exterior features: Less than quarter-acre lot; Zoning: PS-1
Interior
- Flooring: Tile
- Heating & cooling: Central air
- Interior features: Tile flooring; Central air conditioning
Neighborhood map
What this means for you Summary
Snapshot
- This is a 2 × 1-bed/1.0-bath units multifamily listed at $495k.
Deal economics
- At list price, monthly cash flow is $-169 ($-2k/yr) — negative. Per door: $-85/mo.
- To cash-flow at today's rent, offer at most $471k (4.9% below list).
- To meet the 1% rule (rent ≥ 1% of price), the offer needs to be $412k (16.8% below list).
- Recommended offer: $412k (16.8% below list) — sets the bar for 1% rule.
- Cap rate 5.9% vs local median 3.2% in Hollywood — top-decile yield for the area; either an underpriced asset or a hidden risk that comps aren't pricing in. Stress-test before assuming the spread holds.
Location & tenants
- Location reads 76/100 on livability (#232 in FL, #3,548 nationally) — a middle-class / working-renter tenant base. Strengths: commute A+, housing A+, crime B+; Watch: amenities D.
- Broward (suburban): math 42% / reading 53% proficiency, ranked #46 of 73 in FL (top 63%) — families likely to look elsewhere, expect single-tenant / working-renter base with shorter leases.
- Market conditions: Rents flat; 589 active listings in the ZIP; 40 comparable units currently listed for rent nearby; rentals at typical pace (median 15d on market — plan ~3-4 weeks tenant-placement turnaround); 2,111 units permitted in Broward County in 2024 (1,265 in 5+ unit buildings).
- At $4,116/mo this rent would consume 87% of the median local household income ($56k/yr) (locally 3948% of renters already pay >50% of income on rent) — very limited rent-growth headroom before tenants either downsize or default.
Forward outlook
- Local home prices are declining (-3.0%/yr); year-one equity from $3k of loan paydown is wiped out by about $15k of value loss. Plan a longer hold.
- Broward County population projected at +34% by 2050 — long-run rental-demand tailwind backs the buy-and-hold thesis.
Negotiation context
- It's been on market 372 days — a 12% lower offer ($436k) is reasonable based on typical stale-listing flexibility.
- 3 sale attempts since 12y ago with the ask held roughly flat each time — persistent listings suggest the price (not the market) is what's stuck; bring a comps-based counter.
- Current owner paid $158k; list at $495k implies a 213% gain — meaningful room to come down on a strong offer.
Risks & watch-outs
- Watch-outs: built in 1930 — expect roof / HVAC / electrical / plumbing capex.
- Climate carrying-cost: moderate flood risk; severe wind risk, 99% chance of damaging wind over 30y; extreme-heat days projected 7→26/yr by 2055 (HVAC capex compounding) — expect insurance premiums to compound above CPI over the hold.
Questions for the listing agent
- What do current leases actually rent for vs. the listed asking? Can we see a recent rent roll and the last 12 months of T-12 income?
- It's been on market 372 days. Have you received any prior offers? Is the seller open to a 17% concession, seller financing, or rate buy-down credit?
- Can we see the unit-by-unit rent roll, current vacancy, and any below-market leases? What's the average tenancy length?
- What capital expenditures (roof, boiler, parking lot, exteriors) have been made in the last 5 years, and what's planned in the next 2?
- Built in 1930 — when were the roof, HVAC, electrical panel, plumbing, and water heater last replaced?
- Why hasn't it sold? Are there any deal-killer items the seller is aware of (foundation, flood, title, zoning, code violations)?
- Is there a deadline driving the sale (1031 exchange, divorce, estate, relocation)? That informs how much negotiation room exists.
- The area grade is low — what's the realistic commute time and amenity access for the typical tenant pool here? Any planned neighborhood developments (good or bad) we should know about?
- What's the average days-on-market for RENTAL listings here right now (not sales)? A rising rental-DOM trend means longer vacancies and softer asking-rent achievability than the comps imply.
- What's the recent tenant-quality profile in this submarket — average credit score on applications, eviction rate, late-payment / NSF rate, and stable-employment percentage? A property-management company in the area should have these aggregated.
- How much new apartment / multifamily construction is in the pipeline within 1–3 miles? Heavy new supply (>2% of stock underway) typically softens rents 12–24 months out; light construction supports rent growth.
Investment metrics
- 1% rule
- 0.83% ✗
- Cap rate
- 5.88%
- Cash-on-cash
- -1.46%
- DSCR
- 0.93
- GRM
- 10.0
CMA / ARV
No comps found within radius.
Projected returns pro-forma
-3.0% appreciation · 0.43% rent growth · sell at horizon
- IRR
- -21.6%
- Equity multiple
- 0.27×
- Total profit
- $-101,302
- Equity at exit
- $73,806
- IRR
- -23.0%
- Equity multiple
- -0.03×
- Total profit
- $-142,282
- Equity at exit
- $42,799
Cash invested: $138,600 (down + closing). Projections, not guarantees.
Landlord ↔ Tenant lean methodology
- Overall (STATE)
- 87 Strongly Landlord-Friendly
- State Florida
- 87 Strongly Landlord-Friendly · R+3
- County
- — inherits STATE
- City
- — inherits STATE
ZIP-level market 33020
- Rents YoY
- 0.4%
- Active inventory
- 589
- Price-to-rent
- 20.0×
Monthly cashflow live
- Estimated rent
- $4,116 high interval (Pro) →
- Mortgage (P&I)
- −$2,596
- Tax est. 1.5%
- −$619 /mo · $7,425/yr
- Insurance
- −$206
- HOA
- −$0
- Vacancy / Maint / Mgmt
- −$864
- Net cashflow
- $-169
Break-even live
2-unit breakdown (identical units grouped — click to expand)
| Units | Beds | Baths | Est. rent |
|---|---|---|---|
| 2× units | 1 | 1 | $4,116 |
| #1 | 1 | 1 | $2,058 |
| #2 | 1 | 1 | $2,058 |
| Total (2 units) | $4,116 | ||
UW: 25.0% down · 7.5% · 30yr · 1.5% tax · 5.0% vac · 8.0% maint · 8.0% mgmt
Financing live
Cash to close
- Down payment
- $123,750
- Closing costs
- $14,850
- Reserves months
- —
- Total cash needed
- —
Loan-product check · same deal, 3 products live
Conventional
25% down · 7.5% · 30yr
- Down + closing
- —
- Monthly P&I
- —
- Monthly cashflow
- —
- DSCR
- —
- Eligible?
- —
Personal DTI + credit; lowest rate.
DSCR
20% down · 8.5% · 30yr
- Down + closing
- —
- Monthly P&I
- —
- Monthly cashflow
- —
- DSCR
- —
- Eligible?
- —
No personal income docs; deal must DSCR.
Hard money
10% down · 12.0% · 12mo
- Down + closing
- —
- Monthly P&I
- —
- Monthly cashflow
- —
- DSCR
- —
- Eligible?
- —
Short-term bridge; refi at stabilization.
Rent comps 40 comps
| Address | Beds | Baths | Sqft | Rent | $/sqft | DOM | Units | Dist |
|---|---|---|---|---|---|---|---|---|
| 706 S 19th Ave Hollywood, FL | 3.0 | 2.0 | 1727 | $3,950 | $2.29 | 7d | 1 | 0.28mi |
| 706 S 19th Ave Unit 706 Hollywood, FL | 3.0 | 2.0 | 1727 | $4,350 | $2.52 | 17d | 1 | 0.28mi |
| 200 E Pembroke Rd Hallandale Beach, FL | 3.0 | 1.0–2.0 | 1006 | $3,480 | $3.46 | 1d | 62 | 0.39mi |
| 1938 Jackson St Hollywood, FL | 2.0 | 2.0 | 1170 | $3,600 | $3.08 | 24d | 1 | 0.44mi |
| 1715 Jefferson St Hollywood, FL | 3.0 | 2.0 | 1479 | $4,200 | $2.84 | 22d | 1 | 0.45mi |
| 2001 Van Buren St Hollywood, FL | 2.0 | 1.0–2.0 | 788 | $3,599 | $4.57 | 15d | 171 | 0.53mi |
| 320 S Federal Hwy Hollywood, FL | 2.0 | 1.0–2.0 | 742 | $3,616 | $4.87 | 24d | 9 | 0.53mi |
| 303 S Federal Hwy Hollywood, FL | 1.0–3.0 | 1.0–3.0 | 992 | $2,932 | $2.95 | 2d | 35 | 0.57mi |
| 1528 Wiley St Hollywood, FL | 2.0 | 1.0 | 1488 | $4,100 | $2.76 | 24d | 1 | 0.60mi |
| 1770 S Young Cir Hollywood, FL | 2.0 | 1.0–2.0 | 881 | $4,768 | $5.41 | 1d | 42 | 0.61mi |
| 2165 Van Buren St Hollywood, FL | 3.0 | 1.0–3.0 | 1072 | $3,609 | $3.37 | 1d | 14 | 0.63mi |
| 1818 Hollywood Blvd Hollywood, FL | 3.0 | 1.0–2.5 | 1089 | $4,135 | $3.80 | 1d | 17 | 0.65mi |
| 1720 Harrison St #1725 Hollywood, FL | 2.0 | 1.5 | 1320 | $4,400 | $3.33 | 10d | 1 | 0.66mi |
| 1001 NE 10th St Unit 2 Hallandale Beach, FL | 3.0 | 2.0 | 1270 | $3,600 | $2.83 | 24d | 1 | 0.66mi |
| 1720 Harrison St Unit 1523019P Hollywood, FL | 2.0 | 1.5 | 1313 | $5,129 | $3.91 | 3d | 1 | 0.67mi |
| 1639 Van Buren St Hollywood, FL | 3.0 | 3.0 | 1669 | $5,300 | $3.18 | 24d | 1 | 0.69mi |
| 2233 Hollywood Blvd Hollywood, FL | 1.0–2.0 | 1.0–2.0 | 913 | $3,515 | $3.85 | 15d | 94 | 0.73mi |
| 1403 Adams St Hollywood, FL | 3.0 | 2.0 | 1459 | $4,500 | $3.08 | 24d | 1 | 0.78mi |
| 1403 Adams St Unit 1403 Hollywood, FL | 3.0 | 2.0 | 1459 | $4,200 | $2.88 | 24d | 1 | 0.78mi |
| 1635 Hollywood Blvd Hollywood, FL | 3.0 | 2.0 | 1597 | $3,950 | $2.47 | 2d | 1 | 0.81mi |
| 1635 Hollywood Blvd Hollywood, FL | 3.0 | 2.0 | 1597 | $3,950 | $2.47 | 14d | 1 | 0.81mi |
| 1619 Hollywood Blvd Unit 1619 Hollywood, FL | 3.0 | 2.0 | 1827 | $4,600 | $2.52 | 7d | 1 | 0.82mi |
| 1619 Hollywood Blvd Hollywood, FL | 3.0 | 2.0 | 1827 | $4,600 | $2.52 | 24d | 1 | 0.82mi |
| 906 NE 6th St Hallandale Beach, FL | 3.0 | 2.0 | 1080 | $4,250 | $3.94 | 24d | 1 | 0.83mi |
| 906 NE 6th St Hallandale Beach, FL | 3.0 | 2.0 | 1080 | $4,250 | $3.94 | 5d | 1 | 0.83mi |
| 906 NE 6th St Hallandale Beach, FL | 3.0 | 2.0 | 1080 | $4,250 | $3.94 | 12d | 1 | 0.83mi |
| 1776 Polk St Hollywood, FL | 1.0–2.0 | 1.0–2.0 | 954 | $3,598 | $3.77 | 15d | 25 | 0.83mi |
| 1912 Taylor St Hollywood, FL | 2.0 | 2.0 | 1440 | $3,500 | $2.43 | 24d | 1 | 0.83mi |
| 2648 Washington St Hollywood, FL | 2.0 | 1.0 | 1193 | $2,800 | $2.35 | 24d | 1 | 0.86mi |
| 401 N Federal Hwy Hallandale Beach, FL | 1.0–3.0 | 1.0–2.0 | 973 | $2,765 | $2.84 | 15d | 48 | 0.87mi |
| 1124 NE 7th St Hallandale Beach, FL | 3.0 | 2.0 | 1320 | $3,900 | $2.95 | 22d | 1 | 0.89mi |
| 1313 Madison St Hollywood, FL | 2.0 | 2.0 | 1740 | $4,900 | $2.82 | 24d | 1 | 0.94mi |
| 841 NW 10th St Unit 841C Hallandale Beach, FL | 3.0 | 2.0 | 1585 | $3,200 | $2.02 | 20d | 1 | 0.96mi |
| 841 NW 10th St Hallandale Beach, FL | 3.0 | 2.0 | 1485 | $3,100 | $2.09 | 7d | 1 | 0.96mi |
| 2740 Dewey St Hollywood, FL | 3.0 | 1.0 | 1191 | $2,900 | $2.43 | 12d | 1 | 0.97mi |
| 1239 Washington St Unit 1239 Hollywood, FL | 3.0 | 2.0 | 1721 | $5,600 | $3.25 | 20d | 1 | 0.98mi |
| 2750 Washington St Hollywood, FL | 2.0 | 1.0 | 1053 | $3,300 | $3.13 | 2d | 1 | 0.99mi |
| 2750 Washington St Hollywood, FL | 2.0 | 1.0 | 1053 | $3,500 | $3.32 | 14d | 1 | 0.99mi |
| 852 NW 8th St #852 Hallandale Beach, FL | 3.0 | 2.0 | 1170 | $2,800 | $2.39 | 22d | 1 | 1.03mi |
| 1229 Jefferson St Hollywood, FL | 3.0 | 2.0 | 1861 | $5,400 | $2.90 | 24d | 1 | 1.03mi |
Listing history 23 events
-
2026-06-18days on market $495,000 Active 372 DOM
-
2026-06-17days on market $495,000 Active 371 DOM
-
2026-06-16days on market $495,000 Active 370 DOM
-
2026-06-15days on market $495,000 Active 369 DOM
-
2026-06-13days on market $495,000 Active 367 DOM
-
2026-06-09days on market $495,000 Active 363 DOM
-
2026-06-07days on market $495,000 Active 361 DOM
-
2026-06-04days on market $495,000 Active 358 DOM
-
2026-06-03days on market $495,000 Active 357 DOM
-
2026-06-02days on market $495,000 Active 356 DOM
-
2026-06-01days on market $495,000 Active 355 DOM
-
2026-05-31days on market $495,000 Active 354 DOM
-
2025-06-11$495,000 Active
-
2016-04-01soldstatus $158,000 Sold 107-char remark
Show marketing remark (107 chars)
DUPLEX. FULL LEASED, EXCELLENT LOCATION. GREAT INCOME, GOOD TENANTS. DO NOT DISTURB OR TALK TO THE TENANTS.
-
2015-12-20status Pending 107-char remark
Show marketing remark (107 chars)
DUPLEX. FULL LEASED, EXCELLENT LOCATION. GREAT INCOME, GOOD TENANTS. DO NOT DISTURB OR TALK TO THE TENANTS.
-
2015-07-15price $199,000 107-char remark
Show marketing remark (107 chars)
DUPLEX. FULL LEASED, EXCELLENT LOCATION. GREAT INCOME, GOOD TENANTS. DO NOT DISTURB OR TALK TO THE TENANTS.
-
2015-03-18$220,000 Active 107-char remark
Show marketing remark (107 chars)
DUPLEX. FULL LEASED, EXCELLENT LOCATION. GREAT INCOME, GOOD TENANTS. DO NOT DISTURB OR TALK TO THE TENANTS.
-
2014-08-04historical
-
2014-06-24price $255,000
-
2014-05-28$289,000 Active
-
2013-10-23soldstatus $135,000 Sold
-
2013-08-28price $150,000
-
2013-08-07price $165,000
ⓘ Source: listings_history table (triggers on properties + properties_extension) + one-shot
backfill from property_details.listing_events for pre-trigger history.
Climate risk First Street
- Flood 5/10 Major FEMA zone X (shaded) · 48% chance over 30 yrs
- Wildfire 1/10 Low
- Heat 10/10 Extreme 7 d/yr ≥105°F today · 26 d/yr by 30 yrs out
- Wind 10/10 Extreme 99% chance of damaging wind over 30 yrs
- Air quality 2/10 Low 1 unhealthy d/yr today · 2 by 30 yrs out
Nearby sold comps map
Loading sold comps map…
Walkable amenities ~0.75 mi
Loading nearby amenities…
Taxation est. · year 1
- Rental income
- $49,392
- − Mortgage interest
- −$27,728
- − Property taxes
- −$7,425
- − Insurance
- −$2,475
- − Repairs & maintenance
- −$3,951
- − Management
- −$3,951
- − Depreciation
- −$14,400
- Taxable loss
- −$10,538
- Est. tax savings @ 24.0%
- +$2,529
- After-tax cash flow
- $499/yr
For passive investors: Depreciation is non-cash, so a rental often shows a tax loss while cash-flowing — sheltering income. Rental losses are passive: they offset passive income freely, and up to $25,000/yr can offset ordinary (W-2) income if you actively participate and your MAGI is under $100k (phasing out to $0 by $150k); unused losses carry forward. On sale, claimed depreciation is recaptured at up to 25%, and gains may owe capital-gains tax (a 1031 exchange can defer both). Figures are a year-1 estimate at your 24.0% rate — not tax advice; consult a CPA.
Schools (NCES district)
- District
- Broward
- NCES district ID
- 1200180
- Math proficiency
- 42% ▼ -18.00%
- Reading proficiency
- 53% ▼ -5.00%
- Median HH income
- $52,139
- Composite
- 40.88/100
- National rank
- #3621
- State rank
- #46 of 73 in FL
Livability — Hollywood
- Score
- 76/100
- State rank
- #232
- US rank
- #3548
Category grades
Schools grade is shown separately in the Schools card above.
Census & demographics
- Census place
- Hollywood, FL
- County
- Broward County · 1,963,430 people
- City population
- 109,079
- Metro
- Miami-Fort Lauderdale-Pompano Beach, FL
- Population (ZIP)
- 46,322
- Household income
- $56,473
- Rent vs Own
- Severe rent burden
- 3948.0
Population outlook (Broward County) Hauer SSP2
- Today (2025)
- 2,207,033 people
- By 2030
- 2,360,704 · +7.0%
- By 2040
- 2,661,208 · +20.6%
- By 2050
- 2,946,698 · +33.5%
- By 2075
- 3,602,273 · +63.2%
- By 2100
- 3,970,984 · +79.9%
Race, ethnicity, and origin ACS 2023
- Neighborhood character
- Diverse neighborhood (Simpson 0.68)
- Race & ethnicity
- Hispanic / Latino 43% Two or more races 31% White 28% Black 24% Asian 1%
- Hispanic origin (detail)
- Mexican 1% Puerto Rican 4% Cuban 9% Dominican 3% Salvadoran 3%
- Common ancestry
- Hispanic 5% Lithuanian 2% Scotch-Irish 1%
- Foreign-born
- 41% · Canada, Jamaica, Dominican Republic
- Languages at home
- 48% English-only · Spanish 38% French/Haitian/Cajun 6% Russian/Polish/Slavic 2%
Political lean MEDSL · Broward
- 2024 margin
- D (+17.0) · D 58.0% · R 41.0%
- 2008→2024 swing
- -17.8pp toward R · 2008: 34.7pp · 2024: 17.0pp
- All cycles
- 2024: D+17.0 2020: D+29.8 2016: D+35.0 2012: D+34.9 2008: D+34.7
Not yet ingested
- Civics
- —
Market trends
- HPI YoY
- ▼ -406.34%
- Current HPI
- 524.7664
- Rent YoY
- ▲ 0.43%
- Metro
- Miami-Fort Lauderdale-Pompano Beach, FL
- State GDP YoY
- ▲ 3.28%
- F500 in state
- 36
Industry mix (Fortune 500 HQ in FL)
| Industry | F500 HQs | Revenue |
|---|---|---|
| Industrial Technology | 2 | $29B |
|
||
| Insurance | 2 | $17B |
|
||
| Retail | 1 | $60B |
|
||
| Technology Distribution | 1 | $58B |
|
||
| Homebuilding | 1 | $35B |
|
||
| Technology Manufacturing | 1 | $35B |
|
||
Price history
+200.0% since first listed11 events — show timeline
- 2025-06-11 Listed $495,000 MARMLS
- 2016-04-01 Sold (MLS) $158,000 MARMLS
- 2015-12-20 Pending — MARMLS
- 2015-07-15 Price Changed $199,000 MARMLS
- 2015-03-18 Listed $220,000 MARMLS
- 2014-08-04 Listing Removed — MARMLS
- 2014-06-24 Price Changed $255,000 MARMLS
- 2014-05-28 Listed $289,000 MARMLS
- 2013-10-23 Sold (MLS) $135,000 MARMLS
- 2013-08-28 Price Changed $150,000 MARMLS
- 2013-08-07 Price Changed $165,000 MARMLS
Cash-flow waterfall
monthlySold comps — $/sqft
last 12 mo · ≤1 miLoading sold comps…