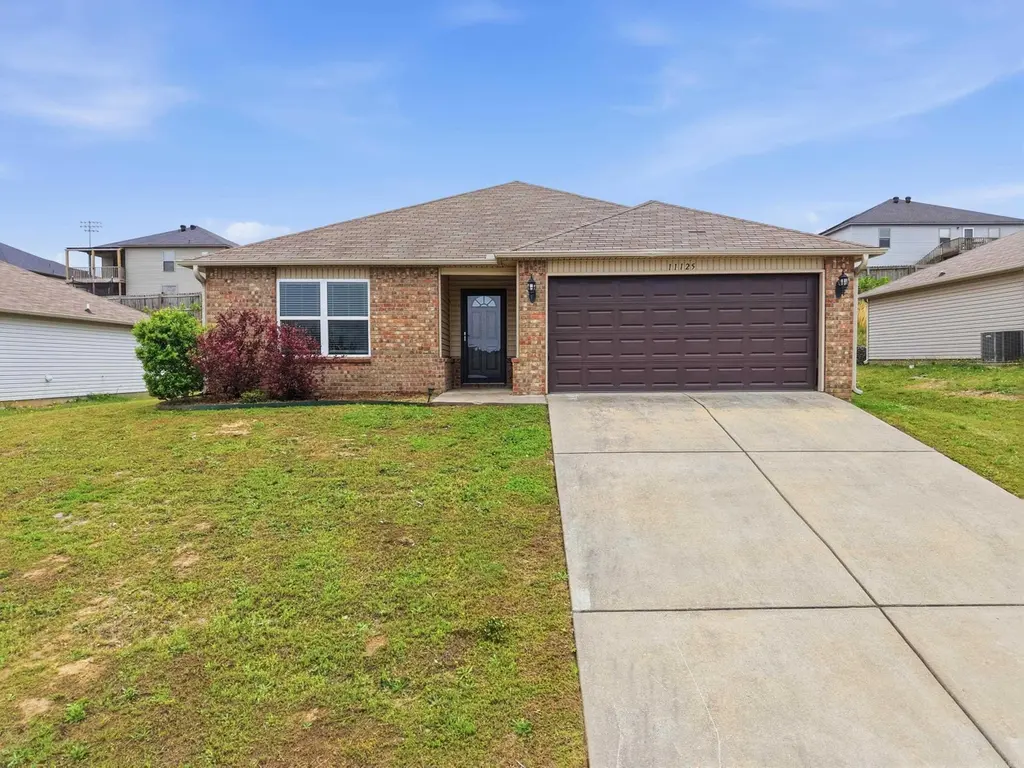
11125 Bock Rd · Sherwood, AR
Flood risk 1/10 · Minimal
- FEMA flood zone
- X (unshaded)
- Chance of flooding over 30 yrs
- 0.0%
- Est. flood insurance / yr
- $507 – $1,088
Fire risk 4/10 · Minor
- Est. fire insurance / yr
- $1,499 – $2,785
Heat risk 7/10 · Major
- Hot days now (above 112°F)
- 7 days/yr
- Hot days in 30 yrs
- 18 days/yr
Wind risk 4/10 · Minor
- Chance of severe wind over 30 yrs
- 10.0%
Air-quality risk 2/10 · Minimal
- Unhealthy air days now
- 2 days/yr
- Unhealthy air days in 30 yrs
- 2 days/yr
Risk factors via First Street. Map © Google.
Why this score? — see what drove the D- grade
The composite is a weighted blend of 9 inputs, each scored 0–100. Each bar is that input's sub-score; the figure is the points it added to the 100-point composite (weight × sub-score).
- Cash flow +12.5/30.0
- ARV discount +7.1/15.0
- DSCR +3.7/10.0
- Rent growth +3.7/5.0
- Livability +3.7/5.0
- 1% rule +3.0/10.0
- Schools +2.6/10.0
- Condition / age +2.5/5.0
- Appreciation +0.0/10.0
$219,900
🖨 Deal sheet (PDF) 📄 Offer letter ✓ Due diligence
Listing remarks MLS
Immaculate brick & siding 3 bed 2 bath in Sherwood! Close to Sylvan Hills High School and other great amenities. Beautiful kitchen with raised ceiling in the living area. Large walk-in closet in master bath! Agents please see remarks.
Key facts
- Great natural light
- Tall ceilings
- Large walk-in closet
Tags
Property features AI
Exterior
- Parking: 2-car garage
- Utilities: Public sewer; Public water; Municipal electric service (Entergy)
- Home design: Single-family property; Approximately 1,422 square feet; Approx. 0.21 acre lot
- Construction: Brick and metal/vinyl siding exterior; 3-tab shingle roof; Slab foundation
- Exterior features: Patio; Paved road access; Sloped lot; Inside city limits
Interior
- Kitchen: Free-standing stove; Microwave; Dishwasher; Garbage disposal; Refrigerator stays
- Flooring: Carpet; Tile
- Bathrooms: 2 full bathrooms
- Heating & cooling: Central electric heating; Central electric cooling
- Interior features: Vaulted ceilings; Carpet flooring; Tile flooring
- Laundry & utility: Laundry room
Neighborhood map
What this means for you Summary
Snapshot
- This is a 3-bed/2.0-bath single-family listed at $220k.
Deal economics
- At list price, monthly cash flow is $-33 ($-398/yr) — negative.
- To cash-flow at today's rent, offer at most $214k (2.7% below list).
- To meet the 1% rule (rent ≥ 1% of price), the offer needs to be $176k (20.0% below list).
- Recommended offer: $176k (20.0% below list) — sets the bar for 1% rule.
- Cap rate 6.1% vs local median 4.4% in Sherwood — top-decile yield for the area; either an underpriced asset or a hidden risk that comps aren't pricing in. Stress-test before assuming the spread holds.
Location & tenants
- Location reads 73/100 on livability (#19 in AR) — a middle-class / working-renter tenant base. Strengths: cost of living A+, housing A+, health & safety A+; Watch: crime F, amenities F, commute F.
- Pulaski County Spec. School District (rural): math 27% / reading 31% proficiency, ranked #150 of 238 in AR (top 63%) — low school quality limits family demand, transient renter base, plan for 1-2y turnover.
- Zoned schools: Sylvan Hills Elementary School (math 37% / reading 27%, grade F, #278 of 454 statewide, top 64%, 462 students, 47% FRL); Sylvan Hills Middle School (math 26% / reading 30%, grade F, #150 of 201 statewide, top 76%, 1,122 students, 52% FRL); Sylvan Hills High School (math 16% / reading 29%, grade F, #211 of 292 statewide, top 73%, 1,017 students, 38% FRL) — zoned schools at 46% FRL track the district average.
- Market conditions: Rents rising fast (+4.8%/yr); 249 active listings in the ZIP; 7 comparable units currently listed for rent nearby; rentals at typical pace (median 25d on market — plan ~3-4 weeks tenant-placement turnaround); solid renter incomes; 1,006 units permitted in Pulaski County in 2024 (0 in 5+ unit buildings).
Forward outlook
- Local home prices are declining (-3.0%/yr); year-one equity from $2k of loan paydown is wiped out by about $7k of value loss. Plan a longer hold.
- Pulaski County population projected at +6% by 2050 — modest demand growth; plan on rents tracking national, not racing it.
Negotiation context
- It's been on market 55 days — a 3% lower offer ($213k) is reasonable based on typical stale-listing flexibility.
- 5 sale attempts since 8y ago with the ask held roughly flat each time — persistent listings suggest the price (not the market) is what's stuck; bring a comps-based counter.
- Current owner paid $180k; 22% above their basis — modest negotiation headroom, anchor on the comps not their cost.
Risks & watch-outs
- Climate carrying-cost: extreme-heat days projected 7→18/yr by 2055 (HVAC capex compounding) — expect insurance premiums to compound above CPI over the hold.
Questions for the listing agent
- What do current leases actually rent for vs. the listed asking? Can we see a recent rent roll and the last 12 months of T-12 income?
- It's been on market 55 days. Have you received any prior offers? Is the seller open to a 20% concession, seller financing, or rate buy-down credit?
- Is there a deadline driving the sale (1031 exchange, divorce, estate, relocation)? That informs how much negotiation room exists.
- Crime grade is F in this area — have there been break-ins, vandalism, or insurance claims at this property in the last 3 years? What carrier currently insures it and at what premium?
- The area grade is low — what's the realistic commute time and amenity access for the typical tenant pool here? Any planned neighborhood developments (good or bad) we should know about?
- What's the average days-on-market for RENTAL listings here right now (not sales)? A rising rental-DOM trend means longer vacancies and softer asking-rent achievability than the comps imply.
- What's the recent tenant-quality profile in this submarket — average credit score on applications, eviction rate, late-payment / NSF rate, and stable-employment percentage? A property-management company in the area should have these aggregated.
- How much new for-sale + rental construction is in the pipeline within 1–3 miles? Heavy new supply typically softens prices + rents 12–24 months out; constrained supply supports both.
Investment metrics
- 1% rule
- 0.80% ✗
- Cap rate
- 6.11%
- Cash-on-cash
- -0.65%
- DSCR
- 0.97
- GRM
- 10.4
CMA / ARV
- ARV (median comp)
- $218,164
- List price
- $219,900
- Delta
- 0.80%
- Verdict
- FAIR
- Comps
- 20 within 1.0 mi
Show comp detail 12 sales within ~0.75 mi
| Address | Dist | Beds/Ba | Sqft | Sold | Price | $/sf | Match |
|---|---|---|---|---|---|---|---|
| 11016 Bock Rd | 0.07mi | 3/2.0 | 1,390 (-2%) | 8mo | $205,000 | $147 | 86 |
| 1908 Cub Trl | 0.12mi | 3/2.0 | 1,375 (-3%) | 7mo | $230,000 | $167 | 82 |
| 1909 Windridge | 0.20mi | 3/2.0 | 1,387 (-2%) | 7mo | $203,000 | $146 | 81 |
| 11609 Ridgetop Dr | 0.69mi | 3/2.0 | 1,421 (-0%) | 4mo | $230,000 | $162 | 64 |
| 201 Hillwood Dr | 0.49mi | 4/2.0 (+1) | 1,367 (-4%) | 4mo | $200,000 | $146 | 63 |
| 11640 Ridgetop Dr | 0.64mi | 3/2.0 | 1,357 (-5%) | 3mo | $217,500 | $160 | 60 |
| 519 Hillcrest Rd | 0.57mi | 3/2.0 | 1,312 (-8%) | 6mo | $130,000 | $99 | 56 |
| 11608 Ridgetop Dr | 0.66mi | 3/2.0 | 1,528 (+8%) | 3mo | $237,000 | $155 | 54 |
| 2520 Austin Oaks Dr | 0.45mi | 3/2.0 | 1,624 (+14%) | 7mo | $244,900 | $151 | 50 |
| 112 Robin Glen Dr | 0.72mi | 3/2.0 | 1,551 (+9%) | 9mo | $215,000 | $139 | 44 |
| 3018 Shady Side Dr | 0.65mi | 3/2.0 | 1,624 (+14%) | 3mo | $275,000 | $169 | 43 |
| 3013 Shady Side Dr | 0.68mi | 3/2.0 | 1,611 (+13%) | 8mo | $269,900 | $168 | 39 |
Match score weights: distance 35% · size 25% · config 20% · recency 20%. Top-matched comps best support the ARV.
Projected returns pro-forma
-3.0% appreciation · 4.81% rent growth · sell at horizon
- IRR
- -15.5%
- Equity multiple
- 0.44×
- Total profit
- $-34,516
- Equity at exit
- $32,788
- IRR
- -4.4%
- Equity multiple
- 0.69×
- Total profit
- $-19,024
- Equity at exit
- $19,013
Cash invested: $61,572 (down + closing). Projections, not guarantees.
Landlord ↔ Tenant lean methodology
- Overall (STATE)
- 92 Strongly Landlord-Friendly
- State Arkansas
- 92 Strongly Landlord-Friendly · R+14
- County
- — inherits STATE
- City
- — inherits STATE
ZIP-level market 72120
- Rents YoY
- 4.8%
- Active inventory
- 249
- Price-to-rent
- 10.4×
Monthly cashflow live
- Estimated rent
- $1,759 high interval (Pro) →
- Mortgage (P&I)
- −$1,153
- Tax from tax record
- −$178 /mo · $2,134/yr
- Insurance
- −$92
- HOA
- −$0
- Vacancy / Maint / Mgmt
- −$369
- Net cashflow
- $-33
Break-even live
Sensitivity live
| Price | -10% $91 | -5% $29 | +0% $-33 | +5% $-95 | +10% $-158 |
|---|---|---|---|---|---|
| Rent | -10% $-172 | -5% $-103 | +0% $-33 | +5% $36 | +10% $106 |
| Rate | -1.0pp $78 | -0.5pp $23 | base $-33 | +0.5pp $-90 | +1.0pp $-148 |
UW: 25.0% down · 7.5% · 30yr · 1.5% tax · 5.0% vac · 8.0% maint · 8.0% mgmt
Financing live
Cash to close
- Down payment
- $54,975
- Closing costs
- $6,597
- Reserves months
- —
- Total cash needed
- —
Loan-product check · same deal, 3 products live
Conventional
25% down · 7.5% · 30yr
- Down + closing
- —
- Monthly P&I
- —
- Monthly cashflow
- —
- DSCR
- —
- Eligible?
- —
Personal DTI + credit; lowest rate.
DSCR
20% down · 8.5% · 30yr
- Down + closing
- —
- Monthly P&I
- —
- Monthly cashflow
- —
- DSCR
- —
- Eligible?
- —
No personal income docs; deal must DSCR.
Hard money
10% down · 12.0% · 12mo
- Down + closing
- —
- Monthly P&I
- —
- Monthly cashflow
- —
- DSCR
- —
- Eligible?
- —
Short-term bridge; refi at stabilization.
Rent comps 7 comps
| Address | Beds | Baths | Sqft | Rent | $/sqft | DOM | Units | Dist |
|---|---|---|---|---|---|---|---|---|
| 10710 Windridge Dr Sherwood, AR | 3.0 | 2.0 | 1644 | $1,695 | $1.03 | 22d | 1 | 0.30mi |
| 3160 Shady Side Dr Sherwood, AR | 3.0 | 2.0 | 1792 | $1,900 | $1.06 | 20d | 1 | 0.65mi |
| 500 Oakdale Rd Sherwood, AR | 3.0 | 2.5 | 1499 | $1,750 | $1.17 | 45d | 1 | 0.94mi |
| 13 Wesley Dr Sherwood, AR | 4.0 | 2.0 | 1721 | $1,625 | $0.94 | 45d | 1 | 1.03mi |
| 23 Pamela Ln Sherwood, AR | 3.0 | 2.0 | 1400 | $2,000 | $1.43 | 25d | 1 | 1.04mi |
| 1201 Brice Rd Unit C Sherwood, AR | 2.0 | 1.0 | 1100 | $850 | $0.77 | 25d | 1 | 1.41mi |
| 8707 Oakhaven Dr Sherwood, AR | 3.0 | 2.0 | 1543 | $1,611 | $1.04 | 16d | 1 | 1.49mi |
Listing history 31 events
-
2026-06-21days on market $219,900 Active 55 DOM
-
2026-06-18days on market $219,900 Active 52 DOM
-
2026-06-17days on market $219,900 Active 51 DOM
-
2026-06-16days on market $219,900 Active 50 DOM
-
2026-06-15days on market $219,900 Active 49 DOM
-
2026-06-14days on market $219,900 Active 47 DOM
-
2026-06-13statusdays on market $219,900 Active 46 DOM
-
2026-06-10days on market $219,900 Price Change 44 DOM
-
2026-06-09days on market $219,900 Price Change 43 DOM
-
2026-06-08days on market $219,900 Price Change 42 DOM
-
2026-06-07days on market $219,900 Price Change 41 DOM
-
2026-06-05pricestatusdays on market $219,900 Price Change 38 DOM
-
2026-06-03days on market $230,000 Active 37 DOM
-
2026-06-02days on market $230,000 Active 36 DOM
-
2026-06-01days on market $230,000 Active 35 DOM
-
2026-05-31days on market $230,000 Active 34 DOM
-
2026-05-31days on market $230,000 Active 33 DOM
-
2026-04-27$230,000 New Listing 538-char remark
-
2024-03-20historical $1,550
-
2024-03-12historical $1,550
-
2024-02-08$1,550
-
2024-02-07$1,550
-
2021-12-06soldstatus $180,000
-
2021-11-30status Under Contract 240-char remark
Show marketing remark (240 chars)
Immaculate brick & siding 3 bed 2 bath in Sherwood! Close to Sylvan Hills High School and other great amenities. Beautiful kitchen with raised ceiling in the living area. Large walk-in closet in master bath! Agents please see remarks.
-
2021-11-23soldstatus $180,000 Sold 240-char remark
Show marketing remark (240 chars)
Immaculate brick & siding 3 bed 2 bath in Sherwood! Close to Sylvan Hills High School and other great amenities. Beautiful kitchen with raised ceiling in the living area. Large walk-in closet in master bath! Agents please see remarks.
-
2021-10-21historical Take Backups 240-char remark
Show marketing remark (240 chars)
Immaculate brick & siding 3 bed 2 bath in Sherwood! Close to Sylvan Hills High School and other great amenities. Beautiful kitchen with raised ceiling in the living area. Large walk-in closet in master bath! Agents please see remarks.
-
2021-10-16$174,000 New Listing 240-char remark
Show marketing remark (240 chars)
Immaculate brick & siding 3 bed 2 bath in Sherwood! Close to Sylvan Hills High School and other great amenities. Beautiful kitchen with raised ceiling in the living area. Large walk-in closet in master bath! Agents please see remarks.
-
2018-06-05soldstatus $140,860
-
2018-05-31soldstatus $140,680 Sold
Show marketing remark (127 chars)
Very nice 3BR, 2Bth, 2 car garage near Sylvan Hills High School, raised ceiling in living area, large walk in closet in Master.
-
2018-03-10$140,860
Show marketing remark (127 chars)
Very nice 3BR, 2Bth, 2 car garage near Sylvan Hills High School, raised ceiling in living area, large walk in closet in Master.
-
2018-03-10historical
Show marketing remark (127 chars)
Very nice 3BR, 2Bth, 2 car garage near Sylvan Hills High School, raised ceiling in living area, large walk in closet in Master.
ⓘ Source: listings_history table (triggers on properties + properties_extension) + one-shot
backfill from property_details.listing_events for pre-trigger history.
Tax reassessment forecast AR · Resets to sale price
- Current annual tax
- $2,134 · $178/mo
- Projected year-2 tax
- $2,134 · $178/mo
- Expected delta
- $0/yr ($0/mo · 0.0%)
ⓘ Screening estimate from a state-policy table — verify with the county assessor before closing.
Climate risk First Street
- Flood 1/10 Low FEMA zone X (unshaded) · 0% chance over 30 yrs
- Wildfire 4/10 Moderate
- Heat 7/10 Severe 7 d/yr ≥112°F today · 18 d/yr by 30 yrs out
- Wind 4/10 Moderate 10% chance of damaging wind over 30 yrs
- Air quality 2/10 Low 2 unhealthy d/yr today · 2 by 30 yrs out
Nearby sold comps map
Loading sold comps map…
Walkable amenities ~0.75 mi
Loading nearby amenities…
Taxation est. · year 1
- Rental income
- $21,106
- − Mortgage interest
- −$12,318
- − Property taxes
- −$2,134
- − Insurance
- −$1,100
- − Repairs & maintenance
- −$1,689
- − Management
- −$1,689
- − Depreciation
- −$6,397
- Taxable loss
- −$4,219
- Est. tax savings @ 24.0%
- +$1,013
- After-tax cash flow
- $615/yr
For passive investors: Depreciation is non-cash, so a rental often shows a tax loss while cash-flowing — sheltering income. Rental losses are passive: they offset passive income freely, and up to $25,000/yr can offset ordinary (W-2) income if you actively participate and your MAGI is under $100k (phasing out to $0 by $150k); unused losses carry forward. On sale, claimed depreciation is recaptured at up to 25%, and gains may owe capital-gains tax (a 1031 exchange can defer both). Figures are a year-1 estimate at your 24.0% rate — not tax advice; consult a CPA.
Schools (NCES district)
- District
- Pulaski County Spec. School District
- NCES district ID
- 0511850
- Math proficiency
- 27% ▼ -13.00%
- Reading proficiency
- 31% ▼ -10.00%
- Median HH income
- $53,218
- Composite
- 25.67/100
- National rank
- #7394
- State rank
- #150 of 238 in AR
Livability — Sherwood
- Score
- 73/100
- State rank
- #19
- US rank
- #5246
Category grades
Schools grade is shown separately in the Schools card above.
Census & demographics
- Census place
- Sherwood, AR
- County
- Pulaski County · 372,764 people
- City population
- 34,365
- Metro
- Little Rock-North Little Rock-Conway, AR
- Population (ZIP)
- 34,365
- Household income
- $76,598
- Rent vs Own
- Severe rent burden
- 774.0
Population outlook (Pulaski County) Hauer SSP2
- Today (2025)
- 415,378 people
- By 2030
- 423,720 · +2.0%
- By 2040
- 435,182 · +4.8%
- By 2050
- 440,904 · +6.1%
- By 2075
- 445,521 · +7.3%
- By 2100
- 419,173 · +0.9%
Race, ethnicity, and origin ACS 2023
- Neighborhood character
- Predominantly White (65%)
- Race & ethnicity
- White 65% Black 26% Two or more races 5% Hispanic / Latino 4% Asian 1%
- Common ancestry
- Lithuanian 2% Slovak 1% Italian 1%
- Foreign-born
- 2% · Canada, South Korea
- Languages at home
- 96% English-only · Spanish 2% Korean 1%
Political lean MEDSL · Pulaski
- 2024 margin
- Strong D (+22.1) · D 59.8% · R 37.7% · Other 2.5%
- 2008→2024 swing
- +10.6pp toward D · 2008: 11.6pp · 2024: 22.1pp
- All cycles
- 2024: D+22.1 2020: D+22.5 2016: D+17.9 2012: D+11.4 2008: D+11.6
Not yet ingested
- Civics
- —
Market trends
- HPI YoY
- ▼ -134.93%
- Current HPI
- 198.9456
- Rent YoY
- ▲ 4.81%
- Metro
- Little Rock-North Little Rock-Conway, AR
- State GDP YoY
- ▲ 3.80%
- F500 in state
- 10
Industry mix (Fortune 500 HQ in AR)
| Industry | F500 HQs | Revenue |
|---|---|---|
| Retail | 1 | $681B |
|
||
| Food / Agriculture | 1 | $53B |
|
||
| Retail / Energy | 1 | $22B |
|
||
| Transportation / Logistics | 1 | $12B |
|
||
| Energy | 1 | $4B |
|
||
Price history
+56.1% since first listed15 events — show timeline
- 2026-06-05 Price Changed $219,900 CARMLS
- 2026-04-27 Listed $230,000 CARMLS
- 2024-03-20 Rental Removed $1,550 RENT.
- 2024-03-12 Rental Removed $1,550 CARMLS
- 2024-02-08 Listed for Rent $1,550 RENT.
- 2024-02-07 Listed for Rent $1,550 CARMLS
- 2021-12-06 Sold (Public Records) $180,000 Public Records
- 2021-11-30 Pending — CARMLS
- 2021-11-23 Sold (MLS) $180,000 CARMLS
- 2021-10-21 Contingent — CARMLS
- 2021-10-16 Listed $174,000 CARMLS
- 2018-06-05 Sold (Public Records) $140,860 Public Records
- 2018-05-31 Sold (MLS) $140,680 CARMLS
- 2018-03-10 Listing Removed — CARMLS
- 2018-03-10 Listed $140,860 CARMLS
Property tax history
+29.5%/yrLatest (2025): $2,134 · +0.9% YoY. Source: county tax records.
Cash-flow waterfall
monthlySold comps — $/sqft
last 12 mo · ≤1 miLoading sold comps…