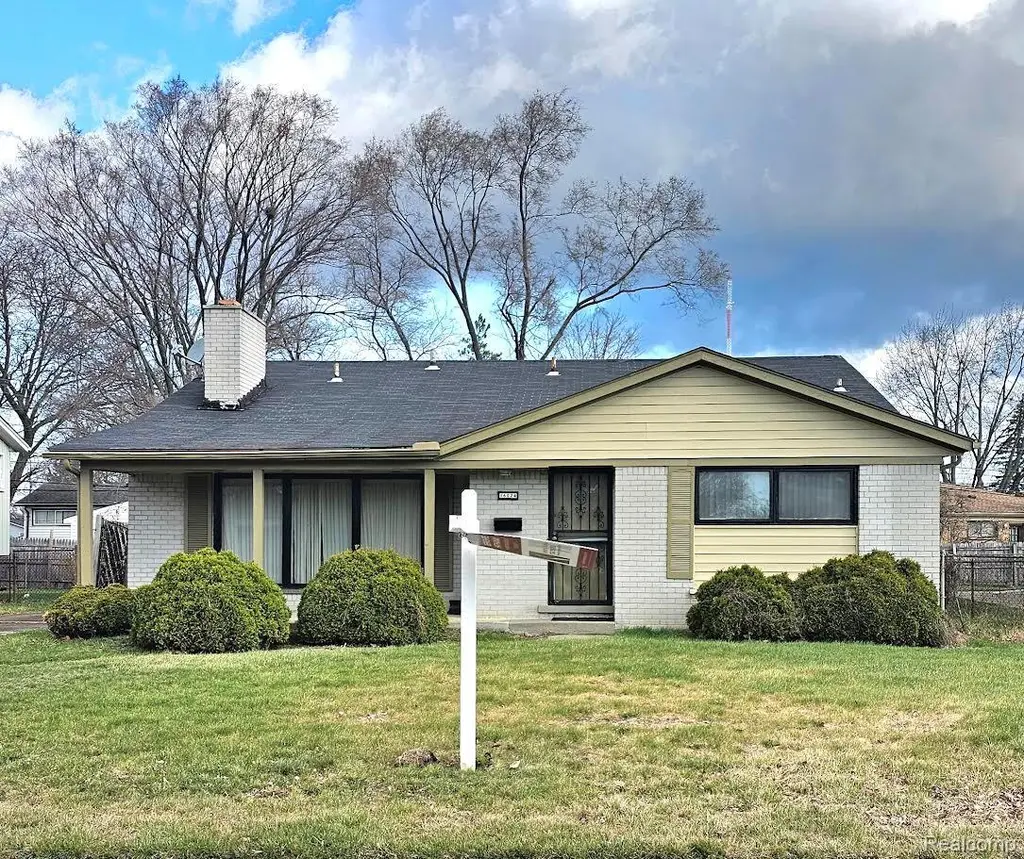
16024 Stratford Dr · Southfield, MI
Flood risk 1/10 · Minimal
- FEMA flood zone
- X (unshaded)
- Chance of flooding over 30 yrs
- 0.0%
- Est. flood insurance / yr
- $473 – $860
Fire risk 1/10 · Minimal
- Est. fire insurance / yr
- $784 – $1,456
Heat risk 3/10 · Minor
- Hot days now (above 97°F)
- 7 days/yr
- Hot days in 30 yrs
- 15 days/yr
Wind risk 2/10 · Minimal
- Chance of severe wind over 30 yrs
- —
Air-quality risk 4/10 · Minor
- Unhealthy air days now
- 3 days/yr
- Unhealthy air days in 30 yrs
- 6 days/yr
Risk factors via First Street. Map © Google.
Why this score? — see what drove the C- grade
The composite is a weighted blend of 9 inputs, each scored 0–100. Each bar is that input's sub-score; the figure is the points it added to the 100-point composite (weight × sub-score).
- Cash flow +16.0/30.0
- ARV discount +15.0/15.0
- DSCR +4.9/10.0
- 1% rule +4.5/10.0
- Rent growth +4.5/5.0
- Livability +3.6/5.0
- Condition / age +2.5/5.0
- Schools +2.4/10.0
- Appreciation +0.0/10.0
$224,900
🖨 Deal sheet (PDF) 📄 Offer letter ✓ Due diligence
Listing remarks MLS
Spacious 5BR, 2.1BA tri-level in desirable Southfield offering great sweat equity opportunity! Features include hardwood floors, living room with natural fireplace, formal dining room, and finished walkout lower level with wet bar. Ensuite primary bedroom with walk-in closet and private full bath. Built-in BBQ pit for outdoor entertaining. Newer furnace & A/C. Solid home with strong bones - just needs updates to make it shine! Great value for buyers looking to build equity.
Key facts
- Formal dining room
- Wet bar
- Natural fireplace
Tags
Property features AI
Exterior
- Parking: Detached garage; 2 garage spaces; Carport
- Utilities: Public water; Public sewer
- Home design: Single-family residential home; Ground-level entry
- Construction: Vinyl siding; Above-grade finished area and additional finished lower level
- Exterior features: Barbecue; Paved road access; Lot approximately 60 x 130 (0.18 acre)
Interior
- Bedrooms: Total rooms: 9
- Bathrooms: 2 full bathrooms; 1 half bathroom
- Heating & cooling: Forced air heating (natural gas); No central air
- Interior features: Wet bar; Wood-burning fireplace in family room; Finished daylight walk-out basement
Neighborhood map
What this means for you Summary
Snapshot
- This is a 4-bed/2.5-bath single-family listed at $225k.
Deal economics
- At list price, monthly cash flow is $111 ($1k/yr) — positive.
- The deal already cash-flows at list — no discount required.
- To meet the 1% rule (rent ≥ 1% of price), the offer needs to be $213k (5.1% below list).
- Recommended offer: $213k (5.1% below list) — sets the bar for 1% rule.
- Cap rate 6.9% vs local median 4.6% in Southfield — top-decile yield for the area; either an underpriced asset or a hidden risk that comps aren't pricing in. Stress-test before assuming the spread holds.
Location & tenants
- Location reads 72/100 on livability (#248 in MI) — a middle-class / working-renter tenant base. Strengths: commute A+, cost of living A+, housing A+; Watch: schools D, health & safety D, crime F.
- Southfield Public School District (urban): math 17% / reading 37% proficiency, ranked #392 of 540 in MI (top 73%) — low school quality limits family demand, transient renter base, plan for 1-2y turnover.
- Market conditions: Rents rising fast (+8.1%/yr); 95 active listings in the ZIP; 7 comparable units currently listed for rent nearby; rentals leasing fast (median 5d on market — plan ~1-2 weeks tenant-placement turnaround); 2,614 units permitted in Oakland County in 2024 (721 in 5+ unit buildings).
- This rent runs 39% of the median local income ($65k/yr) — at the standard rent-burdened threshold; future hikes will face affordability resistance.
Forward outlook
- Local home prices are declining (-3.0%/yr); year-one equity from $2k of loan paydown is wiped out by about $7k of value loss. Plan a longer hold.
- Oakland County population projected at +10% by 2050 — modest demand growth; plan on rents tracking national, not racing it.
Negotiation context
- It's been on market 48 days — a 3% lower offer ($218k) is reasonable based on typical stale-listing flexibility.
- 10 sale attempts since 30y ago with the ask held roughly flat each time — persistent listings suggest the price (not the market) is what's stuck; bring a comps-based counter.
- Current owner paid $40k; list at $225k implies a 455% gain — meaningful room to come down on a strong offer.
Risks & watch-outs
- Watch-outs: built in 1956 — expect roof / HVAC / electrical / plumbing capex.
Questions for the listing agent
- It's been on market 48 days. Have you received any prior offers? Is the seller open to a 5% concession, seller financing, or rate buy-down credit?
- Built in 1956 — when were the roof, HVAC, electrical panel, plumbing, and water heater last replaced?
- Is there a deadline driving the sale (1031 exchange, divorce, estate, relocation)? That informs how much negotiation room exists.
- Schools are D-rated, which usually means shorter tenancies and higher turnover. Who's the typical renter profile here, and what's been the actual vacancy rate?
- Crime grade is F in this area — have there been break-ins, vandalism, or insurance claims at this property in the last 3 years? What carrier currently insures it and at what premium?
- What's the average days-on-market for RENTAL listings here right now (not sales)? A rising rental-DOM trend means longer vacancies and softer asking-rent achievability than the comps imply.
- What's the recent tenant-quality profile in this submarket — average credit score on applications, eviction rate, late-payment / NSF rate, and stable-employment percentage? A property-management company in the area should have these aggregated.
- How much new for-sale + rental construction is in the pipeline within 1–3 miles? Heavy new supply typically softens prices + rents 12–24 months out; constrained supply supports both.
Investment metrics
- 1% rule
- 0.95% ✗
- Cap rate
- 6.89%
- Cash-on-cash
- 2.12%
- DSCR
- 1.09
- GRM
- 8.8
CMA / ARV
- ARV (median comp)
- $324,608
- List price
- $224,900
- Delta
- -30.72%
- Verdict
- UNDERPRICED
- Comps
- 20 within 1.0 mi
Show comp detail 12 sales within ~0.75 mi
| Address | Dist | Beds/Ba | Sqft | Sold | Price | $/sf | Match |
|---|---|---|---|---|---|---|---|
| 17239 New Jersey St | 0.47mi | 4/2.5 | 2,099 (+1%) | 4mo | $342,500 | $163 | 74 |
| 15120 Northfield Blvd | 0.43mi | 3/1.5 (-1) | 2,104 (+1%) | 10mo | $245,000 | $116 | 60 |
| 15918 Mount Vernon St | 0.26mi | 4/2.5 | 2,380 (+15%) | 6mo | $315,000 | $132 | 58 |
| 24044 NE Pierce St E | 0.31mi | 3/2.5 (-1) | 2,260 (+9%) | 11mo | $309,000 | $137 | 57 |
| 17090 Pennsylvania St | 0.40mi | 3/2.5 (-1) | 2,221 (+7%) | 12mo | $295,000 | $133 | 54 |
| 14561 Leslie St | 0.61mi | 3/2.0 (-1) | 2,177 (+5%) | 5mo | $182,000 | $84 | 52 |
| 17141 Maryland St | 0.43mi | 4/2.5 | 2,333 (+12%) | 9mo | $325,000 | $139 | 52 |
| 24241 Radclift St | 0.54mi | 3/2.5 (-1) | 2,154 (+4%) | 14mo | $272,000 | $126 | 52 |
| 17265 Bonstelle Ave | 0.67mi | 4/3.5 | 2,254 (+9%) | 2mo | $369,000 | $164 | 49 |
| 14530 Northfield Blvd | 0.61mi | 3/1.0 (-1) | 1,900 (-8%) | 3mo | $196,000 | $103 | 44 |
| 17380 Louise St | 0.65mi | 3/2.5 (-1) | 2,296 (+11%) | 9mo | $290,000 | $126 | 39 |
| 14530 Oak Park Blvd | 0.68mi | 3/1.5 (-1) | 2,204 (+6%) | 15mo | $259,000 | $118 | 37 |
Match score weights: distance 35% · size 25% · config 20% · recency 20%. Top-matched comps best support the ARV.
Projected returns pro-forma
-3.0% appreciation · 8.0% rent growth · sell at horizon
- IRR
- -7.4%
- Equity multiple
- 0.71×
- Total profit
- $-18,024
- Equity at exit
- $33,533
- IRR
- 7.7%
- Equity multiple
- 1.71×
- Total profit
- $44,966
- Equity at exit
- $19,445
Cash invested: $62,972 (down + closing). Projections, not guarantees.
Landlord ↔ Tenant lean methodology
- Overall (STATE)
- 62 Landlord-Friendly
- State Michigan
- 62 Landlord-Friendly · EVEN
- County
- — inherits STATE
- City
- — inherits STATE
ZIP-level market 48075
- Rents YoY
- 8.1%
- Active inventory
- 95
- Price-to-rent
- 8.8×
Monthly cashflow live
- Estimated rent
- $2,135 high interval (Pro) →
- Mortgage (P&I)
- −$1,179
- Tax from tax record
- −$302 /mo · $3,622/yr
- Insurance
- −$94
- HOA
- −$0
- Vacancy / Maint / Mgmt
- −$448
- Net cashflow
- $111
Break-even live
Sensitivity live
| Price | -10% $239 | -5% $175 | +0% $111 | +5% $48 | +10% $-16 |
|---|---|---|---|---|---|
| Rent | -10% $-57 | -5% $27 | +0% $111 | +5% $196 | +10% $280 |
| Rate | -1.0pp $225 | -0.5pp $169 | base $111 | +0.5pp $53 | +1.0pp $-6 |
UW: 25.0% down · 7.5% · 30yr · 1.5% tax · 5.0% vac · 8.0% maint · 8.0% mgmt
Financing live
Cash to close
- Down payment
- $56,225
- Closing costs
- $6,747
- Reserves months
- —
- Total cash needed
- —
Loan-product check · same deal, 3 products live
Conventional
25% down · 7.5% · 30yr
- Down + closing
- —
- Monthly P&I
- —
- Monthly cashflow
- —
- DSCR
- —
- Eligible?
- —
Personal DTI + credit; lowest rate.
DSCR
20% down · 8.5% · 30yr
- Down + closing
- —
- Monthly P&I
- —
- Monthly cashflow
- —
- DSCR
- —
- Eligible?
- —
No personal income docs; deal must DSCR.
Hard money
10% down · 12.0% · 12mo
- Down + closing
- —
- Monthly P&I
- —
- Monthly cashflow
- —
- DSCR
- —
- Eligible?
- —
Short-term bridge; refi at stabilization.
Rent comps 7 comps
| Address | Beds | Baths | Sqft | Rent | $/sqft | DOM | Units | Dist |
|---|---|---|---|---|---|---|---|---|
| 15570 Mount Vernon St Southfield, MI | 3.0 | 2.0 | 2100 | $2,200 | $1.05 | 45d | 1 | 0.31mi |
| 15341 Marlow St Oak Park, MI | 3.0 | 2.0 | 2097 | $2,200 | $1.05 | 5d | 1 | 0.37mi |
| 15800 Providence Dr Southfield, MI | 3.0 | 1.0–2.0 | 1140 | $1,895 | $1.66 | 3d | 22 | 0.43mi |
| 16176 Cumberland Rd Southfield, MI | 2.0–3.0 | 2.0 | 1450 | $1,675 | $1.16 | 45d | 1 | 0.56mi |
| 23300 Providence Dr Southfield, MI | 2.0–3.0 | 2.0 | 1342 | $1,749 | $1.30 | 1d | 14 | 0.57mi |
| 25600 Briar Dr Oak Park, MI | 2.0–3.0 | 1.5 | 1235 | $1,935 | $1.57 | 25d | 7 | 0.95mi |
| 16500 N Park Dr Southfield, MI | 1.0–3.0 | 1.0–2.5 | 1500 | $2,289 | $1.53 | 0d | 1 | 1.10mi |
Listing history 33 events
-
2026-06-17status $224,900 Pending 48 DOM
Show marketing remark (486 chars)
Spacious 5BR, 2.1BA tri-level in desirable Southfield offering great sweat equity opportunity! Features include hardwood floors, living room with natural fireplace, formal dining room, and finished walkout lower level with wet bar. Ensuite primary bedroom with walk-in closet and private full bath. Built-in BBQ pit for outdoor entertaining. Newer furnace & A/C. Solid home with strong bones - just needs updates to make it shine! Great value for buyers looking to build equity.
-
2026-06-17days on market $224,900 Active 48 DOM
Show marketing remark (486 chars)
Spacious 5BR, 2.1BA tri-level in desirable Southfield offering great sweat equity opportunity! Features include hardwood floors, living room with natural fireplace, formal dining room, and finished walkout lower level with wet bar. Ensuite primary bedroom with walk-in closet and private full bath. Built-in BBQ pit for outdoor entertaining. Newer furnace & A/C. Solid home with strong bones - just needs updates to make it shine! Great value for buyers looking to build equity.
-
2026-06-16days on market $224,900 Active 47 DOM
-
2026-06-15days on market $224,900 Active 46 DOM
-
2026-06-13days on market $224,900 Active 44 DOM
-
2026-06-13days on market $224,900 Active 43 DOM
-
2026-06-09days on market $224,900 Active 40 DOM
-
2026-06-08days on market $224,900 Active 39 DOM
-
2026-06-07days on market $224,900 Active 38 DOM
-
2026-06-04days on market $224,900 Active 35 DOM
-
2026-06-03days on market $224,900 Active 34 DOM
-
2026-06-02days on market $224,900 Active 33 DOM
-
2026-06-01days on market $224,900 Active 32 DOM
-
2026-05-31days on market $224,900 Active 31 DOM
-
2026-04-30$224,900 Active 486-char remark
Show marketing remark (486 chars)
Spacious 5BR, 2.1BA tri-level in desirable Southfield offering great sweat equity opportunity! Features include hardwood floors, living room with natural fireplace, formal dining room, and finished walkout lower level with wet bar. Ensuite primary bedroom with walk-in closet and private full bath. Built-in BBQ pit for outdoor entertaining. Newer furnace & A/C. Solid home with strong bones - just needs updates to make it shine! Great value for buyers looking to build equity.
-
2026-04-30$224,900 Active 490-char remark
Show marketing remark (486 chars)
Spacious 5BR, 2.1BA tri-level in desirable Southfield offering great sweat equity opportunity! Features include hardwood floors, living room with natural fireplace, formal dining room, and finished walkout lower level with wet bar. Ensuite primary bedroom with walk-in closet and private full bath. Built-in BBQ pit for outdoor entertaining. Newer furnace & A/C. Solid home with strong bones - just needs updates to make it shine! Great value for buyers looking to build equity.
-
2026-04-30historical
Show marketing remark (486 chars)
Spacious 5BR, 2.1BA tri-level in desirable Southfield offering great sweat equity opportunity! Features include hardwood floors, living room with natural fireplace, formal dining room, and finished walkout lower level with wet bar. Ensuite primary bedroom with walk-in closet and private full bath. Built-in BBQ pit for outdoor entertaining. Newer furnace & A/C. Solid home with strong bones - just needs updates to make it shine! Great value for buyers looking to build equity.
-
2026-02-13$250,000 Active
-
2026-02-13$250,000 Active
-
2009-05-11soldstatus $40,500
-
2009-02-14$38,800
-
2009-02-13historical
-
2009-01-24$44,000
-
2009-01-22historical
-
2008-10-29$48,000
-
1999-06-07soldstatus $157,000
-
1998-11-08$159,900
-
1998-08-31historical
-
1998-05-29$164,000
-
1996-07-22soldstatus $124,000
-
1996-06-26soldstatus $124,000
-
1996-04-12$129,900
ⓘ Source: listings_history table (triggers on properties + properties_extension) + one-shot
backfill from property_details.listing_events for pre-trigger history.
Tax reassessment forecast MI · Partial reset (capped growth)
- Current annual tax
- $3,622 · $302/mo
- Projected year-2 tax
- $3,622 · $302/mo
- Expected delta
- $0/yr ($0/mo · -0.0%)
ⓘ Screening estimate from a state-policy table — verify with the county assessor before closing.
Climate risk First Street
- Flood 1/10 Low FEMA zone X (unshaded) · 0% chance over 30 yrs
- Wildfire 1/10 Low
- Heat 3/10 Moderate 7 d/yr ≥97°F today · 15 d/yr by 30 yrs out
- Wind 2/10 Low
- Air quality 4/10 Moderate 3 unhealthy d/yr today · 6 by 30 yrs out
Nearby sold comps map
Loading sold comps map…
Walkable amenities ~0.75 mi
Loading nearby amenities…
Taxation est. · year 1
- Rental income
- $25,615
- − Mortgage interest
- −$12,598
- − Property taxes
- −$3,622
- − Insurance
- −$1,124
- − Repairs & maintenance
- −$2,049
- − Management
- −$2,049
- − Depreciation
- −$6,543
- Taxable loss
- −$2,370
- Est. tax savings @ 24.0%
- +$569
- After-tax cash flow
- $1,906/yr
For passive investors: Depreciation is non-cash, so a rental often shows a tax loss while cash-flowing — sheltering income. Rental losses are passive: they offset passive income freely, and up to $25,000/yr can offset ordinary (W-2) income if you actively participate and your MAGI is under $100k (phasing out to $0 by $150k); unused losses carry forward. On sale, claimed depreciation is recaptured at up to 25%, and gains may owe capital-gains tax (a 1031 exchange can defer both). Figures are a year-1 estimate at your 24.0% rate — not tax advice; consult a CPA.
Schools (NCES district)
- District
- Southfield Public School District
- NCES district ID
- 2632310
- Math proficiency
- 17% ▼ -3.00%
- Reading proficiency
- 37% ▲ 1.00%
- Median HH income
- $51,400
- Composite
- 23.77/100
- National rank
- #7814
- State rank
- #392 of 540 in MI
Livability — Southfield
- Score
- 72/100
- State rank
- #248
- US rank
- #6175
Category grades
Schools grade is shown separately in the Schools card above.
Census & demographics
- Census place
- Southfield, MI
- County
- Oakland County · 1,009,092 people
- City population
- 54,914
- Metro
- Detroit-Warren-Dearborn, MI
- Population (ZIP)
- 22,841
- Household income
- $65,384
- Rent vs Own
- Severe rent burden
- 1336.0
Population outlook (Oakland County) Hauer SSP2
- Today (2025)
- 1,335,747 people
- By 2030
- 1,375,100 · +2.9%
- By 2040
- 1,435,385 · +7.5%
- By 2050
- 1,469,250 · +10.0%
- By 2075
- 1,531,946 · +14.7%
- By 2100
- 1,450,485 · +8.6%
Race, ethnicity, and origin ACS 2023
- Neighborhood character
- Majority Black (65%)
- Race & ethnicity
- Black 65% White 26% Two or more races 7% Hispanic / Latino 1%
- Common ancestry
- Romanian 2% Scotch-Irish 2% Subsaharan African 1%
- Foreign-born
- 4% · Canada
- Languages at home
- 94% English-only · Russian/Polish/Slavic 1% Spanish 1% German/W. Germanic 1%
Political lean MEDSL · Oakland
- 2024 margin
- D (+10.6) · D 54.4% · R 43.8% · Other 1.9%
- 2008→2024 swing
- -3.9pp toward R · 2008: 14.5pp · 2024: 10.6pp
- All cycles
- 2024: D+10.6 2020: D+14.1 2016: D+8.1 2012: D+8.1 2008: D+14.5
Not yet ingested
- Civics
- —
Market trends
- HPI YoY
- ▼ -209.20%
- Current HPI
- 190.3275
- Rent YoY
- ▲ 8.06%
- Metro
- Detroit-Warren-Dearborn, MI
- State GDP YoY
- ▲ 1.37%
- F500 in state
- 28
Industry mix (Fortune 500 HQ in MI)
| Industry | F500 HQs | Revenue |
|---|---|---|
| Automotive Parts | 3 | $48B |
|
||
| Automotive | 2 | $372B |
|
||
| Chemicals | 1 | $45B |
|
||
| Automotive Retail | 1 | $29B |
|
||
| Healthcare / Medical Devices | 1 | $23B |
|
||
| Automotive Technology | 1 | $20B |
|
||
Price history
+73.1% since first listed21 events — show timeline
- 2026-06-17 Pending — MiRealSource-MiMLS
- 2026-06-17 Pending — REALCOMP
- 2026-04-30 Listing Removed — MiRealSource-MiMLS
- 2026-04-30 Listing Removed — REALCOMP
- 2026-04-30 Listed $224,900 REALCOMP
- 2026-04-30 Listed $224,900 MiRealSource-MiMLS
- 2026-02-13 Listed $250,000 MiRealSource-MiMLS
- 2026-02-13 Listed $250,000 REALCOMP
- 2009-05-11 Sold (MLS) $40,500 REALCOMP
- 2009-02-14 Listed $38,800 REALCOMP
- 2009-02-13 Listing Removed — REALCOMP
- 2009-01-24 Listed $44,000 REALCOMP
- 2009-01-22 Listing Removed — REALCOMP
- 2008-10-29 Listed $48,000 REALCOMP
- 1999-06-07 Sold (MLS) $157,000 REALCOMP
- 1998-11-08 Listed $159,900 REALCOMP
- 1998-08-31 Listing Removed — REALCOMP
- 1998-05-29 Listed $164,000 REALCOMP
- 1996-07-22 Sold (Public Records) $124,000 Public Records
- 1996-06-26 Sold (MLS) $124,000 REALCOMP
- 1996-04-12 Listed $129,900 REALCOMP
Property tax history
+3.4%/yrLatest (2025): $3,622 · +18.3% YoY. Source: county tax records.
Cash-flow waterfall
monthlySold comps — $/sqft
last 12 mo · ≤1 miLoading sold comps…