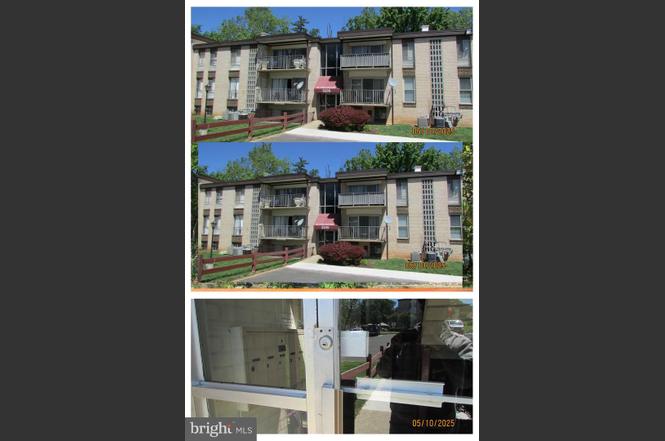
5206 Newton St #202 · Bladensburg, MD
Flood risk 9/10 · Severe
- FEMA flood zone
- X (unshaded)
- Chance of flooding over 30 yrs
- 0.99%
- Est. flood insurance / yr
- $507 – $1,088
Fire risk 1/10 · Minimal
- Est. fire insurance / yr
- $755 – $1,403
Heat risk 8/10 · Major
- Hot days now (above 104°F)
- 7 days/yr
- Hot days in 30 yrs
- 15 days/yr
Wind risk 4/10 · Minor
- Chance of severe wind over 30 yrs
- 19.0%
Air-quality risk 4/10 · Minor
- Unhealthy air days now
- 4 days/yr
- Unhealthy air days in 30 yrs
- 5 days/yr
Risk factors via First Street. Map © Google.
Why this score? — see what drove the C- grade
The composite is a weighted blend of 9 inputs, each scored 0–100. Each bar is that input's sub-score; the figure is the points it added to the 100-point composite (weight × sub-score).
- Cash flow +14.1/30.0
- Appreciation +10.0/10.0
- ARV discount +7.5/15.0
- 1% rule +7.4/10.0
- DSCR +4.3/10.0
- Livability +3.2/5.0
- Rent growth +2.5/5.0
- Condition / age +2.5/5.0
- Schools +1.7/10.0
$145,000
🖨 Deal sheet (PDF) 📄 Offer letter ✓ Due diligence
Listing remarks
Three Bedroom Condo in the heart of Bladensburg! Ready to move in, yet does needs some TLC. Seller prefers to sell as is. Located on the back side of the Building, with a balcony view of the wooded area. Secured Main Building Entrance. Located close to the Bladensburg Waterfront Park, Mount Rainier nature Center, the Bladensburg Community Center, and Kenilworth Park Aquatic Gardens. It's also perfect for Downtown Commuters and only 2.4 miles to the Deanwood Metro Station.
Key facts
- $377 HOA
- Community pool
- Built 1966
Property features AI
Finance
- Other: Condominium ownership; Pets allowed with breed restrictions; In city limits; city/county roads with blacktop surface
- HOA & community: Monthly condo fee of $377; Professionally managed off-site; Association covers common area maintenance, lawn care, parking fee, reserves, sewer, snow removal, trash, water, management, and custodial/maintenance
Exterior
- Parking: Parking lot; Parking included in association
- Utilities: Public water; Public sewer; Municipal trash service; Hot water: other
- Home design: Condominium unit (Unit/Flat); Garden-style building (1–4 floors); Entry on 2nd floor; Building not winterized; Facing/entry within city limits (Bladensburg)
- Construction: Brick construction; Major renovation effective 2020
- Exterior features: Balcony; Sidewalks; Street lighting; Community in-ground pool; Tot lot/playground; Common grounds
Interior
- Kitchen: Dishwasher; Disposal; Gas range/oven; Refrigerator
- Bedrooms: Three bedrooms (main level)
- Bathrooms: One full bathroom
- Heating & cooling: Central heating (natural gas); Central air conditioning (electric)
- Interior features: Combination dining and living area; Not furnished; 2+ shared/attached walls
- Laundry & utility: No in-unit washer/dryer or hookups
Neighborhood map
What this means for you Summary
Snapshot
- This is a 3-bed/1.0-bath condo listed at $145k.
Deal economics
- At list price, monthly cash flow is $-46 ($-552/yr) — negative.
- To cash-flow at today's rent, offer at most $137k (5.6% below list).
- Meets the 1% rule at list price ($2k rent vs $145k).
- Recommended offer: $128k (12.0% below list) — sets the bar for market timing.
Location & tenants
- Location reads 64/100 on livability (#277 in MD) — a middle-class / working-renter tenant base. Strengths: housing A, health & safety A; Watch: employment C-, cost of living C-, amenities D.
- Prince George'S County Public Schools (suburban): math 8% / reading 24% proficiency, ranked #21 of 24 in MD (top 88%) — low school quality limits family demand, transient renter base, plan for 1-2y turnover.
- Zoned schools: Bladensburg Elementary (math 5% / reading 18%, grade F, #567 of 860 statewide, top 67%, 710 students, 90% FRL); Bladensburg High (math 14% / reading 31%, grade F, #170 of 222 statewide, top 76%, 2,164 students, 84% FRL) — zoned schools average 87% FRL vs 53% district-wide (34 pts higher); higher-poverty schools than district average — tighter screening recommended.
- Market conditions: 20 active listings in the ZIP; 35 comparable units currently listed for rent nearby; rentals at typical pace (median 16d on market — plan ~3-4 weeks tenant-placement turnaround); 1,481 units permitted in Prince George's County in 2024 (0 in 5+ unit buildings).
- This rent runs 34% of the median local income ($64k/yr) — at the standard rent-burdened threshold; future hikes will face affordability resistance.
Forward outlook
- In year one you build about $16k of equity ($1k loan paydown + $14k appreciation (10.0% local appreciation)).
- Prince George's County population projected at +18% by 2050 — long-run rental-demand tailwind backs the buy-and-hold thesis.
- At projected returns (10.0% appreciation + 3.0% rent growth), your $41k cash investment doubles in ~3 years — after that, you're playing with house money.
- By year 3, paydown + projected appreciation supports a ~$39k cash-out refi (75% LTV) — recoverable capital for the next deal without selling this one.
Negotiation context
- It's been on market 209 days — a 12% lower offer ($128k) is reasonable based on typical stale-listing flexibility.
- 7 sale attempts since 29y ago; this cycle's ask has dropped $30k (17%) from the opening price — seller is motivated, your offer sets the floor, not the list.
Risks & watch-outs
- Watch-outs: flood insurance adds $66/mo; HOA is 21% of rent.
- Climate carrying-cost: severe flood risk; extreme-heat days projected 7→15/yr by 2055 (HVAC capex compounding) — expect insurance premiums to compound above CPI over the hold.
Questions for the listing agent
- What do current leases actually rent for vs. the listed asking? Can we see a recent rent roll and the last 12 months of T-12 income?
- It's been on market 209 days. Have you received any prior offers? Is the seller open to a 12% concession, seller financing, or rate buy-down credit?
- Built in 1966 — when were the roof, HVAC, electrical panel, plumbing, and water heater last replaced?
- What's the actual annual flood-insurance premium (NFIP or private), and is the property in a SFHA with mandatory coverage?
- What does the HOA fee cover, when was the last increase, and are there any pending special assessments or reserve-fund shortfalls?
- Any open or pending special assessments — roof, HVAC, plumbing, elevator, façade? What's the per-unit balance and payoff schedule, and is the seller paying it off at close or rolling it to the buyer?
- Why hasn't it sold? Are there any deal-killer items the seller is aware of (foundation, flood, title, zoning, code violations)?
- Is there a deadline driving the sale (1031 exchange, divorce, estate, relocation)? That informs how much negotiation room exists.
- Schools are F-rated, which usually means shorter tenancies and higher turnover. Who's the typical renter profile here, and what's been the actual vacancy rate?
- Crime grade is F in this area — have there been break-ins, vandalism, or insurance claims at this property in the last 3 years? What carrier currently insures it and at what premium?
- What's the average days-on-market for RENTAL listings here right now (not sales)? A rising rental-DOM trend means longer vacancies and softer asking-rent achievability than the comps imply.
- What's the recent tenant-quality profile in this submarket — average credit score on applications, eviction rate, late-payment / NSF rate, and stable-employment percentage? A property-management company in the area should have these aggregated.
- How much new apartment / multifamily construction is in the pipeline within 1–3 miles? Heavy new supply (>2% of stock underway) typically softens rents 12–24 months out; light construction supports rent growth.
Investment metrics
- 1% rule
- 1.24% ✓
- Cap rate
- 6.46%
- Cash-on-cash
- 0.60%
- DSCR
- 1.03
- GRM
- 6.7
CMA / ARV
No comps found within radius.
Projected returns pro-forma
10.0% appreciation · 3.0% rent growth · sell at horizon
- IRR
- 23.4%
- Equity multiple
- 2.88×
- Total profit
- $76,357
- Equity at exit
- $130,627
- IRR
- 20.9%
- Equity multiple
- 6.61×
- Total profit
- $227,790
- Equity at exit
- $281,703
Cash invested: $40,600 (down + closing). Projections, not guarantees.
Landlord ↔ Tenant lean methodology
- Overall (STATE)
- 27 Tenant-Leaning
- State Maryland
- 27 Tenant-Leaning · D+14
- County
- — inherits STATE
- City
- — inherits STATE
ZIP-level market 20710
- Home prices YoY
- 4.8%
- Active inventory
- 20
- Price-to-rent
- 6.7×
Monthly cashflow live
- Estimated rent
- $1,805 high interval (Pro) →
- Mortgage (P&I)
- −$760
- Tax from tax record
- −$208 /mo · $2,490/yr
- Insurance
- −$60
- Flood insurance flood zone
- −$66 /mo · $798/yr
- HOA
- −$377
- Vacancy / Maint / Mgmt
- −$379
- Net cashflow
- $-46
Break-even live
Sensitivity live
| Price | -10% $36 | -5% $-5 | +0% $-46 | +5% $-87 | +10% $-128 |
|---|---|---|---|---|---|
| Rent | -10% $-189 | -5% $-117 | +0% $-46 | +5% $25 | +10% $97 |
| Rate | -1.0pp $27 | -0.5pp $-9 | base $-46 | +0.5pp $-84 | +1.0pp $-122 |
UW: 25.0% down · 7.5% · 30yr · 1.5% tax · 5.0% vac · 8.0% maint · 8.0% mgmt
Financing live
Cash to close
- Down payment
- $36,250
- Closing costs
- $4,350
- Reserves months
- —
- Total cash needed
- —
Loan-product check · same deal, 3 products live
Conventional
25% down · 7.5% · 30yr
- Down + closing
- —
- Monthly P&I
- —
- Monthly cashflow
- —
- DSCR
- —
- Eligible?
- —
Personal DTI + credit; lowest rate.
DSCR
20% down · 8.5% · 30yr
- Down + closing
- —
- Monthly P&I
- —
- Monthly cashflow
- —
- DSCR
- —
- Eligible?
- —
No personal income docs; deal must DSCR.
Hard money
10% down · 12.0% · 12mo
- Down + closing
- —
- Monthly P&I
- —
- Monthly cashflow
- —
- DSCR
- —
- Eligible?
- —
Short-term bridge; refi at stabilization.
Rent comps 35 comps
| Address | Beds | Baths | Sqft | Rent | $/sqft | DOM | Units | Dist |
|---|---|---|---|---|---|---|---|---|
| 5301 Quincy St Unit 1204 Bladensburg, MD | 2.0 | 1.0 | 905 | $1,750 | $1.93 | 25d | 1 | 0.02mi |
| 5301 Quincy St Unit 01-304 FR Bladensburg, MD | 2.0 | 1.0 | 905 | $1,750 | $1.93 | 44d | 1 | 0.02mi |
| 5200 Newton St Bladensburg, MD | 2.0 | 1.0–1.5 | 931 | $1,650 | $1.77 | 44d | 2 | 0.05mi |
| 5200 Newton St #202 Bladensburg, MD | 2.0 | 1.5 | 925 | $1,650 | $1.78 | 25d | 1 | 0.05mi |
| 3901 53rd St Bladensburg, MD | 1.0–2.0 | 1.0 | 850 | $1,495 | $1.76 | 3d | 2 | 0.06mi |
| 5211 Newton St #103 Bladensburg, MD | 3.0 | 2.0 | 1143 | $1,900 | $1.66 | 44d | 1 | 0.08mi |
| 5215 Newton St #104 Bladensburg, MD | 2.0 | 1.0 | 922 | $1,850 | $2.01 | 44d | 1 | 0.10mi |
| 4101 53rd Ave Unit 4210P2 Bladensburg, MD | 2.0 | 1.0 | 788 | $1,725 | $2.19 | 25d | 1 | 0.20mi |
| 4101 53rd Ave Unit 4103A1 Bladensburg, MD | 2.0 | 1.0 | 788 | $1,725 | $2.19 | 44d | 1 | 0.20mi |
| 3554 55th Ave Hyattsville, MD | 1.0–3.0 | 1.0 | 603 | $1,792 | $2.97 | 0d | 7 | 0.25mi |
| 4109 51st St Unit 5102T102 Bladensburg, MD | 2.0 | 1.0 | 755 | $1,630 | $2.16 | 25d | 1 | 0.27mi |
| 4611 Edmonston Rd Unit 1 Hyattsville, MD | 2.0 | 1.0 | 850 | $1,750 | $2.06 | 25d | 1 | 0.53mi |
| 5802 Annapolis Rd Bladensburg, MD | 1.0–2.0 | 1.0–2.0 | 796 | $1,898 | $2.38 | 0d | 22 | 0.71mi |
| 4203 58th Ave Bladensburg, MD | 1.0–3.0 | 1.0–2.0 | 752 | $2,123 | $2.82 | 0d | 14 | 0.74mi |
| 4203 58th Ave Bladensburg, MD | 1.0–2.0 | 1.0 | 735 | $2,069 | $2.81 | 2d | 61 | 0.74mi |
| 5704 Euclid St Cheverly, MD | 4.0 | 2.0 | 1260 | $2,300 | $1.83 | 13d | 1 | 1.08mi |
| 3839 64th Ave Hyattsville, MD | 2.0 | 1.0 | 875 | $1,650 | $1.89 | 2d | 4 | 1.14mi |
| 5323 Taylor Rd Unit 1546071P Riverdale, MD | 3.0 | 2.0 | 1097 | $2,258 | $2.06 | 16d | 1 | 1.16mi |
| 5033 57th Ave Bladensburg, MD | 1.0–3.0 | 1.0–2.0 | 859 | $1,999 | $2.33 | 0d | 13 | 1.17mi |
| 5303 55th Pl Riverdale, MD | 4.0 | 3.0 | 1375 | $4,150 | $3.02 | 6d | 1 | 1.25mi |
| 3709 Parkwood St Brentwood, MD | 4.0 | 3.0 | 1104 | $2,950 | $2.67 | 44d | 1 | 1.26mi |
| 6011 Emerson St Bladensburg, MD | 1.0–2.0 | 1.0 | 737 | $1,725 | $2.34 | 25d | 3 | 1.28mi |
| 6011 Emerson St Bladensburg, MD | 2.0 | 1.0 | 737 | $1,662 | $2.26 | 16d | 3 | 1.28mi |
| 6011 Emerson St Bladensburg, MD | 2.0 | 1.0 | 737 | $1,688 | $2.29 | 44d | 2 | 1.28mi |
| 5334 Baltimore Ave Hyattsville, MD | 2.0 | 1.0–2.0 | 903 | $3,501 | $3.88 | 0d | 52 | 1.33mi |
| 3806 39th St Unit 3 Brentwood, MD | 2.0 | 1.0 | 800 | $1,650 | $2.06 | 44d | 1 | 1.34mi |
| 5501 45th Ave Hyattsville, MD | 2.0 | 1.0–2.0 | 829 | $2,325 | $2.80 | 0d | 22 | 1.38mi |
| 4100 Rhode Island Ave Brentwood, MD | 1.0–2.0 | 1.0–2.0 | 822 | $2,650 | $3.22 | 0d | 12 | 1.38mi |
| 5540 60th Ave Riverdale, MD | 3.0 | 1.5 | 1368 | $2,900 | $2.12 | 6d | 1 | 1.42mi |
| 5301 62nd Ave Riverdale, MD | 4.0 | 2.5 | 1152 | $2,700 | $2.34 | 19d | 1 | 1.45mi |
| 4108 40th St Unit 301 Brentwood, MD | 2.0 | 1.0 | 900 | $1,475 | $1.64 | 6d | 1 | 1.46mi |
| 5510 Madison St Riverdale, MD | 1.0–2.0 | 1.0 | 566 | $1,805 | $3.19 | 4d | 16 | 1.46mi |
| 6212 Carters Ln Riverdale, MD | 4.0 | 2.5 | 1152 | $2,350 | $2.04 | 44d | 1 | 1.48mi |
| 3750 Jamison St NE Washington, DC | 2.0 | 1.0–2.0 | 761 | $2,676 | $3.51 | 3d | 8 | 1.48mi |
| 5221 Egret LN Bladensburg, MD | 3.0–4.0 | 2.0–3.0 | 1540 | $1,975 | $1.28 | 44d | 1 | 1.49mi |
HOA detail condo
- Monthly dues
- $377 · $4,524/yr
- Likely covers
- water
- Assessments
- None detected in remarks — confirm with the listing agent.
Listing history 33 events
-
2026-06-21days on market $145,000 Active 209 DOM
-
2026-06-18days on market $145,000 Active 206 DOM
-
2026-06-17days on market $145,000 Active 205 DOM
-
2026-06-16days on market $145,000 Active 204 DOM
-
2026-06-15days on market $145,000 Active 203 DOM
-
2026-06-13pricestatusdays on market $145,000 Active 201 DOM
-
2026-04-21historical Active Under Contract
-
2025-10-06status Active
-
2025-09-18historical
-
2025-09-18$175,000 Active
-
2025-08-11historical $175,000
-
2022-09-21soldstatus $590,800
-
2021-10-26historical
-
2021-10-06price $209,000
-
2021-09-05$219,000 Active
-
2019-11-19historical
-
2019-10-22price $199,000
-
2019-10-07$219,000 Active
-
2019-09-10soldstatus $111,000
-
2019-08-26soldstatus $111,000 Closed
-
2019-07-08status Pending
-
2019-05-28price $111,000
-
2019-05-28historical
-
2019-05-25$110,000 Active
-
2007-09-28soldstatus $107,000
-
2006-02-09soldstatus $117,500
-
2006-01-31soldstatus $116,000
-
2006-01-11historical
-
2006-01-10$116,000
-
1997-12-17soldstatus $50,000
-
1997-11-22soldstatus $50,000
-
1997-10-10historical
-
1997-02-28$53,000
ⓘ Source: listings_history table (triggers on properties + properties_extension) + one-shot
backfill from property_details.listing_events for pre-trigger history.
Tax reassessment forecast MD · Partial reset (capped growth)
- Current annual tax
- $2,490 · $208/mo
- Projected year-2 tax
- $2,490 · $208/mo
- Expected delta
- $0/yr ($0/mo · 0.0%)
ⓘ Screening estimate from a state-policy table — verify with the county assessor before closing.
Climate risk First Street
- Flood 9/10 Extreme FEMA zone X (unshaded) · 99% chance over 30 yrs
- Wildfire 1/10 Low
- Heat 8/10 Severe 7 d/yr ≥104°F today · 15 d/yr by 30 yrs out
- Wind 4/10 Moderate 19% chance of damaging wind over 30 yrs
- Air quality 4/10 Moderate 4 unhealthy d/yr today · 5 by 30 yrs out
Nearby sold comps map
Loading sold comps map…
Walkable amenities ~0.75 mi
Loading nearby amenities…
Taxation est. · year 1
- Rental income
- $21,658
- − Mortgage interest
- −$8,122
- − Property taxes
- −$2,490
- − Insurance
- −$1,522
- − Repairs & maintenance
- −$1,733
- − Management
- −$1,733
- − HOA
- −$4,524
- − Depreciation
- −$4,218
- Taxable loss
- −$2,685
- Est. tax savings @ 24.0%
- +$644
- After-tax cash flow
- $92/yr
For passive investors: Depreciation is non-cash, so a rental often shows a tax loss while cash-flowing — sheltering income. Rental losses are passive: they offset passive income freely, and up to $25,000/yr can offset ordinary (W-2) income if you actively participate and your MAGI is under $100k (phasing out to $0 by $150k); unused losses carry forward. On sale, claimed depreciation is recaptured at up to 25%, and gains may owe capital-gains tax (a 1031 exchange can defer both). Figures are a year-1 estimate at your 24.0% rate — not tax advice; consult a CPA.
Schools (NCES district)
- District
- Prince George'S County Public Schools
- NCES district ID
- 2400510
- Math proficiency
- 8% ▼ -11.00%
- Reading proficiency
- 24% ▼ -9.00%
- Median HH income
- $73,967
- Composite
- 16.82/100
- National rank
- #9151
- State rank
- #21 of 24 in MD
Livability — Bladensburg
- Score
- 64/100
- State rank
- #277
- US rank
- #14239
Category grades
Schools grade is shown separately in the Schools card above.
Census & demographics
- Census place
- Bladensburg, MD
- County
- Prince Georges County · 919,866 people
- City population
- 9,801
- Metro
- Washington-Arlington-Alexandria, DC-VA-MD-WV
- Population (ZIP)
- 9,801
- Household income
- $63,810
- Rent vs Own
- Severe rent burden
- 810.0
Population outlook (Prince George's County) Hauer SSP2
- Today (2025)
- 1,005,426 people
- By 2030
- 1,048,416 · +4.3%
- By 2040
- 1,123,425 · +11.7%
- By 2050
- 1,183,220 · +17.7%
- By 2075
- 1,306,202 · +29.9%
- By 2100
- 1,408,179 · +40.1%
Race, ethnicity, and origin ACS 2023
- Neighborhood character
- Majority Black (57%)
- Race & ethnicity
- Black 57% Hispanic / Latino 40% Two or more races 9%
- Hispanic origin (detail)
- Mexican 16% Dominican 2%
- Common ancestry
- Swiss 1%
- Foreign-born
- 38% · Canada, South Korea, Guatemala
- Languages at home
- 50% English-only · Spanish 34% French/Haitian/Cajun 7% Korean 1%
Political lean MEDSL · Prince George's
- 2024 margin
- Solid D (+75.2) · D 86.3% · R 11.2% · Other 2.5%
- 2008→2024 swing
- -3.3pp toward R · 2008: 78.5pp · 2024: 75.2pp
- All cycles
- 2024: D+75.2 2020: D+80.5 2016: D+81.0 2012: D+80.9 2008: D+78.5
Not yet ingested
- Civics
- —
Market trends
- HPI YoY
- ▲ 16.66%
- Current HPI
- 365.4382
- Rent YoY
- —
- Metro
- Washington-Arlington-Alexandria, DC-VA-MD-WV
- State GDP YoY
- ▲ 2.97%
- F500 in state
- 12
Industry mix (Fortune 500 HQ in MD)
| Industry | F500 HQs | Revenue |
|---|---|---|
| Aerospace / Defense | 1 | $71B |
|
||
| Utilities | 1 | $25B |
|
||
| Hotels | 1 | $24B |
|
||
| Consumer Goods | 1 | $7B |
|
||
| Real Estate | 1 | $6B |
|
||
| Chemicals | 1 | $2B |
|
||
Price history
+230.2% since first listed27 events — show timeline
- 2026-04-21 Contingent — BRIGHT MLS
- 2025-10-06 Relisted — BRIGHT MLS
- 2025-09-18 Listing Removed — BRIGHT MLS
- 2025-09-18 Listed $175,000 BRIGHT MLS
- 2025-08-11 Coming Soon $175,000 BRIGHT MLS
- 2022-09-21 Sold (Public Records) $590,800 Public Records
- 2021-10-26 Listing Removed — BRIGHT MLS
- 2021-10-06 Price Changed $209,000 BRIGHT MLS
- 2021-09-05 Listed $219,000 BRIGHT MLS
- 2019-11-19 Listing Removed — BRIGHT MLS
- 2019-10-22 Price Changed $199,000 BRIGHT MLS
- 2019-10-07 Listed $219,000 BRIGHT MLS
- 2019-09-10 Sold (Public Records) $111,000 Public Records
- 2019-08-26 Sold (MLS) $111,000 BRIGHT MLS
- 2019-07-08 Pending — BRIGHT MLS
- 2019-05-28 Listing Removed — BRIGHT MLS
- 2019-05-28 Price Changed $111,000 BRIGHT MLS
- 2019-05-25 Listed $110,000 BRIGHT MLS
- 2007-09-28 Sold (Public Records) $107,000 Public Records
- 2006-02-09 Sold (Public Records) $117,500 Public Records
- 2006-01-31 Sold (MLS) $116,000 MRIS
- 2006-01-11 Delisted — MRIS
- 2006-01-10 Listed $116,000 MRIS
- 1997-12-17 Sold (Public Records) $50,000 Public Records
- 1997-11-22 Sold (MLS) $50,000 MRIS
- 1997-10-10 Delisted — MRIS
- 1997-02-28 Listed $53,000 MRIS
Property tax history
+4.5%/yrLatest (2025): $2,490 · +1.8% YoY. Source: county tax records.
Cash-flow waterfall
monthlySold comps — $/sqft
last 12 mo · ≤1 miLoading sold comps…