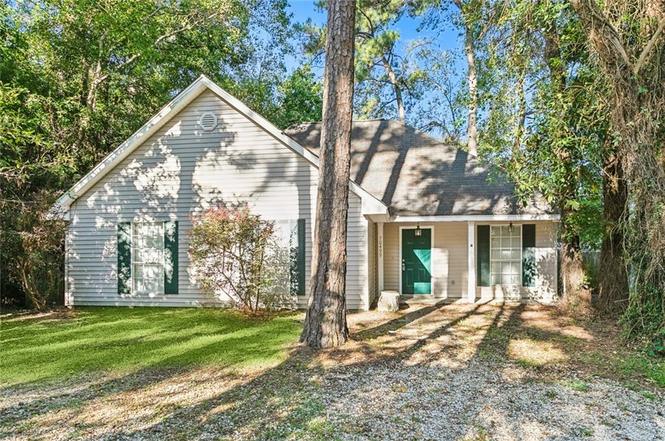
70499 J St · Covington, LA
Flood risk 1/10 · Minimal
- FEMA flood zone
- —
- Chance of flooding over 30 yrs
- 0.0%
- Est. flood insurance / yr
- —
Fire risk 4/10 · Minor
- Est. fire insurance / yr
- $1,269 – $2,357
Heat risk 9/10 · Severe
- Hot days now (above 109°F)
- 7 days/yr
- Hot days in 30 yrs
- 21 days/yr
Wind risk 9/10 · Severe
- Chance of severe wind over 30 yrs
- 99.0%
Air-quality risk 2/10 · Minimal
- Unhealthy air days now
- 0 days/yr
- Unhealthy air days in 30 yrs
- 1 days/yr
Risk factors via First Street. Map © Google.
Why this score? — see what drove the C+ grade
The composite is a weighted blend of 9 inputs, each scored 0–100. Each bar is that input's sub-score; the figure is the points it added to the 100-point composite (weight × sub-score).
- Cash flow +22.7/30.0
- ARV discount +13.8/15.0
- DSCR +7.3/10.0
- 1% rule +5.4/10.0
- Schools +4.3/10.0
- Livability +3.8/5.0
- Rent growth +3.6/5.0
- Condition / age +2.5/5.0
- Appreciation +0.0/10.0
$170,000
🖨 Deal sheet (PDF) 📄 Offer letter ✓ Due diligence
Listing remarks MLS
GREAT STARTER HOME CLOSE TO ALL AMENITIES. FEATURES 3BR, 2 BTHS, FENCED RER YARD, SHED AND CIRCULAR DRIVE.
Key facts
- Close to amenities
- Fenced rear yard
- 5,720 sq ft lot
Tags
Neighborhood map
What this means for you Summary
Snapshot
- This is a 3-bed/2.0-bath single-family listed at $170k.
Deal economics
- At list price, monthly cash flow is $291 ($3k/yr) — positive.
- The deal already cash-flows at list — no discount required.
- Meets the 1% rule at list price ($2k rent vs $170k).
- Recommended offer: $165k (3.0% below list) — sets the bar for market timing.
- Cap rate 8.3% vs local median 3.9% in Covington — top-decile yield for the area; either an underpriced asset or a hidden risk that comps aren't pricing in. Stress-test before assuming the spread holds.
Location & tenants
- Location reads 75/100 on livability (#17 in LA, #3,876 nationally) — a middle-class / working-renter tenant base. Strengths: employment A+, housing A+, health & safety A+; Watch: amenities F, commute F.
- St. Tammany Parish (suburban): math 43% / reading 55% proficiency, ranked #11 of 98 in LA (top 11%) — families likely to look elsewhere, expect single-tenant / working-renter base with shorter leases.
- Market conditions: Rents rising fast (+4.3%/yr); 524 active listings in the ZIP; 19 comparable units currently listed for rent nearby; rentals at typical pace (median 25d on market — plan ~3-4 weeks tenant-placement turnaround); solid renter incomes; 1,064 units permitted in St. Tammany Parish in 2024 (0 in 5+ unit buildings).
Forward outlook
- Local home prices are declining (-3.0%/yr); year-one equity from $1k of loan paydown is wiped out by about $5k of value loss. Plan a longer hold.
- St. Tammany County population projected at +27% by 2050 — long-run rental-demand tailwind backs the buy-and-hold thesis.
Negotiation context
- It's been on market 37 days — a 3% lower offer ($165k) is reasonable based on typical stale-listing flexibility.
- 8 sale attempts since 22y ago with the ask held roughly flat each time — persistent listings suggest the price (not the market) is what's stuck; bring a comps-based counter.
Risks & watch-outs
- Climate carrying-cost: severe wind risk, 99% chance of damaging wind over 30y; extreme-heat days projected 7→21/yr by 2055 (HVAC capex compounding) — expect insurance premiums to compound above CPI over the hold.
Questions for the listing agent
- It's been on market 37 days. Have you received any prior offers? Is the seller open to a 3% concession, seller financing, or rate buy-down credit?
- Is there a deadline driving the sale (1031 exchange, divorce, estate, relocation)? That informs how much negotiation room exists.
- Schools are B-rated — typically a magnet for longer-tenancy family renters. What's the average tenant stay here, and is there a school-zone premium baked into asking?
- What's the average days-on-market for RENTAL listings here right now (not sales)? A rising rental-DOM trend means longer vacancies and softer asking-rent achievability than the comps imply.
- What's the recent tenant-quality profile in this submarket — average credit score on applications, eviction rate, late-payment / NSF rate, and stable-employment percentage? A property-management company in the area should have these aggregated.
- How much new for-sale + rental construction is in the pipeline within 1–3 miles? Heavy new supply typically softens prices + rents 12–24 months out; constrained supply supports both.
Investment metrics
- 1% rule
- 1.04% ✓
- Cap rate
- 8.35%
- Cash-on-cash
- 7.34%
- DSCR
- 1.33
- GRM
- 8.0
CMA / ARV
- ARV (on-the-fly)
- $197,800
- Comps found
- 12
Show comp detail 12 sales within ~0.75 mi
| Address | Dist | Beds/Ba | Sqft | Sold | Price | $/sf | Match |
|---|---|---|---|---|---|---|---|
| 70400 J St | 0.19mi | 3/2.0 | 1,171 (+2%) | 5mo | $206,500 | $176 | 84 |
| 70405 F St | 0.27mi | 3/2.0 | 1,200 (+4%) | 1mo | $182,000 | $152 | 79 |
| 70448 D St | 0.30mi | 3/2.0 | 1,195 (+4%) | 3mo | $199,000 | $167 | 77 |
| 70292 I St | 0.40mi | 3/2.0 | 1,125 (-2%) | 9mo | $193,500 | $172 | 70 |
| 70421 G St | 0.21mi | 3/2.0 | 1,280 (+11%) | 3mo | $224,000 | $175 | 69 |
| 70408 3rd St | 0.60mi | 3/2.0 | 1,163 (+1%) | 1mo | $205,000 | $176 | 69 |
| 70412 First St | 0.51mi | 3/2.0 | 1,182 (+3%) | 4mo | $180,000 | $152 | 69 |
| 70261 K St | 0.46mi | 3/2.0 | 1,230 (+7%) | 2mo | $245,000 | $199 | 65 |
| 70284 K St | 0.41mi | 2/1.0 (-1) | 1,152 (+0%) | 9mo | $157,400 | $137 | 64 |
| 70400 B St | 0.42mi | 3/2.0 | 1,212 (+5%) | 10mo | $230,000 | $190 | 63 |
| 70381 L St | 0.25mi | 3/2.0 | 1,322 (+15%) | 1mo | $218,000 | $165 | 62 |
| 70512 4th St | 0.63mi | 2/2.0 (-1) | 1,100 (-4%) | 9mo | $58,000 | $53 | 51 |
Match score weights: distance 35% · size 25% · config 20% · recency 20%. Top-matched comps best support the ARV.
Projected returns pro-forma
-3.0% appreciation · 4.31% rent growth · sell at horizon
- IRR
- -3.7%
- Equity multiple
- 0.86×
- Total profit
- $-6,657
- Equity at exit
- $25,348
- IRR
- 7.4%
- Equity multiple
- 1.59×
- Total profit
- $27,956
- Equity at exit
- $14,698
Cash invested: $47,600 (down + closing). Projections, not guarantees.
Landlord ↔ Tenant lean methodology
- Overall (STATE)
- 90 Strongly Landlord-Friendly
- State Louisiana
- 90 Strongly Landlord-Friendly · R+12
- County
- — inherits STATE
- City
- — inherits STATE
ZIP-level market 70433
- Rents YoY
- 4.3%
- Active inventory
- 524
- Price-to-rent
- 8.0×
Monthly cashflow live
- Estimated rent
- $1,766 high interval (Pro) →
- Mortgage (P&I)
- −$891
- Tax from tax record
- −$141 /mo · $1,697/yr
- Insurance
- −$71
- HOA
- −$0
- Vacancy / Maint / Mgmt
- −$371
- Net cashflow
- $291
Break-even live
Sensitivity live
| Price | -10% $387 | -5% $339 | +0% $291 | +5% $243 | +10% $195 |
|---|---|---|---|---|---|
| Rent | -10% $152 | -5% $221 | +0% $291 | +5% $361 | +10% $431 |
| Rate | -1.0pp $377 | -0.5pp $334 | base $291 | +0.5pp $247 | +1.0pp $202 |
UW: 25.0% down · 7.5% · 30yr · 1.5% tax · 5.0% vac · 8.0% maint · 8.0% mgmt
Financing live
Cash to close
- Down payment
- $42,500
- Closing costs
- $5,100
- Reserves months
- —
- Total cash needed
- —
Loan-product check · same deal, 3 products live
Conventional
25% down · 7.5% · 30yr
- Down + closing
- —
- Monthly P&I
- —
- Monthly cashflow
- —
- DSCR
- —
- Eligible?
- —
Personal DTI + credit; lowest rate.
DSCR
20% down · 8.5% · 30yr
- Down + closing
- —
- Monthly P&I
- —
- Monthly cashflow
- —
- DSCR
- —
- Eligible?
- —
No personal income docs; deal must DSCR.
Hard money
10% down · 12.0% · 12mo
- Down + closing
- —
- Monthly P&I
- —
- Monthly cashflow
- —
- DSCR
- —
- Eligible?
- —
Short-term bridge; refi at stabilization.
Rent comps 19 comps
| Address | Beds | Baths | Sqft | Rent | $/sqft | DOM | Units | Dist |
|---|---|---|---|---|---|---|---|---|
| 70403 L St Covington, LA | 3.0 | 2.0 | 1250 | $1,695 | $1.36 | 44d | 1 | 0.21mi |
| 70361 D St Covington, LA | 3.0 | 2.0 | 1409 | $1,750 | $1.24 | 24d | 1 | 0.35mi |
| 70466 1st St Covington, LA | 3.0 | 2.0 | 1443 | $2,100 | $1.46 | 18d | 1 | 0.47mi |
| 70412 1st St Covington, LA | 3.0 | 2.0 | 1182 | $1,700 | $1.44 | 18d | 1 | 0.49mi |
| 70330 A St Covington, LA | 3.0 | 2.0 | 1163 | $1,600 | $1.38 | 20d | 1 | 0.52mi |
| 70439 8th St Covington, LA | 3.0 | 2.0 | 1267 | $1,500 | $1.18 | 24d | 1 | 0.80mi |
| 70293 7th St Covington, LA | 3.0 | 2.0 | 1450 | $1,695 | $1.17 | 44d | 1 | 0.83mi |
| 70300 7th St Covington, LA | 3.0 | 2.0 | 1448 | $1,750 | $1.21 | 24d | 1 | 0.85mi |
| 70371 10th St Covington, LA | 3.0 | 2.0 | 1212 | $1,695 | $1.40 | 44d | 1 | 0.91mi |
| 70252 8th St Covington, LA | 3.0 | 2.0 | 1230 | $1,650 | $1.34 | 24d | 1 | 0.94mi |
| 70040 2nd St Covington, LA | 3.0 | 2.0 | 1416 | $2,000 | $1.41 | 4d | 1 | 1.01mi |
| 70045 3rd St Covington, LA | 3.0 | 2.0 | 1430 | $1,750 | $1.22 | 4d | 1 | 1.02mi |
| 70076 6th St Covington, LA | 3.0 | 2.0 | 1151 | $1,600 | $1.39 | 24d | 1 | 1.07mi |
| 350 Emerald Forest Blvd Covington, LA | 1.0–2.0 | 1.0–2.0 | 845 | $1,600 | $1.89 | 12d | 2 | 1.09mi |
| 711 Lionel Ct Abita Springs, LA | 3.0 | 2.0 | 1497 | $2,000 | $1.34 | 24d | 1 | 1.10mi |
| 2021 Sullivan Ln Covington, LA | 1.0–2.0 | 1.0–2.0 | 860 | $1,856 | $2.16 | 3d | 18 | 1.15mi |
| 70096 10th St Covington, LA | 3.0 | 2.0 | 1391 | $1,950 | $1.40 | 18d | 1 | 1.24mi |
| 28 Park Place Dr Covington, LA | 1.0–3.0 | 1.0–2.0 | 963 | $1,407 | $1.46 | 2d | 9 | 1.25mi |
| 21096 Washington Ave Unit B Abita Springs, LA | 2.0 | 1.5 | 900 | $1,050 | $1.17 | 44d | 1 | 1.26mi |
Listing history 14 events
-
2024-12-13soldstatus $171,000 Closed 106-char remark
Show marketing remark (106 chars)
GREAT STARTER HOME CLOSE TO ALL AMENITIES. FEATURES 3BR, 2 BTHS, FENCED RER YARD, SHED AND CIRCULAR DRIVE.
-
2024-11-07historical Active Under Contract 106-char remark
Show marketing remark (106 chars)
GREAT STARTER HOME CLOSE TO ALL AMENITIES. FEATURES 3BR, 2 BTHS, FENCED RER YARD, SHED AND CIRCULAR DRIVE.
-
2024-10-01$170,000 Active 106-char remark
Show marketing remark (106 chars)
GREAT STARTER HOME CLOSE TO ALL AMENITIES. FEATURES 3BR, 2 BTHS, FENCED RER YARD, SHED AND CIRCULAR DRIVE.
-
2024-10-01$170,000 Active
Show marketing remark (106 chars)
GREAT STARTER HOME CLOSE TO ALL AMENITIES. FEATURES 3BR, 2 BTHS, FENCED RER YARD, SHED AND CIRCULAR DRIVE.
-
2016-08-26soldstatus $77,072 Sold 143-char remark
Show marketing remark (143 chars)
Great investment property! Home is all original so needs updating. Den has 16ft cathedral ceilings, bookcases framing the fireplace and mantel.
-
2016-08-03historical Pending Continue to Show 143-char remark
Show marketing remark (143 chars)
Great investment property! Home is all original so needs updating. Den has 16ft cathedral ceilings, bookcases framing the fireplace and mantel.
-
2016-07-30$90,000 Active 143-char remark
Show marketing remark (143 chars)
Great investment property! Home is all original so needs updating. Den has 16ft cathedral ceilings, bookcases framing the fireplace and mantel.
-
2016-07-30$90,000
Show marketing remark (143 chars)
Great investment property! Home is all original so needs updating. Den has 16ft cathedral ceilings, bookcases framing the fireplace and mantel.
-
2010-03-10$125,000
-
2010-03-10$125,000
-
2004-08-02soldstatus $105,000
-
2004-07-29soldstatus $105,000
-
2004-05-10$109,900
-
2004-05-10$109,900
ⓘ Source: listings_history table (triggers on properties + properties_extension) + one-shot
backfill from property_details.listing_events for pre-trigger history.
Tax reassessment forecast LA · Resets to sale price
- Current annual tax
- $1,697 · $141/mo
- Projected year-2 tax
- $1,697 · $141/mo
- Expected delta
- $0/yr ($0/mo · 0.0%)
ⓘ Screening estimate from a state-policy table — verify with the county assessor before closing.
Climate risk First Street
- Flood 1/10 Low 0% chance over 30 yrs
- Wildfire 4/10 Moderate
- Heat 9/10 Extreme 7 d/yr ≥109°F today · 21 d/yr by 30 yrs out
- Wind 9/10 Extreme 99% chance of damaging wind over 30 yrs
- Air quality 2/10 Low 0 unhealthy d/yr today · 1 by 30 yrs out
Nearby sold comps map
Loading sold comps map…
Walkable amenities ~0.75 mi
Loading nearby amenities…
Taxation est. · year 1
- Rental income
- $21,189
- − Mortgage interest
- −$9,523
- − Property taxes
- −$1,697
- − Insurance
- −$850
- − Repairs & maintenance
- −$1,695
- − Management
- −$1,695
- − Depreciation
- −$4,945
- Taxable income
- $784
- Est. tax owed @ 24.0%
- −$188
- After-tax cash flow
- $3,307/yr
For passive investors: Depreciation is non-cash, so a rental often shows a tax loss while cash-flowing — sheltering income. Rental losses are passive: they offset passive income freely, and up to $25,000/yr can offset ordinary (W-2) income if you actively participate and your MAGI is under $100k (phasing out to $0 by $150k); unused losses carry forward. On sale, claimed depreciation is recaptured at up to 25%, and gains may owe capital-gains tax (a 1031 exchange can defer both). Figures are a year-1 estimate at your 24.0% rate — not tax advice; consult a CPA.
Schools (NCES district)
- District
- St. Tammany Parish
- NCES district ID
- 2201650
- Math proficiency
- 43% ▼ -32.00%
- Reading proficiency
- 55% ▼ -26.00%
- Median HH income
- $61,752
- Composite
- 43.04/100
- National rank
- #3098
- State rank
- #11 of 98 in LA
Livability — Covington
- Score
- 75/100
- State rank
- #17
- US rank
- #3876
Category grades
Schools grade is shown separately in the Schools card above.
Census & demographics
- County
- Saint Tammany Parish · 228,296 people
- City population
- 64,351
- Metro
- New Orleans-Metairie, LA
- Population (ZIP)
- 41,876
- Household income
- $81,241
- Rent vs Own
- Severe rent burden
- 1287.0
Population outlook (St. Tammany County) Hauer SSP2
- Today (2025)
- 286,725 people
- By 2030
- 304,175 · +6.1%
- By 2040
- 336,203 · +17.3%
- By 2050
- 364,590 · +27.2%
- By 2075
- 433,362 · +51.1%
- By 2100
- 470,333 · +64.0%
Race, ethnicity, and origin ACS 2023
- Neighborhood character
- Predominantly White (78%)
- Race & ethnicity
- White 78% Black 9% Hispanic / Latino 7% Two or more races 7% Native American 1% Asian 1%
- Hispanic origin (detail)
- Mexican 2%
- Common ancestry
- Lithuanian 17% Italian 2% Slovak 2%
- Foreign-born
- 5% · Canada, Vietnam
- Languages at home
- 92% English-only · Spanish 5% French/Haitian/Cajun 1% Vietnamese 1%
Political lean MEDSL · St. Tammany
- 2024 margin
- Solid R (+43.8) · D 27.3% · R 71.1% · Other 1.6%
- 2008→2024 swing
- +9.6pp toward D · 2008: -53.4pp · 2024: -43.8pp
- All cycles
- 2024: R+43.8 2020: R+44.2 2016: R+50.8 2012: R+52.2 2008: R+53.4
Not yet ingested
- Civics
- —
Market trends
- HPI YoY
- ▼ -112.14%
- Current HPI
- 181.8348
- Rent YoY
- ▲ 4.31%
- Metro
- New Orleans-Metairie, LA
- State GDP YoY
- ▲ 3.29%
- F500 in state
- 10
Industry mix (Fortune 500 HQ in LA)
| Industry | F500 HQs | Revenue |
|---|---|---|
| Telecommunications | 2 | $23B |
|
||
| Utilities | 1 | $12B |
|
||
| Wholesale / Distribution | 1 | $5B |
|
||
| Advertising | 1 | $2B |
|
||
Price history
+55.6% since first listed14 events — show timeline
- 2024-12-13 Sold (MLS) $171,000 GSREIN
- 2024-11-07 Contingent — GSREIN
- 2024-10-01 Listed $170,000 AcadianaMLS
- 2024-10-01 Listed $170,000 GSREIN
- 2016-08-26 Sold (MLS) $77,072 GSREIN
- 2016-08-03 Contingent — GSREIN
- 2016-07-30 Listed $90,000 GSREIN
- 2016-07-30 Listed $90,000 AcadianaMLS
- 2010-03-10 Listed $125,000 GSREIN
- 2010-03-10 Listed $125,000 AcadianaMLS
- 2004-08-02 Sold (Public Records) $105,000 Public Records
- 2004-07-29 Sold (MLS) $105,000 GSREIN
- 2004-05-10 Listed $109,900 GSREIN
- 2004-05-10 Listed $109,900 AcadianaMLS
Property tax history
+1.7%/yrLatest (2025): $1,697 · +8.7% YoY. Source: county tax records.
Cash-flow waterfall
monthlySold comps — $/sqft
last 12 mo · ≤1 miLoading sold comps…