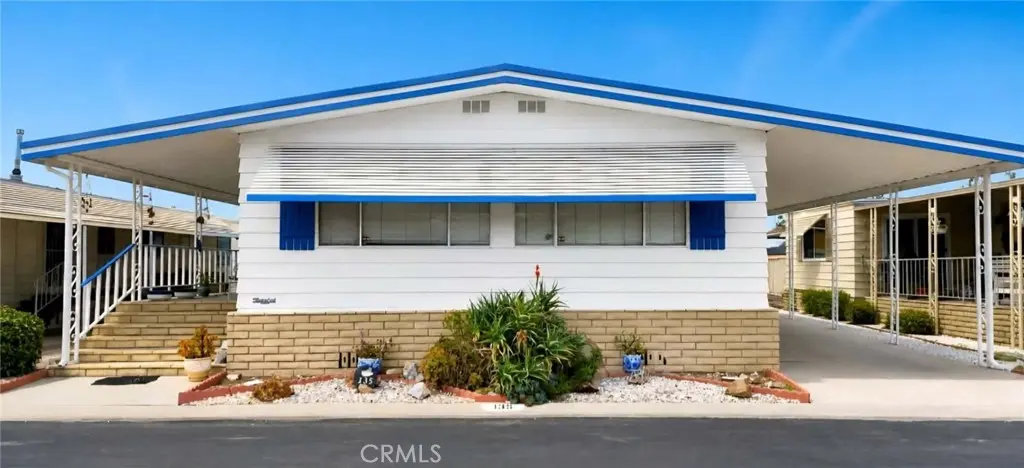
6741 Lincoln Ave #135 · Buena Park, CA
Flood risk 1/10 · Minimal
- FEMA flood zone
- X (shaded)
- Chance of flooding over 30 yrs
- 0.0%
- Est. flood insurance / yr
- $507 – $1,088
Fire risk 1/10 · Minimal
- Est. fire insurance / yr
- $659 – $1,223
Heat risk 5/10 · Moderate
- Hot days now (above 91°F)
- 7 days/yr
- Hot days in 30 yrs
- 23 days/yr
Wind risk 1/10 · Minimal
- Chance of severe wind over 30 yrs
- —
Air-quality risk 5/10 · Moderate
- Unhealthy air days now
- 7 days/yr
- Unhealthy air days in 30 yrs
- 8 days/yr
Risk factors via First Street. Map © Google.
Why this score? — see what drove the B+ grade
The composite is a weighted blend of 9 inputs, each scored 0–100. Each bar is that input's sub-score; the figure is the points it added to the 100-point composite (weight × sub-score).
- Cash flow +30.0/30.0
- ARV discount +12.0/15.0
- 1% rule +10.0/10.0
- DSCR +10.0/10.0
- Schools +5.5/10.0
- Condition / age +3.8/5.0
- Livability +3.4/5.0
- Rent growth +2.8/5.0
- Appreciation +0.0/10.0
$171,000
🖨 Deal sheet (PDF) 📄 Offer letter ✓ Due diligence
Listing remarks
Located within the welcoming Buena Villa Mobile Estates, a well-maintained community designed for comfortable, relaxed living. This home is an excellent fit for a senior buyer seeking a peaceful environment with a strong sense of neighborhood and ease of maintenance. What truly sets Buena Villa apart is its flexible occupancy policy. While it’s a senior-focused community, it allows a second occupant who can be 18 years or older—an uncommon and highly desirable feature for those who wish to live with a younger family member, caregiver, or companion. The surrounding area enhances the lifestyle even further. Buena Park offers convenient access to shopping centers, grocery stores, m
Key facts
- 3 parking spots
- Community pool
- Built 1975
Property features AI
Finance
- Other: Manager approval required for residency; Pets: contact manager/park for policy
- Financial info: Land lease applies
- HOA & community: Senior community; Park name: Buena Villa
Exterior
- Parking: Carport with 3 parking spaces; Located in Buena Villa park
- Utilities: Public sewer; District/Public water
- Home design: Mobile home (Viking model); Single-story; Mobile width approximately 24 ft and length approximately 60 ft; Mobile home remains in place
- Construction: Year built per builder source
- Exterior features: Community pool; Street lighting; Rural community setting; One shed on the property; 0–1 unit per acre lot characteristic
Interior
- Bathrooms: 2 full bathrooms
- Heating & cooling: Central heating (furnace); Central cooling
- Interior features: One-level home; Entry at ground level
- Laundry & utility: Washer hookup; Gas and electric dryer hookup
Neighborhood map
What this means for you Summary
Snapshot
- This is a 2-bed/2.0-bath manufactured listed at $171k. Condition is rated good.
Deal economics
- At list price, monthly cash flow is $1k ($15k/yr) — positive.
- The deal already cash-flows at list — no discount required.
- Meets the 1% rule at list price ($3k rent vs $171k).
- Recommended offer: $166k (3.0% below list) — sets the bar for market timing.
- Cap rate 15.1% vs local median 2.2% in Buena Park — top-decile yield for the area; either an underpriced asset or a hidden risk that comps aren't pricing in. Stress-test before assuming the spread holds.
Location & tenants
- Location reads 68/100 on livability (#300 in CA) — a middle-class / working-renter tenant base. Strengths: commute A+, employment A+, amenities A; Watch: schools C-, health & safety D, cost of living F.
- Centralia Elementary (suburban): math 59% / reading 63% proficiency, ranked #213 of 1,400 in CA (top 15%) — acceptable for families but not a draw, mixed tenant base, ~2y average lease.
- Market conditions: Rents rising (+1.3%/yr); 47 active listings in the ZIP; 40 comparable units currently listed for rent nearby; rentals leasing fast (median 2d on market — plan ~1-2 weeks tenant-placement turnaround); high-income renter base; 6,974 units permitted in Orange County in 2024 (3,839 in 5+ unit buildings).
Forward outlook
- Local home prices are declining (-3.0%/yr); year-one equity from $1k of loan paydown is wiped out by about $5k of value loss. Plan a longer hold.
- Orange County population projected at +14% by 2050 — modest demand growth; plan on rents tracking national, not racing it.
- At projected returns (-3.0% appreciation + 1.3% rent growth), your $48k cash investment doubles in ~5 years — after that, you're playing with house money.
Negotiation context
- It's been on market 34 days — a 3% lower offer ($166k) is reasonable based on typical stale-listing flexibility.
Risks & watch-outs
- Climate carrying-cost: extreme-heat days projected 7→23/yr by 2055 (HVAC capex compounding) — expect insurance premiums to compound above CPI over the hold.
Questions for the listing agent
- It's been on market 34 days. Have you received any prior offers? Is the seller open to a 3% concession, seller financing, or rate buy-down credit?
- Built in 1975 — when were the roof, HVAC, electrical panel, plumbing, and water heater last replaced?
- Is there a deadline driving the sale (1031 exchange, divorce, estate, relocation)? That informs how much negotiation room exists.
- What's the average days-on-market for RENTAL listings here right now (not sales)? A rising rental-DOM trend means longer vacancies and softer asking-rent achievability than the comps imply.
- What's the recent tenant-quality profile in this submarket — average credit score on applications, eviction rate, late-payment / NSF rate, and stable-employment percentage? A property-management company in the area should have these aggregated.
- How much new for-sale + rental construction is in the pipeline within 1–3 miles? Heavy new supply typically softens prices + rents 12–24 months out; constrained supply supports both.
Investment metrics
- 1% rule
- 1.80% ✓
- Cap rate
- 15.08%
- Cash-on-cash
- 31.38%
- DSCR
- 2.40
- GRM
- 4.6
CMA / ARV
- ARV (on-the-fly)
- $190,080
- Comps found
- 11
Show comp detail 11 sales within ~0.75 mi
| Address | Dist | Beds/Ba | Sqft | Sold | Price | $/sf | Match |
|---|---|---|---|---|---|---|---|
| 6741 Lincoln Ave #108 | 0.03mi | 2/2.0 | 1,500 (+4%) | 0mo | $150,000 | $100 | 91 |
| 6741 Lincoln Ave #165 | 0.03mi | 2/2.0 | 1,422 (-1%) | 14mo | $236,000 | $166 | 85 |
| 6741 Lincoln Ave #24 | 0.03mi | 2/2.0 | 1,440 (0%) | 18mo | $170,000 | $118 | 84 |
| 6741 Lincoln Ave #76 | 0.03mi | 2/2.0 | 1,440 (0%) | 23mo | $189,500 | $132 | 79 |
| 6741 Lincoln Ave #26 | 0.06mi | 2/2.0 | 1,590 (+10%) | 1mo | $230,000 | $145 | 79 |
| 6741 Lincoln Ave #152 | 0.03mi | 3/2.0 (+1) | 1,440 (0%) | 19mo | $185,000 | $128 | 78 |
| 6741 Lincoln Ave #156 | 0.10mi | 2/2.0 | 1,440 (0%) | 21mo | $195,000 | $135 | 78 |
| 6741 Lincoln #107 | 0.03mi | 3/2.0 (+1) | 1,300 (-10%) | 1mo | $150,000 | $115 | 76 |
| 6741 Lincoln Ave #155 | 0.03mi | 2/2.0 | 1,600 (+11%) | 7mo | $285,000 | $178 | 74 |
| 6741 Lincoln Ave #114 | 0.14mi | 2/2.0 | 1,440 (0%) | 24mo | $147,500 | $102 | 74 |
| 6741 Lincoln Ave #28 | 0.06mi | 2/2.0 | 1,640 (+14%) | 15mo | $220,000 | $134 | 62 |
Match score weights: distance 35% · size 25% · config 20% · recency 20%. Top-matched comps best support the ARV.
Projected returns pro-forma
-3.0% appreciation · 1.33% rent growth · sell at horizon
- IRR
- 24.3%
- Equity multiple
- 1.98×
- Total profit
- $46,999
- Equity at exit
- $25,497
- IRR
- 31.1%
- Equity multiple
- 3.58×
- Total profit
- $123,605
- Equity at exit
- $14,785
Cash invested: $47,880 (down + closing). Projections, not guarantees.
Landlord ↔ Tenant lean methodology
- Overall (STATE)
- 18 Strongly Tenant-Friendly
- State California
- 18 Strongly Tenant-Friendly · D+13
- County
- — inherits STATE
- City
- — inherits STATE
ZIP-level market 90620
- Rents YoY
- 1.3%
- Active inventory
- 47
- Price-to-rent
- 4.6×
Monthly cashflow live
- Estimated rent
- $3,081 high interval (Pro) →
- Mortgage (P&I)
- −$897
- Tax est. 1.5%
- −$214 /mo · $2,565/yr
- Insurance
- −$71
- HOA
- −$0
- Vacancy / Maint / Mgmt
- −$647
- Net cashflow
- $1,252
Break-even live
Sensitivity live
| Price | -10% $1,370 | -5% $1,311 | +0% $1,252 | +5% $1,193 | +10% $1,134 |
|---|---|---|---|---|---|
| Rent | -10% $1,009 | -5% $1,131 | +0% $1,252 | +5% $1,374 | +10% $1,496 |
| Rate | -1.0pp $1,338 | -0.5pp $1,296 | base $1,252 | +0.5pp $1,208 | +1.0pp $1,163 |
UW: 25.0% down · 7.5% · 30yr · 1.5% tax · 5.0% vac · 8.0% maint · 8.0% mgmt
Financing live
Cash to close
- Down payment
- $42,750
- Closing costs
- $5,130
- Reserves months
- —
- Total cash needed
- —
Loan-product check · same deal, 3 products live
Conventional
25% down · 7.5% · 30yr
- Down + closing
- —
- Monthly P&I
- —
- Monthly cashflow
- —
- DSCR
- —
- Eligible?
- —
Personal DTI + credit; lowest rate.
DSCR
20% down · 8.5% · 30yr
- Down + closing
- —
- Monthly P&I
- —
- Monthly cashflow
- —
- DSCR
- —
- Eligible?
- —
No personal income docs; deal must DSCR.
Hard money
10% down · 12.0% · 12mo
- Down + closing
- —
- Monthly P&I
- —
- Monthly cashflow
- —
- DSCR
- —
- Eligible?
- —
Short-term bridge; refi at stabilization.
Rent comps 40 comps
| Address | Beds | Baths | Sqft | Rent | $/sqft | DOM | Units | Dist |
|---|---|---|---|---|---|---|---|---|
| 3518 W Del Monte Dr Unit 7 Anaheim, CA | 2.0 | 1.5 | 900 | $2,195 | $2.44 | 17d | 1 | 0.28mi |
| 217 S Knott Ave Anaheim, CA | 2.0 | 2.0 | 912 | $2,450 | $2.69 | 2d | 1 | 0.30mi |
| 7049 Fillmore Dr Buena Park, CA | 3.0 | 2.0 | 1358 | $3,995 | $2.94 | 4d | 1 | 0.39mi |
| 7049 Fillmore Dr Buena Park, CA | 3.0 | 2.0 | 1354 | $3,995 | $2.95 | 2d | 1 | 0.39mi |
| 3401 W Del Monte Dr Anaheim, CA | 2.0 | 1.0 | 880 | $2,375 | $2.70 | 2d | 2 | 0.39mi |
| 3320 W Mirano Dr Anaheim, CA | 3.0 | 2.5 | 1591 | $3,850 | $2.42 | 2d | 1 | 0.45mi |
| 6386 Lincoln Ave Buena Park, CA | 1.0 | 1.0 | 900 | $2,400 | $2.67 | 2d | 1 | 0.45mi |
| 6386 Lincoln Ave Buena Park, CA | 1.0 | 1.0 | 900 | $2,400 | $2.67 | 4d | 1 | 0.45mi |
| 3300 W Lincoln Ave Anaheim, CA | 1.0–2.0 | 1.0–2.0 | 809 | $2,800 | $3.46 | 2d | 3 | 0.47mi |
| 145 S Westchester Dr Anaheim, CA | 1.0–2.0 | 1.0 | 800 | $2,595 | $3.24 | 2d | 4 | 0.52mi |
| 6490 Crescent Ave Buena Park, CA | 2.0 | 1.0–2.0 | 915 | $2,400 | $2.62 | 2d | 1 | 0.53mi |
| 3601 W Orange Ave Anaheim, CA | 2.0 | 1.0 | 900 | $2,695 | $2.99 | 2d | 1 | 0.53mi |
| 6460 Crescent Ave Apt 8 Buena Park, CA | 2.0 | 2.0 | 970 | $2,400 | $2.47 | 2d | 1 | 0.55mi |
| 3931 W Orange Ave Anaheim, CA | 1.0–2.0 | 1.0 | 847 | $2,699 | $3.18 | 2d | 6 | 0.57mi |
| 3233 W Lincoln Ave Anaheim, CA | 1.0–2.0 | 1.0–2.0 | 855 | $2,700 | $3.16 | 2d | 5 | 0.62mi |
| 8291 San Helice Cir Buena Park, CA | 3.0 | 2.0 | 1585 | $3,000 | $1.89 | 16d | 1 | 0.62mi |
| 8291 San Helice Cir Buena Park, CA | 3.0 | 2.0 | 1585 | $3,500 | $2.21 | 2d | 1 | 0.62mi |
| 111 N Western Ave Anaheim, CA | 1.0–2.0 | 1.0 | 846 | $2,140 | $2.53 | 2d | 1 | 0.64mi |
| 3428 W Orange Ave Anaheim, CA | 1.0–2.0 | 1.0–2.0 | 800 | $2,650 | $3.31 | 2d | 5 | 0.66mi |
| 3354 W Orange Ave Anaheim, CA | 2.0 | 1.0 | 1060 | $2,400 | $2.26 | 2d | 1 | 0.71mi |
| 6418 Orange Ave Cypress, CA | 1.0–2.0 | 1.0–2.0 | 858 | $2,500 | $2.91 | 2d | 2 | 0.73mi |
| 704 S Knott Ave Anaheim, CA | 2.0 | 1.0 | 880 | $2,250 | $2.56 | 2d | 1 | 0.78mi |
| 7490 Santa Elena Dr Buena Park, CA | 3.0 | 1.5 | 1409 | $6,000 | $4.26 | 2d | 1 | 0.87mi |
| 3625 W Savanna St Anaheim, CA | 2.0 | 2.0 | 1060 | $2,595 | $2.45 | 2d | 1 | 0.88mi |
| 8031 San Huerta Cir Buena Park, CA | 3.0 | 2.0 | 1090 | $3,750 | $3.44 | 2d | 1 | 0.88mi |
| 6051 Lemon Ave Unit C Cypress, CA | 2.0 | 1.0 | 900 | $2,395 | $2.66 | 2d | 1 | 0.89mi |
| 6051 Lemon Ave Unit C Cypress, CA | 2.0 | 1.0 | 900 | $2,395 | $2.66 | 11d | 1 | 0.89mi |
| 6156 Orange Ave Cypress, CA | 3.0 | 2.5 | 1193 | $3,850 | $3.23 | 2d | 1 | 0.90mi |
| 6032 Lime Ave Cypress, CA | 3.0 | 2.0 | 1350 | $7,700 | $5.70 | 2d | 1 | 0.94mi |
| 909 S Knott Ave Anaheim, CA | 1.0–2.0 | 1.0 | 880 | $2,695 | $3.06 | 2d | 1 | 0.97mi |
| 120 S Grand Ave Unit 84 Anaheim, CA | 2.0 | 1.0 | 875 | $2,725 | $3.11 | 2d | 1 | 0.98mi |
| 3070 W Del Monte Dr Anaheim, CA | 1.0–2.0 | 1.0 | 858 | $2,650 | $3.09 | 2d | 5 | 1.03mi |
| 6741 Ball Rd Buena Park, CA | 2.0 | 1.5 | 1000 | $2,495 | $2.50 | 2d | 1 | 1.06mi |
| 9951 Holder St Cypress, CA | 3.0 | 1.5 | 1200 | $3,395 | $2.83 | 2d | 3 | 1.07mi |
| 3427 W Ball Rd Anaheim, CA | 2.0 | 1.0 | 900 | $2,350 | $2.61 | 24d | 1 | 1.08mi |
| 460 N Santa Maria St Anaheim, CA | 3.0 | 2.5 | 1765 | $3,800 | $2.15 | 19d | 1 | 1.11mi |
| 9950 Juanita St Cypress, CA | 1.0–2.0 | 1.0 | 820 | $2,935 | $3.58 | 2d | 9 | 1.12mi |
| 7334 El Domino Way Buena Park, CA | 2.0 | 2.0 | 1050 | $2,700 | $2.57 | 2d | 1 | 1.14mi |
| 8465 Kington Way #15 Cypress, CA | 2.0 | 2.5 | 1204 | $3,500 | $2.91 | 11d | 1 | 1.31mi |
| 3208 W Ravenswood Dr Anaheim, CA | 3.0 | 2.0 | 1636 | $4,000 | $2.44 | 13d | 1 | 1.35mi |
Listing history 16 events
-
2026-06-18days on market $171,000 Active 34 DOM
-
2026-06-17days on market $171,000 Active 33 DOM
-
2026-06-16days on market $171,000 Active 32 DOM
-
2026-06-15days on market $171,000 Active 31 DOM
-
2026-06-13days on market $171,000 Active 29 DOM
-
2026-06-13days on market $171,000 Active 28 DOM
-
2026-06-09days on market $171,000 Active 25 DOM
-
2026-06-08days on market $171,000 Active 24 DOM
-
2026-06-07days on market $171,000 Active 23 DOM
-
2026-06-04days on market $171,000 Active 20 DOM
-
2026-06-03days on market $171,000 Active 19 DOM
-
2026-06-02days on market $171,000 Active 18 DOM
-
2026-06-01days on market $171,000 Active 17 DOM
-
2026-05-31days on market $171,000 Active 16 DOM
-
2026-05-15$171,000 Active
-
2026-05-01historical $171,000
ⓘ Source: listings_history table (triggers on properties + properties_extension) + one-shot
backfill from property_details.listing_events for pre-trigger history.
Climate risk First Street
- Flood 1/10 Low FEMA zone X (shaded) · 0% chance over 30 yrs
- Wildfire 1/10 Low
- Heat 5/10 Major 7 d/yr ≥91°F today · 23 d/yr by 30 yrs out
- Wind 1/10 Low
- Air quality 5/10 Major 7 unhealthy d/yr today · 8 by 30 yrs out
Nearby sold comps map
Loading sold comps map…
Walkable amenities ~0.75 mi
Loading nearby amenities…
Taxation est. · year 1
- Rental income
- $36,972
- − Mortgage interest
- −$9,579
- − Property taxes
- −$2,565
- − Insurance
- −$855
- − Repairs & maintenance
- −$2,958
- − Management
- −$2,958
- − Depreciation
- −$4,975
- Taxable income
- $13,083
- Est. tax owed @ 24.0%
- −$3,140
- After-tax cash flow
- $11,887/yr
For passive investors: Depreciation is non-cash, so a rental often shows a tax loss while cash-flowing — sheltering income. Rental losses are passive: they offset passive income freely, and up to $25,000/yr can offset ordinary (W-2) income if you actively participate and your MAGI is under $100k (phasing out to $0 by $150k); unused losses carry forward. On sale, claimed depreciation is recaptured at up to 25%, and gains may owe capital-gains tax (a 1031 exchange can defer both). Figures are a year-1 estimate at your 24.0% rate — not tax advice; consult a CPA.
Condition & rehab AI · 12 photos
This manufactured home is in good condition with minor repairs needed, particularly in the living room. Painting and replacing the carpet can significantly boost its resale and rental value.
Repairs flagged
- Minor Living room carpet — The carpet in the living room appears worn and could be replaced for a fresh look.
Value-add opportunities
- Resale Paint interior walls — Fresh paint can make a significant difference in the home's appearance and value.
- Resale Replace living room carpet — A new carpet can enhance the home's appeal and increase its value.
- Both Landscaping improvements — Improved landscaping can enhance curb appeal and attract more potential buyers or renters.
Renovation cost estimate screening
| Repair item | Severity | Est. cost |
|---|---|---|
| Living room carpet · The carpet in the living room appears worn and could be replaced for a fresh look. | Minor | $500–3,000 |
| Total estimated repair cost · 1 items | $500–3,000 |
Value-add ROI direction
- Resale Paint interior walls — Fresh paint can make a significant difference in the home's appearance and value. ↑
- Resale Replace living room carpet — A new carpet can enhance the home's appeal and increase its value. ↑
- Both Landscaping improvements — Improved landscaping can enhance curb appeal and attract more potential buyers or renters. ↑
ⓘ Cost ranges are severity-bucket heuristics (US national rule-of-thumb). Get contractor quotes + a written scope before underwriting a rehab budget.
Schools (NCES district)
- District
- Centralia Elementary
- NCES district ID
- 0608070
- Math proficiency
- 59% ▲ 1.00%
- Reading proficiency
- 63% ▬ 0.00%
- Median HH income
- $66,022
- Composite
- 55.0/100
- National rank
- #2782
- State rank
- #213 of 1400 in CA
Livability — Buena Park
- Score
- 68/100
- State rank
- #300
- US rank
- #10072
Category grades
Schools grade is shown separately in the Schools card above.
Census & demographics
- Census place
- Buena Park, CA
- County
- Orange County · 3,096,323 people
- City population
- 82,592
- Metro
- Los Angeles-Long Beach-Anaheim, CA
- Population (ZIP)
- 46,608
- Household income
- $126,094
- Rent vs Own
- Severe rent burden
- 1075.0
Population outlook (Orange County) Hauer SSP2
- Today (2025)
- 3,477,456 people
- By 2030
- 3,613,117 · +3.9%
- By 2040
- 3,835,945 · +10.3%
- By 2050
- 3,968,736 · +14.1%
- By 2075
- 4,097,053 · +17.8%
- By 2100
- 3,903,633 · +12.3%
Race, ethnicity, and origin ACS 2023
- Neighborhood character
- Diverse neighborhood (Simpson 0.70)
- Race & ethnicity
- Hispanic / Latino 39% Asian 29% White 26% Two or more races 16% Black 2% Native American 1%
- Hispanic origin (detail)
- Mexican 32% Puerto Rican 1%
- Common ancestry
- Iranian 1% Lithuanian 1% Romanian 1%
- Foreign-born
- 32% · Canada, South Korea, Vietnam
- Languages at home
- 53% English-only · Spanish 22% Tagalog/Filipino 8% Korean 5%
Political lean MEDSL · Orange
- 2024 margin
- Toss-up / Even · D 49.7% · R 47.1% · Other 3.2%
- 2008→2024 swing
- +5.2pp toward D · 2008: -2.6pp · 2024: 2.6pp
- All cycles
- 2024: D+2.6 2020: D+9.0 2016: D+7.7 2012: R+8.3 2008: R+2.6
Not yet ingested
- Civics
- —
Market trends
- HPI YoY
- ▼ -964.20%
- Current HPI
- 411.2003
- Rent YoY
- ▲ 1.33%
- Metro
- Los Angeles-Long Beach-Anaheim, CA
- State GDP YoY
- ▲ 3.21%
- F500 in state
- 116
Industry mix (Fortune 500 HQ in CA)
| Industry | F500 HQs | Revenue |
|---|---|---|
| Technology | 27 | $1,492B |
|
||
| Financial Services | 3 | $174B |
|
||
| Retail | 3 | $44B |
|
||
| Insurance | 3 | $26B |
|
||
| Media / Entertainment | 2 | $115B |
|
||
| Pharmaceuticals / Biotech | 2 | $62B |
|
||
Price history
+0.0% since first listed2 events — show timeline
- 2026-05-15 Listed $171,000 CRMLS
- 2026-05-01 Coming Soon $171,000 CRMLS
Cash-flow waterfall
monthlySold comps — $/sqft
last 12 mo · ≤1 miLoading sold comps…