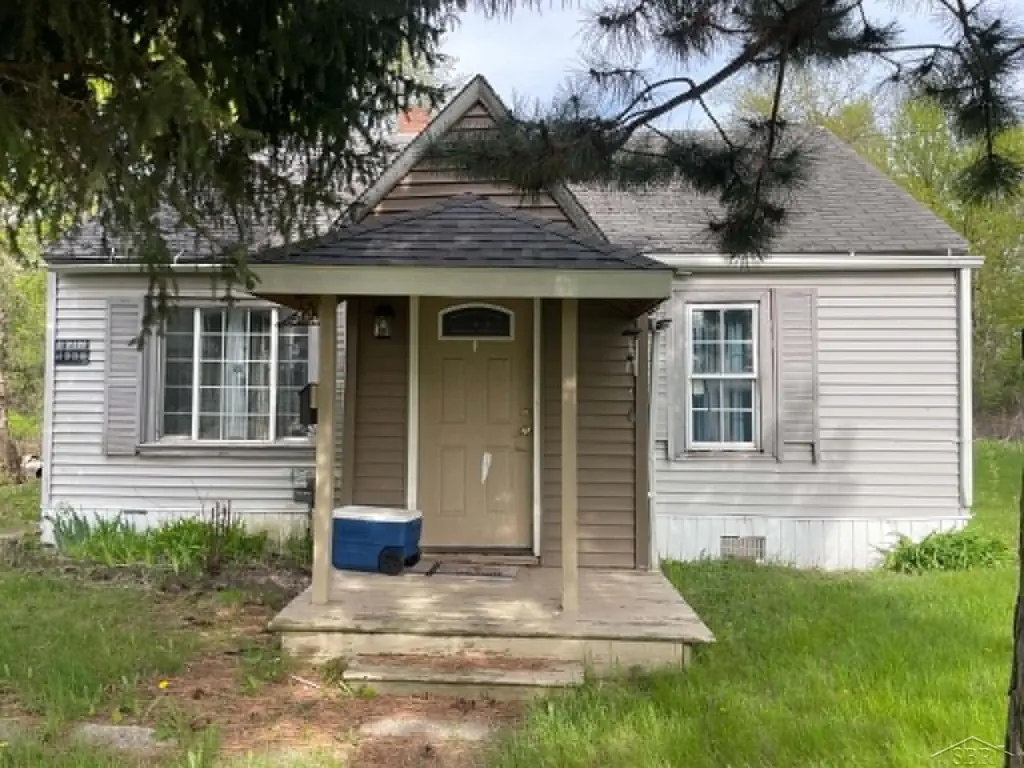
2712 Collingwood St · Saginaw, MI
Flood risk 1/10 · Minimal
- FEMA flood zone
- X (unshaded)
- Chance of flooding over 30 yrs
- 0.0%
- Est. flood insurance / yr
- $507 – $1,088
Fire risk 1/10 · Minimal
- Est. fire insurance / yr
- $784 – $1,456
Heat risk 2/10 · Minimal
- Hot days now (above 100°F)
- 7 days/yr
- Hot days in 30 yrs
- 14 days/yr
Wind risk 1/10 · Minimal
- Chance of severe wind over 30 yrs
- —
Air-quality risk 2/10 · Minimal
- Unhealthy air days now
- 1 days/yr
- Unhealthy air days in 30 yrs
- 2 days/yr
Risk factors via First Street. Map © Google.
Why this score? — see what drove the D grade
The composite is a weighted blend of 9 inputs, each scored 0–100. Each bar is that input's sub-score; the figure is the points it added to the 100-point composite (weight × sub-score).
- Cash flow +15.0/30.0
- ARV discount +7.5/15.0
- 1% rule +5.0/10.0
- DSCR +5.0/10.0
- Livability +3.2/5.0
- Rent growth +2.5/5.0
- Condition / age +2.5/5.0
- Schools +2.0/10.0
- Appreciation +0.0/10.0
$20,000
🖨 Deal sheet (PDF) 📄 Offer letter ✓ Due diligence
Listing remarks MLS
Calling all investors, flippers, and handy buyers! This 2-bedroom ranch-style home offers main floor living and plenty of potential for your next project. With the right vision and renovations, this property could make a great investment or rental opportunity. The home does need repairs and updates, including a roof and plumbing work, and is being sold as-is. Perfect for someone looking to renovate and add value. Don’t miss the chance to bring this property back to life!
Key facts
- 6,534 sq ft lot
- Built 1940
- Listed 38 days
Property features AI
Finance
- Other: Approximately 900 square feet above grade
- HOA & community: Homeowners association present
Exterior
- Utilities: Public water; Public sewer
- Home design: Single-family residence; One-story
- Construction: Aluminum and vinyl siding
- Exterior features: Lot in SAGINAW IMPROV CO ADD C subdivision; Located near Hess / Gallagher St
Interior
- Bathrooms: 1 full bathroom
- Heating & cooling: Forced air heating (natural gas); No cooling
- Interior features: 3 total rooms; Full basement
Neighborhood map
What this means for you Summary
Snapshot
- This is a 2-bed/1.0-bath single-family listed at $20k.
Deal economics
- At list price, monthly cash flow is $685 ($8k/yr) — positive.
- The deal already cash-flows at list — no discount required.
- Meets the 1% rule at list price ($1k rent vs $20k).
- Recommended offer: $19k (3.0% below list) — sets the bar for market timing.
- Cap rate 47.4% vs local median 8.2% in Saginaw — top-decile yield for the area; either an underpriced asset or a hidden risk that comps aren't pricing in. Stress-test before assuming the spread holds.
Location & tenants
- Location reads 63/100 on livability (#521 in MI) — a middle-class / working-renter tenant base. Strengths: cost of living A+, housing A+, health & safety A+; Watch: schools F, crime F, amenities F.
- Saginaw School District (urban): math 20% / reading 29% proficiency, ranked #444 of 540 in MI (top 82%) — low school quality limits family demand, transient renter base, plan for 1-2y turnover; 76% free/reduced lunch — lower-income household profile, screen leases tightly.
- Market conditions: 201 active listings in the ZIP; 3 comparable units currently listed for rent nearby; rentals lingering (median 45d on market — plan ~5-8 weeks vacancy on turnover, expect pricing pressure); 100% of comp listings sitting > 30 days — soft ceiling on asking rent; 154 units permitted in Saginaw County in 2024 (0 in 5+ unit buildings).
Forward outlook
- Local home prices are declining (-3.0%/yr); year-one equity from $138 of loan paydown is wiped out by about $600 of value loss. Plan a longer hold.
- Saginaw County population projected at -25% by 2050 — secular population decline; favor cash flow + early exit over multi-decade hold.
- At projected returns (-3.0% appreciation + 3.0% rent growth), your $6k cash investment doubles in ~1 year — after that, you're playing with house money.
Negotiation context
- It's been on market 38 days — a 3% lower offer ($19k) is reasonable based on typical stale-listing flexibility.
- 2 sale attempts with the ask held roughly flat each time — persistent listings suggest the price (not the market) is what's stuck; bring a comps-based counter.
Risks & watch-outs
- Watch-outs: property tax is 3.0% of price; built in 1940 — expect roof / HVAC / electrical / plumbing capex.
Questions for the listing agent
- It's been on market 38 days. Have you received any prior offers? Is the seller open to a 3% concession, seller financing, or rate buy-down credit?
- Built in 1940 — when were the roof, HVAC, electrical panel, plumbing, and water heater last replaced?
- Property tax is high relative to price — has the assessment been appealed recently, and will the sale trigger a re-assessment?
- Is there a deadline driving the sale (1031 exchange, divorce, estate, relocation)? That informs how much negotiation room exists.
- Schools are F-rated, which usually means shorter tenancies and higher turnover. Who's the typical renter profile here, and what's been the actual vacancy rate?
- Crime grade is F in this area — have there been break-ins, vandalism, or insurance claims at this property in the last 3 years? What carrier currently insures it and at what premium?
- The area grade is low — what's the realistic commute time and amenity access for the typical tenant pool here? Any planned neighborhood developments (good or bad) we should know about?
- What's the average days-on-market for RENTAL listings here right now (not sales)? A rising rental-DOM trend means longer vacancies and softer asking-rent achievability than the comps imply.
- What's the recent tenant-quality profile in this submarket — average credit score on applications, eviction rate, late-payment / NSF rate, and stable-employment percentage? A property-management company in the area should have these aggregated.
- How much new for-sale + rental construction is in the pipeline within 1–3 miles? Heavy new supply typically softens prices + rents 12–24 months out; constrained supply supports both.
Investment metrics
- 1% rule
- 5.37% ✓
- Cap rate
- 47.38%
- Cash-on-cash
- 146.73%
- DSCR
- 7.53
- GRM
- 1.6
CMA / ARV
- ARV (on-the-fly)
- $43,200
- Comps found
- 12
Show comp detail 12 sales within ~0.75 mi
| Address | Dist | Beds/Ba | Sqft | Sold | Price | $/sf | Match |
|---|---|---|---|---|---|---|---|
| 2701 Sheridan Ave | 0.16mi | 3/1.0 (+1) | 924 (+3%) | 3mo | $74,272 | $80 | 80 |
| 2411 Beechwood Ave | 0.25mi | 3/1.0 (+1) | 952 (+6%) | 8mo | $40,000 | $42 | 68 |
| 3133 Glenwood Ave | 0.40mi | 3/1.0 (+1) | 936 (+4%) | 6mo | $43,000 | $46 | 65 |
| 2928 Walters Dr | 0.43mi | 3/1.0 (+1) | 936 (+4%) | 7mo | $36,000 | $38 | 63 |
| 3116 Fulton St | 0.60mi | 2/1.0 | 790 (-12%) | 2mo | $32,000 | $41 | 49 |
| 3016 Fairview St | 0.73mi | 3/1.0 (+1) | 954 (+6%) | 3mo | $22,000 | $23 | 48 |
| 2626 Hampshire St | 0.56mi | 3/1.0 (+1) | 975 (+8%) | 8mo | $35,000 | $36 | 48 |
| 3012 Walters Dr | 0.45mi | 3/1.0 (+1) | 1,008 (+12%) | 7mo | $50,000 | $50 | 48 |
| 2822 Kensington Dr | 0.55mi | 3/1.0 (+1) | 1,008 (+12%) | 2mo | $76,900 | $76 | 48 |
| 3221 Fulton St | 0.69mi | 3/1.5 (+1) | 972 (+8%) | 1mo | $47,000 | $48 | 47 |
| 3310 Lexington Dr | 0.55mi | 3/1.0 (+1) | 1,014 (+13%) | 4mo | $67,000 | $66 | 45 |
| 3015 Fairview St | 0.71mi | 3/1.0 (+1) | 1,032 (+15%) | 10mo | $70,000 | $68 | 29 |
Match score weights: distance 35% · size 25% · config 20% · recency 20%. Top-matched comps best support the ARV.
Projected returns pro-forma
-3.0% appreciation · 3.0% rent growth · sell at horizon
- IRR
- —
- Equity multiple
- 8.21×
- Total profit
- $40,401
- Equity at exit
- $2,982
- IRR
- —
- Equity multiple
- 17.33×
- Total profit
- $91,465
- Equity at exit
- $1,729
Cash invested: $5,600 (down + closing). Projections, not guarantees.
Landlord ↔ Tenant lean methodology
- Overall (STATE)
- 62 Landlord-Friendly
- State Michigan
- 62 Landlord-Friendly · EVEN
- County
- — inherits STATE
- City
- — inherits STATE
ZIP-level market 48601
- Home prices YoY
- -32.1%
- Active inventory
- 201
- Price-to-rent
- 1.6×
Monthly cashflow live
- Estimated rent
- $1,074 medium interval (Pro) →
- Mortgage (P&I)
- −$105
- Tax from tax record
- −$50 /mo · $604/yr
- Insurance
- −$8
- HOA
- −$0
- Vacancy / Maint / Mgmt
- −$225
- Net cashflow
- $685
Break-even live
Sensitivity live
| Price | -10% $696 | -5% $690 | +0% $685 | +5% $679 | +10% $673 |
|---|---|---|---|---|---|
| Rent | -10% $600 | -5% $642 | +0% $685 | +5% $727 | +10% $770 |
| Rate | -1.0pp $695 | -0.5pp $690 | base $685 | +0.5pp $680 | +1.0pp $674 |
UW: 25.0% down · 7.5% · 30yr · 1.5% tax · 5.0% vac · 8.0% maint · 8.0% mgmt
Financing live
Cash to close
- Down payment
- $5,000
- Closing costs
- $600
- Reserves months
- —
- Total cash needed
- —
Loan-product check · same deal, 3 products live
Conventional
25% down · 7.5% · 30yr
- Down + closing
- —
- Monthly P&I
- —
- Monthly cashflow
- —
- DSCR
- —
- Eligible?
- —
Personal DTI + credit; lowest rate.
DSCR
20% down · 8.5% · 30yr
- Down + closing
- —
- Monthly P&I
- —
- Monthly cashflow
- —
- DSCR
- —
- Eligible?
- —
No personal income docs; deal must DSCR.
Hard money
10% down · 12.0% · 12mo
- Down + closing
- —
- Monthly P&I
- —
- Monthly cashflow
- —
- DSCR
- —
- Eligible?
- —
Short-term bridge; refi at stabilization.
Rent comps 3 comps
| Address | Beds | Baths | Sqft | Rent | $/sqft | DOM | Units | Dist |
|---|---|---|---|---|---|---|---|---|
| 3328 Webber St Saginaw, MI | 3.0 | 1.0 | 878 | $1,250 | $1.42 | 44d | 1 | 0.69mi |
| 2554 Apollo Dr Unit AP2554 Saginaw, MI | 3.0 | 2.0 | 960 | $883 | $0.92 | 44d | 1 | 1.44mi |
| 2564 Apollo Dr Unit AP2564 Saginaw, MI | 3.0 | 2.0 | 960 | $883 | $0.92 | 44d | 1 | 1.45mi |
Listing history 18 events
-
2026-06-19days on market $20,000 Active 38 DOM
-
2026-06-18days on market $20,000 Active 37 DOM
-
2026-06-17days on market $20,000 Active 36 DOM
-
2026-06-16days on market $20,000 Active 35 DOM
-
2026-06-15days on market $20,000 Active 34 DOM
-
2026-06-14days on market $20,000 Active 32 DOM
-
2026-06-12days on market $20,000 Active 31 DOM
-
2026-06-09days on market $20,000 Active 28 DOM
-
2026-06-08days on market $20,000 Active 27 DOM
-
2026-06-07days on market $20,000 Active 26 DOM
-
2026-06-05days on market $20,000 Active 23 DOM
-
2026-06-03days on market $20,000 Active 22 DOM
-
2026-06-02days on market $20,000 Active 21 DOM
-
2026-06-01days on market $20,000 Active 20 DOM
-
2026-05-31days on market $20,000 Active 19 DOM
-
2026-05-30days on market $20,000 Active 18 DOM
-
2026-05-11$20,000 Active 481-char remark
Show marketing remark (481 chars)
Calling all investors, flippers, and handy buyers! This 2-bedroom ranch-style home offers main floor living and plenty of potential for your next project. With the right vision and renovations, this property could make a great investment or rental opportunity. The home does need repairs and updates, including a roof and plumbing work, and is being sold as-is. Perfect for someone looking to renovate and add value. Don’t miss the chance to bring this property back to life!
-
2026-05-11$20,000 Active
Show marketing remark (481 chars)
Calling all investors, flippers, and handy buyers! This 2-bedroom ranch-style home offers main floor living and plenty of potential for your next project. With the right vision and renovations, this property could make a great investment or rental opportunity. The home does need repairs and updates, including a roof and plumbing work, and is being sold as-is. Perfect for someone looking to renovate and add value. Don’t miss the chance to bring this property back to life!
ⓘ Source: listings_history table (triggers on properties + properties_extension) + one-shot
backfill from property_details.listing_events for pre-trigger history.
Tax reassessment forecast MI · Partial reset (capped growth)
- Current annual tax
- $604 · $50/mo
- Projected year-2 tax
- $604 · $50/mo
- Expected delta
- $0/yr ($0/mo · 0.0%)
ⓘ Screening estimate from a state-policy table — verify with the county assessor before closing.
Climate risk First Street
- Flood 1/10 Low FEMA zone X (unshaded) · 0% chance over 30 yrs
- Wildfire 1/10 Low
- Heat 2/10 Low 7 d/yr ≥100°F today · 14 d/yr by 30 yrs out
- Wind 1/10 Low
- Air quality 2/10 Low 1 unhealthy d/yr today · 2 by 30 yrs out
Nearby sold comps map
Loading sold comps map…
Walkable amenities ~0.75 mi
Loading nearby amenities…
Taxation est. · year 1
- Rental income
- $12,885
- − Mortgage interest
- −$1,120
- − Property taxes
- −$604
- − Insurance
- −$100
- − Repairs & maintenance
- −$1,031
- − Management
- −$1,031
- − Depreciation
- −$582
- Taxable income
- $8,417
- Est. tax owed @ 24.0%
- −$2,020
- After-tax cash flow
- $6,197/yr
For passive investors: Depreciation is non-cash, so a rental often shows a tax loss while cash-flowing — sheltering income. Rental losses are passive: they offset passive income freely, and up to $25,000/yr can offset ordinary (W-2) income if you actively participate and your MAGI is under $100k (phasing out to $0 by $150k); unused losses carry forward. On sale, claimed depreciation is recaptured at up to 25%, and gains may owe capital-gains tax (a 1031 exchange can defer both). Figures are a year-1 estimate at your 24.0% rate — not tax advice; consult a CPA.
Schools (NCES district)
- District
- Saginaw School District
- NCES district ID
- 2630390
- Math proficiency
- 20% ▼ -5.00%
- Reading proficiency
- 29% ▼ -3.00%
- Median HH income
- $28,940
- Composite
- 19.6/100
- National rank
- #8755
- State rank
- #444 of 540 in MI
Livability — Saginaw
- Score
- 63/100
- State rank
- #521
- US rank
- #15424
Category grades
Schools grade is shown separately in the Schools card above.
Census & demographics
- Census place
- Saginaw, MI
- City population
- 54,884
- Population (ZIP)
- 32,069
Population outlook (Saginaw County) Hauer SSP2
- Today (2025)
- 180,568 people
- By 2030
- 172,302 · -4.6%
- By 2040
- 153,919 · -14.8%
- By 2050
- 135,519 · -24.9%
- By 2075
- 97,199 · -46.2%
- By 2100
- 65,037 · -64.0%
Race, ethnicity, and origin ACS 2023
- Neighborhood character
- Diverse neighborhood (Simpson 0.56)
- Race & ethnicity
- Black 59% White 27% Hispanic / Latino 12% Two or more races 5%
- Hispanic origin (detail)
- Mexican 10%
- Common ancestry
- Romanian 2% Lithuanian 2%
- Foreign-born
- 1% · Canada
- Languages at home
- 96% English-only · Spanish 4%
Political lean MEDSL · Saginaw
- 2024 margin
- Toss-up / Even · D 47.7% · R 51.0% · Other 1.4%
- 2008→2024 swing
- -20.6pp toward R · 2008: 17.3pp · 2024: -3.3pp
- All cycles
- 2024: R+3.3 2020: D+0.3 2016: R+1.1 2012: D+11.9 2008: D+17.3
Not yet ingested
- Civics
- —
Market trends
- HPI YoY
- ▼ -93.46%
- Current HPI
- 197.3359
- Rent YoY
- —
- Metro
- —
- State GDP YoY
- ▲ 1.37%
- F500 in state
- 28
Industry mix (Fortune 500 HQ in MI)
| Industry | F500 HQs | Revenue |
|---|---|---|
| Automotive Parts | 3 | $48B |
|
||
| Automotive | 2 | $372B |
|
||
| Chemicals | 1 | $45B |
|
||
| Automotive Retail | 1 | $29B |
|
||
| Healthcare / Medical Devices | 1 | $23B |
|
||
| Automotive Technology | 1 | $20B |
|
||
Price history
+0.0% since first listed2 events — show timeline
- 2026-05-11 Listed $20,000 REALCOMP
- 2026-05-11 Listed $20,000 MiRealSource-MiMLS
Property tax history
+1.6%/yrLatest (2025): $604 · -14.0% YoY. Source: county tax records.
Cash-flow waterfall
monthlySold comps — $/sqft
last 12 mo · ≤1 miLoading sold comps…