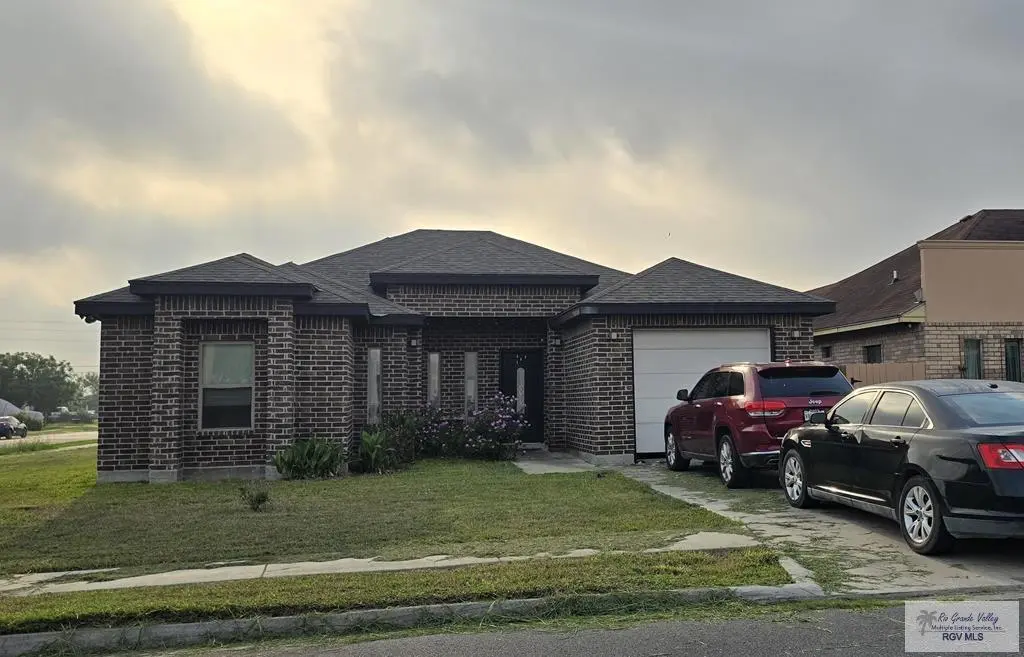
4620 Espinoza Ln · Brownsville, TX
Flood risk 4/10 · Minor
- FEMA flood zone
- AH
- Chance of flooding over 30 yrs
- 0.22%
- Est. flood insurance / yr
- $1,142 – $2,507
Fire risk 5/10 · Moderate
- Est. fire insurance / yr
- $1,222 – $2,270
Heat risk 9/10 · Severe
- Hot days now (above 110°F)
- 7 days/yr
- Hot days in 30 yrs
- 27 days/yr
Wind risk 9/10 · Severe
- Chance of severe wind over 30 yrs
- 99.0%
Air-quality risk 2/10 · Minimal
- Unhealthy air days now
- 1 days/yr
- Unhealthy air days in 30 yrs
- 1 days/yr
Risk factors via First Street. Map © Google.
Why this score? — see what drove the D grade
The composite is a weighted blend of 9 inputs, each scored 0–100. Each bar is that input's sub-score; the figure is the points it added to the 100-point composite (weight × sub-score).
- Cash flow +14.3/30.0
- ARV discount +8.4/15.0
- 1% rule +4.3/10.0
- DSCR +4.3/10.0
- Livability +4.0/5.0
- Rent growth +3.2/5.0
- Condition / age +2.5/5.0
- Schools +2.2/10.0
- Appreciation +0.0/10.0
$219,500
🖨 Deal sheet 📄 Offer letter ✓ Due diligence
Listing remarks MLS
Welcome to this charming 3-bedroom, 2-bath home situated on a desirable corner lot! This well-maintained property offers a functional and inviting layout, perfect for comfortable everyday living. The spacious living area flows seamlessly into the kitchen and dining space, creating a warm and welcoming atmosphere for gatherings. Outside, the corner lot provides added privacy, extra yard space, and great curb appeal ideal for outdoor entertaining or simply enjoying your surroundings. This home is a fantastic opportunity for buyers seeking comfort, convenience, and value. Don't miss your chance to make it yours!
Key facts
- Great curb appeal
- Spacious living area
- Extra yard space
Tags
Property features AI
Finance
- HOA & community: No association; Community curbs
Exterior
- Parking: Attached garage (garage faces front); 1 covered parking space (1 total garage space)
- Utilities: Public water; City sewer; Electric service
- Home design: Single-family property (brick construction); Shingle roof; Slab foundation
- Construction: Brick construction; Slab foundation; Shingle roof
- Exterior features: Privacy wood fencing; Covered patio with patio slab; Paved road access; Corner lot
Interior
- Kitchen: No conveying appliances
- Bedrooms: Primary bedroom with walk-in closet
- Flooring: Tile flooring
- Bathrooms: 2 full bathrooms
- Heating & cooling: Central heating (electric); Central air conditioning (electric); Thermostat (energy efficient feature)
- Interior features: Granite countertops; Walk-in closets; No window coverings
- Laundry & utility: Laundry area located in the garage; Electric water heater (located in garage)
Neighborhood map
What this means for you Summary
Snapshot
- This is a 3-bed/2.0-bath single-family listed at $220k.
Deal economics
- At list price, monthly cash flow is $-112 ($-1k/yr) — negative.
- To cash-flow at today's rent, offer at most $200k (9.0% below list).
- To meet the 1% rule (rent ≥ 1% of price), the offer needs to be $204k (7.1% below list).
- Recommended offer: $200k (9.0% below list) — sets the bar for cash-flow.
- Cap rate 6.5% vs local median 5.0% in Brownsville — top-decile yield for the area; either an underpriced asset or a hidden risk that comps aren't pricing in. Stress-test before assuming the spread holds.
Location & tenants
- Location reads 79/100 on livability (#62 in TX, #2,311 nationally) — a middle-class / working-renter tenant base. Strengths: commute A+, cost of living A+, housing A+; Watch: amenities D, crime D-, employment F.
- Brownsville ISD (urban): math 20% / reading 34% proficiency, ranked #710 of 826 in TX (top 86%) — low school quality limits family demand, transient renter base, plan for 1-2y turnover; 83% free/reduced lunch — lower-income household profile, screen leases tightly.
- Zoned schools: Pena El (math 27% / reading 37%, grade F, #2,268 of 4,322 statewide, top 55%, 472 students, 88% FRL); Garcia Middle (math 17% / reading 33%, grade F, #1,258 of 1,662 statewide, top 77%, 893 students, 87% FRL); Rivera Early College H S (math 12% / reading 38%, grade F, #1,250 of 1,632 statewide, top 77%, 2,254 students, 84% FRL) — zoned schools at 86% FRL track the district average.
- Market conditions: Rents rising (+2.8%/yr); 413 active listings in the ZIP; 11 comparable units currently listed for rent nearby; rentals at typical pace (median 21d on market — plan ~3-4 weeks tenant-placement turnaround); 45% of comp listings sitting > 30 days — soft ceiling on asking rent; 2,326 units permitted in Cameron County in 2024 (503 in 5+ unit buildings).
- This rent runs 35% of the median local income ($71k/yr) — at the standard rent-burdened threshold; future hikes will face affordability resistance.
Forward outlook
- Local home prices are declining (-3.0%/yr); year-one equity from $2k of loan paydown is wiped out by about $7k of value loss. Plan a longer hold.
- Cameron County population projected at +3% by 2050 — modest demand growth; plan on rents tracking national, not racing it.
Negotiation context
- It's been on market 28 days — a 2% lower offer ($216k) is reasonable based on typical stale-listing flexibility.
- 2 sale attempts with the ask held roughly flat each time — persistent listings suggest the price (not the market) is what's stuck; bring a comps-based counter.
Risks & watch-outs
- Watch-outs: flood insurance adds $152/mo.
- Climate carrying-cost: in FEMA flood zone AH (mandatory federal flood insurance); severe wind risk, 99% chance of damaging wind over 30y; moderate wildfire risk; extreme-heat days projected 7→27/yr by 2055 (HVAC capex compounding) — expect insurance premiums to compound above CPI over the hold.
Questions for the listing agent
- What do current leases actually rent for vs. the listed asking? Can we see a recent rent roll and the last 12 months of T-12 income?
- What's the actual annual flood-insurance premium (NFIP or private), and is the property in a SFHA with mandatory coverage?
- Is there a deadline driving the sale (1031 exchange, divorce, estate, relocation)? That informs how much negotiation room exists.
- Crime grade is D in this area — have there been break-ins, vandalism, or insurance claims at this property in the last 3 years? What carrier currently insures it and at what premium?
- The area grade is low — what's the realistic commute time and amenity access for the typical tenant pool here? Any planned neighborhood developments (good or bad) we should know about?
- What's the average days-on-market for RENTAL listings here right now (not sales)? A rising rental-DOM trend means longer vacancies and softer asking-rent achievability than the comps imply.
- What's the recent tenant-quality profile in this submarket — average credit score on applications, eviction rate, late-payment / NSF rate, and stable-employment percentage? A property-management company in the area should have these aggregated.
- How much new for-sale + rental construction is in the pipeline within 1–3 miles? Heavy new supply typically softens prices + rents 12–24 months out; constrained supply supports both.
Investment metrics
- 1% rule
- 0.93% ✗
- Cap rate
- 6.51%
- Cash-on-cash
- 0.78%
- DSCR
- 1.03
- GRM
- 9.0
CMA / ARV
- ARV (median comp)
- $224,107
- List price
- $219,500
- Delta
- 2.63%
- Verdict
- FAIR
- Comps
- 3 within 2.0 mi
Show comp detail 2 sales within ~0.75 mi
| Address | Dist | Beds/Ba | Sqft | Sold | Price | $/sf | Match |
|---|---|---|---|---|---|---|---|
| 2940 Douglas Way | 0.41mi | 3/2.0 | 1,403 (+1%) | 9mo | $248,000 | $177 | 72 |
| 2964 Alexa Dr | 0.27mi | 3/2.5 | 1,586 (+14%) | 14mo | $275,000 | $173 | 50 |
Match score weights: distance 35% · size 25% · config 20% · recency 20%. Top-matched comps best support the ARV.
Projected returns pro-forma
-3.0% appreciation · 2.77% rent growth · sell at horizon
- IRR
- -20.1%
- Equity multiple
- 0.30×
- Total profit
- $-43,015
- Equity at exit
- $32,728
- IRR
- -13.5%
- Equity multiple
- 0.22×
- Total profit
- $-47,925
- Equity at exit
- $18,978
Cash invested: $61,460 (down + closing). Projections, not guarantees.
Landlord ↔ Tenant lean methodology
- Overall (STATE)
- 87 Strongly Landlord-Friendly
- State Texas
- 87 Strongly Landlord-Friendly · R+5
- County
- — inherits STATE
- City
- — inherits STATE
ZIP-level market 78526
- Home prices YoY
- -12.1%
- Rents YoY
- 2.8%
- Active inventory
- 413
- Price-to-rent
- 9.0×
Monthly cashflow live
- Estimated rent
- $2,040 high interval (Pro) →
- Mortgage (P&I)
- −$1,151
- Tax from tax record
- −$329 /mo · $3,949/yr
- Insurance
- −$91
- Flood insurance flood zone
- −$152 /mo · $1,824/yr
- HOA
- −$0
- Vacancy / Maint / Mgmt
- −$428
- Net cashflow
- $-112
Break-even live
UW: 25.0% down · 7.5% · 30yr · 1.5% tax · 5.0% vac · 8.0% maint · 8.0% mgmt
Financing live
Cash to close
- Down payment
- $54,875
- Closing costs
- $6,585
- Reserves months
- —
- Total cash needed
- —
Loan-product check · same deal, 3 products live
Conventional
25% down · 7.5% · 30yr
- Down + closing
- —
- Monthly P&I
- —
- Monthly cashflow
- —
- DSCR
- —
- Eligible?
- —
Personal DTI + credit; lowest rate.
DSCR
20% down · 8.5% · 30yr
- Down + closing
- —
- Monthly P&I
- —
- Monthly cashflow
- —
- DSCR
- —
- Eligible?
- —
No personal income docs; deal must DSCR.
Hard money
10% down · 12.0% · 12mo
- Down + closing
- —
- Monthly P&I
- —
- Monthly cashflow
- —
- DSCR
- —
- Eligible?
- —
Short-term bridge; refi at stabilization.
Rent comps 11 comps
| Address | Beds | Baths | Sqft | Rent | $/sqft | DOM | Units | Dist |
|---|---|---|---|---|---|---|---|---|
| 2600 Elyssa Dr Brownsville, TX | 3.0 | 2.0 | 1216 | $1,850 | $1.52 | 13d | 1 | 0.38mi |
| 3552 Old Port Isabel Rd Unit A Brownsville, TX | 2.0 | 2.0 | 1500 | $1,600 | $1.07 | 43d | 1 | 0.70mi |
| 318 Rancho Viejo Blvd Brownsville, TX | 2.0 | 2.0 | 1182 | $1,700 | $1.44 | 13d | 1 | 0.86mi |
| 604 Toronto Ave Brownsville, TX | 3.0 | 2.0 | 1376 | $2,500 | $1.82 | 43d | 1 | 0.97mi |
| 4021 Westland Dr Brownsville, TX | 3.0 | 2.0 | 1586 | $2,200 | $1.39 | 13d | 1 | 1.00mi |
| 6045 Danubio Brownsville, TX | 3.0 | 2.5 | 1604 | $2,250 | $1.40 | 21d | 1 | 1.33mi |
| 63 Calgary Ct Brownsville, TX | 3.0 | 2.0 | 1348 | $1,550 | $1.15 | 43d | 1 | 1.34mi |
| 105 Sally Ln Brownsville, TX | 3.0 | 2.0 | 1365 | $2,300 | $1.68 | 43d | 1 | 1.35mi |
| 6012 Sabinas St Brownsville, TX | 3.0 | 1.0 | 1200 | $1,575 | $1.31 | 43d | 1 | 1.41mi |
| 3602 Westcreek Dr Brownsville, TX | 3.0 | 2.5 | 1748 | $2,300 | $1.32 | 13d | 1 | 1.49mi |
| 7100 Via Del Mar Cir Unit B-3 Brownsville, TX | 2.0 | 2.0 | 1150 | $1,500 | $1.30 | 21d | 1 | 1.49mi |
Listing history 17 events
-
2026-06-16status $219,500 Pending 28 DOM
-
2026-06-15days on market $219,500 Option 28 DOM
Show marketing remark (616 chars)
Welcome to this charming 3-bedroom, 2-bath home situated on a desirable corner lot! This well-maintained property offers a functional and inviting layout, perfect for comfortable everyday living. The spacious living area flows seamlessly into the kitchen and dining space, creating a warm and welcoming atmosphere for gatherings. Outside, the corner lot provides added privacy, extra yard space, and great curb appeal ideal for outdoor entertaining or simply enjoying your surroundings. This home is a fantastic opportunity for buyers seeking comfort, convenience, and value. Don't miss your chance to make it yours!
-
2026-06-14days on market $219,500 Option 26 DOM
-
2026-06-13days on market $219,500 Option 25 DOM
-
2026-06-10statusdays on market $219,500 Option 23 DOM
-
2026-06-09days on market $219,500 Active 22 DOM
-
2026-06-08days on market $219,500 Active 21 DOM
-
2026-06-07days on market $219,500 Active 20 DOM
-
2026-06-05days on market $219,500 Active 17 DOM
-
2026-06-03days on market $219,500 Active 16 DOM
-
2026-06-02days on market $219,500 Active 15 DOM
-
2026-06-01days on market $219,500 Active 14 DOM
-
2026-05-31days on market $219,500 Active 13 DOM
-
2026-05-30days on market $219,500 Active 12 DOM
-
2026-05-14price $219,500 616-char remark
Show marketing remark (616 chars)
Welcome to this charming 3-bedroom, 2-bath home situated on a desirable corner lot! This well-maintained property offers a functional and inviting layout, perfect for comfortable everyday living. The spacious living area flows seamlessly into the kitchen and dining space, creating a warm and welcoming atmosphere for gatherings. Outside, the corner lot provides added privacy, extra yard space, and great curb appeal ideal for outdoor entertaining or simply enjoying your surroundings. This home is a fantastic opportunity for buyers seeking comfort, convenience, and value. Don't miss your chance to make it yours!
-
2026-05-06$219,500 Active 616-char remark
-
2026-04-30$230,000 Active 616-char remark
Show marketing remark (616 chars)
Welcome to this charming 3-bedroom, 2-bath home situated on a desirable corner lot! This well-maintained property offers a functional and inviting layout, perfect for comfortable everyday living. The spacious living area flows seamlessly into the kitchen and dining space, creating a warm and welcoming atmosphere for gatherings. Outside, the corner lot provides added privacy, extra yard space, and great curb appeal ideal for outdoor entertaining or simply enjoying your surroundings. This home is a fantastic opportunity for buyers seeking comfort, convenience, and value. Don't miss your chance to make it yours!
ⓘ Source: listings_history table (triggers on properties + properties_extension) + one-shot
backfill from property_details.listing_events for pre-trigger history.
Tax reassessment forecast TX · Resets to sale price
- Current annual tax
- $3,949 · $329/mo
- Projected year-2 tax
- $4,017 · $335/mo
- Expected delta
- +$67/yr (+$6/mo · 1.7%)
ⓘ Screening estimate from a state-policy table — verify with the county assessor before closing.
Climate risk First Street
- Flood 4/10 Moderate FEMA zone AH · 22% chance over 30 yrs
- Wildfire 5/10 Major
- Heat 9/10 Extreme 7 d/yr ≥110°F today · 27 d/yr by 30 yrs out
- Wind 9/10 Extreme 99% chance of damaging wind over 30 yrs
- Air quality 2/10 Low 1 unhealthy d/yr today · 1 by 30 yrs out
Nearby sold comps map
Loading sold comps map…
Walkable amenities ~0.75 mi
Loading nearby amenities…
Taxation est. · year 1
- Rental income
- $24,481
- − Mortgage interest
- −$12,295
- − Property taxes
- −$3,949
- − Insurance
- −$2,922
- − Repairs & maintenance
- −$1,959
- − Management
- −$1,959
- − Depreciation
- −$6,385
- Taxable loss
- −$4,988
- Est. tax savings @ 24.0%
- +$1,197
- After-tax cash flow
- $-147/yr
For passive investors: Depreciation is non-cash, so a rental often shows a tax loss while cash-flowing — sheltering income. Rental losses are passive: they offset passive income freely, and up to $25,000/yr can offset ordinary (W-2) income if you actively participate and your MAGI is under $100k (phasing out to $0 by $150k); unused losses carry forward. On sale, claimed depreciation is recaptured at up to 25%, and gains may owe capital-gains tax (a 1031 exchange can defer both). Figures are a year-1 estimate at your 24.0% rate — not tax advice; consult a CPA.
Schools (NCES district)
- District
- Brownsville ISD
- NCES district ID
- 4811680
- Math proficiency
- 20% ▼ -36.00%
- Reading proficiency
- 34% ▼ -13.00%
- Median HH income
- $30,490
- Composite
- 21.8/100
- National rank
- #8249
- State rank
- #710 of 826 in TX
Livability — Brownsville
- Score
- 79/100
- State rank
- #62
- US rank
- #2311
Category grades
Schools grade is shown separately in the Schools card above.
Census & demographics
- Census place
- Brownsville, TX
- County
- Cameron County · 310,734 people
- City population
- 212,132
- Metro
- Brownsville-Harlingen, TX
- Population (ZIP)
- 60,012
- Household income
- $70,565
- Rent vs Own
- Severe rent burden
- 1063.0
Population outlook (Cameron County) Hauer SSP2
- Today (2025)
- 441,603 people
- By 2030
- 448,113 · +1.5%
- By 2040
- 456,385 · +3.3%
- By 2050
- 456,294 · +3.3%
- By 2075
- 423,851 · -4.0%
- By 2100
- 342,787 · -22.4%
Race, ethnicity, and origin ACS 2023
- Neighborhood character
- Predominantly Hispanic (93%)
- Race & ethnicity
- Hispanic / Latino 93% Two or more races 45% White 4% Asian 2%
- Hispanic origin (detail)
- Mexican 87%
- Foreign-born
- 25% · Canada, Vietnam
- Languages at home
- 19% English-only · Spanish 79% Tagalog/Filipino 1%
Political lean MEDSL · Cameron
- 2024 margin
- Lean R (+5.8) · D 46.7% · R 52.5%
- 2008→2024 swing
- -34.6pp toward R · 2008: 28.8pp · 2024: -5.8pp
- All cycles
- 2024: R+5.8 2020: D+13.2 2016: D+32.5 2012: D+32.4 2008: D+28.8
Not yet ingested
- Civics
- —
Market trends
- HPI YoY
- ▼ -30.28%
- Current HPI
- 220.5233
- Rent YoY
- ▲ 2.77%
- Metro
- Brownsville-Harlingen, TX
- State GDP YoY
- ▲ 3.95%
- F500 in state
- 110
Industry mix (Fortune 500 HQ in TX)
| Industry | F500 HQs | Revenue |
|---|---|---|
| Energy | 16 | $1,198B |
|
||
| Technology | 5 | $198B |
|
||
| Engineering / Construction | 4 | $72B |
|
||
| Energy Services | 3 | $60B |
|
||
| Utilities | 3 | $41B |
|
||
| Healthcare | 2 | $330B |
|
||
Price history
-4.6% since first listed6 events — show timeline
- 2026-06-16 Pending — MCALLENMLS
- 2026-06-15 Pending — RGVMLS
- 2026-06-09 Contingent — MCALLENMLS
- 2026-05-14 Price Changed $219,500 RGVMLS
- 2026-05-06 Listed $219,500 MCALLENMLS
- 2026-04-30 Listed $230,000 RGVMLS
Property tax history
+22.0%/yrLatest (2025): $3,949 · -9.6% YoY. Source: county tax records.
Cash-flow waterfall
monthlySold comps — $/sqft
last 12 mo · ≤1 miLoading sold comps…