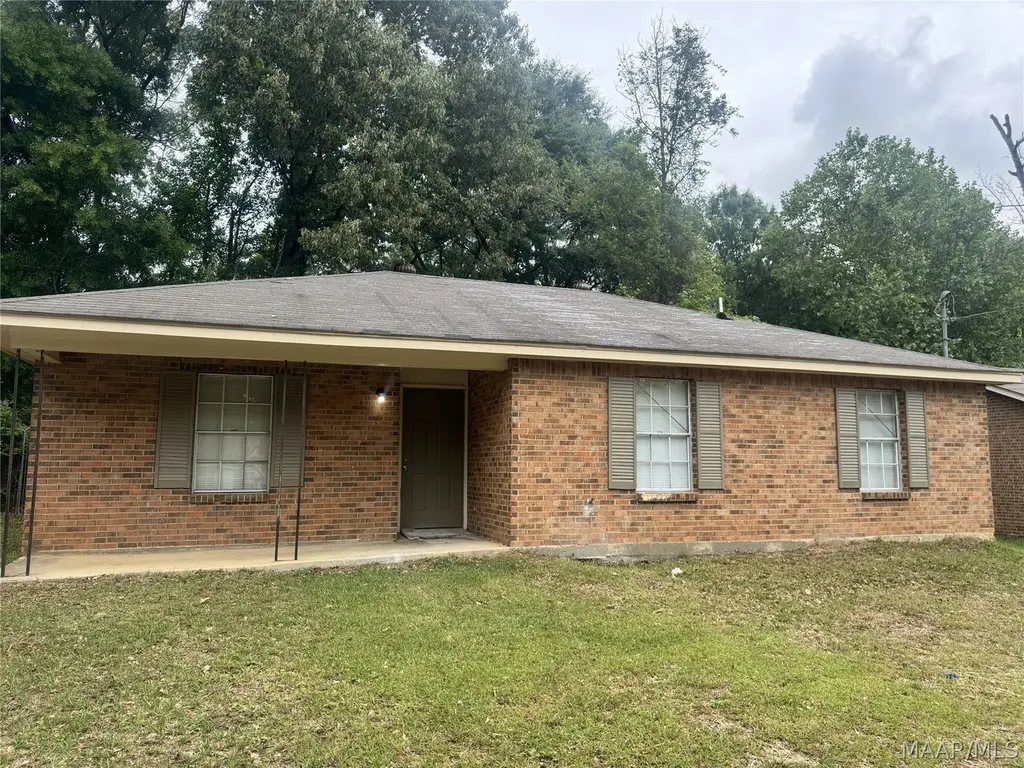
4144 Piedmont Dr · Montgomery, AL
Flood risk 1/10 · Minimal
- FEMA flood zone
- X (unshaded)
- Chance of flooding over 30 yrs
- 0.0%
- Est. flood insurance / yr
- $507 – $1,088
Fire risk 4/10 · Minor
- Est. fire insurance / yr
- $916 – $1,700
Heat risk 7/10 · Major
- Hot days now (above 108°F)
- 7 days/yr
- Hot days in 30 yrs
- 20 days/yr
Wind risk 8/10 · Major
- Chance of severe wind over 30 yrs
- 80.0%
Air-quality risk 2/10 · Minimal
- Unhealthy air days now
- 1 days/yr
- Unhealthy air days in 30 yrs
- 1 days/yr
Risk factors via First Street. Map © Google.
Why this score? — see what drove the C+ grade
The composite is a weighted blend of 9 inputs, each scored 0–100. Each bar is that input's sub-score; the figure is the points it added to the 100-point composite (weight × sub-score).
- Cash flow +30.0/30.0
- DSCR +10.0/10.0
- 1% rule +8.4/10.0
- Appreciation +6.4/10.0
- Livability +3.2/5.0
- Rent growth +2.5/5.0
- Condition / age +2.5/5.0
- Schools +1.7/10.0
- ARV discount +0.0/15.0
$99,900
🖨 Deal sheet 📄 Offer letter ✓ Due diligence
Listing remarks
Great 3 bed 2 bath brick home on a slab that has had many updates! Perfect for first time home buyers or investors. New carpet, new paint, new bathrooms, new kitchen cabinets. New roof and water heater prior to closing! All offered at an affordable price! Close to airport, Hyundai and Amazon!
Key facts
- 7,840 sq ft lot
- Parking
- Built 1987
Property features AI
Exterior
- Parking: Driveway
- Utilities: Electricity available; High-speed internet available; Public water; Public sewer
- Home design: Single-story home
- Construction: Brick construction; Slab foundation; Built per public records
- Exterior features: Fully fenced yard; Outside city limits
Interior
- Kitchen: No kitchen appliance details provided
- Bedrooms: 6 total rooms (bedroom count not specified)
- Flooring: Carpet; Laminate; Tile
- Bathrooms: 2 full bathrooms
- Heating & cooling: Central heating (electric); Central air conditioning (electric)
- Interior features: Carpet, laminate, and tile flooring
- Laundry & utility: Electric water heater
Neighborhood map
What this means for you Summary
Snapshot
- This is a 3-bed/2.0-bath single-family listed at $100k.
Deal economics
- At list price, monthly cash flow is $433 ($5k/yr) — positive.
- The deal already cash-flows at list — no discount required.
- Meets the 1% rule at list price ($1k rent vs $100k).
- Recommended offer: $97k (3.0% below list) — sets the bar for market timing.
- Cap rate 11.5% vs local median 6.0% in Montgomery — top-decile yield for the area; either an underpriced asset or a hidden risk that comps aren't pricing in. Stress-test before assuming the spread holds.
Location & tenants
- Location reads 65/100 on livability (#138 in AL) — a middle-class / working-renter tenant base. Strengths: cost of living A+, housing A+; Watch: schools C-, employment D, crime F.
- Montgomery County (urban): math 9% / reading 31% proficiency, ranked #106 of 129 in AL (top 82%) — low school quality limits family demand, transient renter base, plan for 1-2y turnover; 70% free/reduced lunch — lower-income household profile, screen leases tightly.
- Market conditions: 65 active listings in the ZIP; 460 units permitted in Montgomery County in 2024 (37 in 5+ unit buildings).
Forward outlook
- In year one you build about $3k of equity ($691 loan paydown + $3k appreciation (2.7% local appreciation)).
- Montgomery County population projected to shrink 8% by 2050 — rents likely to lag national; underwrite the cash flow, not the appreciation.
- At projected returns (2.7% appreciation + 3.0% rent growth), your $28k cash investment doubles in ~4 years — after that, you're playing with house money.
- By year 10, paydown + projected appreciation supports a ~$33k cash-out refi (75% LTV) — recoverable capital for the next deal without selling this one.
Negotiation context
- It's been on market 43 days — a 3% lower offer ($97k) is reasonable based on typical stale-listing flexibility.
Risks & watch-outs
- Climate carrying-cost: severe wind risk, 80% chance of damaging wind over 30y; extreme-heat days projected 7→20/yr by 2055 (HVAC capex compounding) — expect insurance premiums to compound above CPI over the hold.
Questions for the listing agent
- It's been on market 43 days. Have you received any prior offers? Is the seller open to a 3% concession, seller financing, or rate buy-down credit?
- Is there a deadline driving the sale (1031 exchange, divorce, estate, relocation)? That informs how much negotiation room exists.
- Crime grade is F in this area — have there been break-ins, vandalism, or insurance claims at this property in the last 3 years? What carrier currently insures it and at what premium?
- What's the average days-on-market for RENTAL listings here right now (not sales)? A rising rental-DOM trend means longer vacancies and softer asking-rent achievability than the comps imply.
- What's the recent tenant-quality profile in this submarket — average credit score on applications, eviction rate, late-payment / NSF rate, and stable-employment percentage? A property-management company in the area should have these aggregated.
- How much new for-sale + rental construction is in the pipeline within 1–3 miles? Heavy new supply typically softens prices + rents 12–24 months out; constrained supply supports both.
Investment metrics
- 1% rule
- 1.34% ✓
- Cap rate
- 11.50%
- Cash-on-cash
- 18.58%
- DSCR
- 1.83
- GRM
- 6.2
CMA / ARV
- ARV (median comp)
- $75,130
- List price
- $99,900
- Delta
- 39.76%
- Verdict
- OVERPRICED
- Comps
- 20 within 1.0 mi
Show comp detail 10 sales within ~0.75 mi
| Address | Dist | Beds/Ba | Sqft | Sold | Price | $/sf | Match |
|---|---|---|---|---|---|---|---|
| 4160 Piedmont Dr | 0.05mi | 3/2.0 | 1,156 (0%) | 11mo | $94,900 | $82 | 89 |
| 4305 Brewer Ct | 0.13mi | 3/1.5 | 1,180 (+2%) | 24mo | $72,500 | $61 | 68 |
| 3835 Riviera Rd | 0.53mi | 3/2.0 | 1,177 (+2%) | 10mo | $76,500 | $65 | 64 |
| 3832 Piedmont Dr | 0.43mi | 3/2.0 | 1,260 (+9%) | 5mo | $60,000 | $48 | 61 |
| 3807 Riviera Rd | 0.56mi | 3/1.5 | 1,176 (+2%) | 16mo | $75,000 | $64 | 56 |
| 3817 Dilworth Rd | 0.43mi | 3/1.0 | 1,040 (-10%) | 8mo | $75,000 | $72 | 52 |
| 4513 Lonesome Pine Dr | 0.72mi | 3/2.0 | 1,215 (+5%) | 10mo | $76,000 | $63 | 49 |
| 4343 Danville St | 0.67mi | 3/2.0 | 1,162 (+0%) | 22mo | $62,000 | $53 | 49 |
| 4397 Danville St | 0.67mi | 3/2.0 | 1,134 (-2%) | 22mo | $70,000 | $62 | 47 |
| 4501 Guilford Rd | 0.51mi | 3/1.0 | 1,040 (-10%) | 18mo | $78,000 | $75 | 40 |
Match score weights: distance 35% · size 25% · config 20% · recency 20%. Top-matched comps best support the ARV.
Projected returns pro-forma
2.71% appreciation · 3.0% rent growth · sell at horizon
- IRR
- 24.3%
- Equity multiple
- 2.36×
- Total profit
- $38,057
- Equity at exit
- $43,279
- IRR
- 25.4%
- Equity multiple
- 4.53×
- Total profit
- $98,748
- Equity at exit
- $65,449
Cash invested: $27,972 (down + closing). Projections, not guarantees.
Landlord ↔ Tenant lean methodology
- Overall (STATE)
- 90 Strongly Landlord-Friendly
- State Alabama
- 90 Strongly Landlord-Friendly · R+15
- County
- — inherits STATE
- City
- — inherits STATE
ZIP-level market 36108
- Home prices YoY
- 2.9%
- Active inventory
- 65
- Price-to-rent
- 6.2×
Monthly cashflow live
- Estimated rent
- $1,340 medium interval (Pro) →
- Mortgage (P&I)
- −$524
- Tax from tax record
- −$60 /mo · $717/yr
- Insurance
- −$42
- HOA
- −$0
- Vacancy / Maint / Mgmt
- −$281
- Net cashflow
- $433
Break-even live
UW: 25.0% down · 7.5% · 30yr · 1.5% tax · 5.0% vac · 8.0% maint · 8.0% mgmt
Financing live
Cash to close
- Down payment
- $24,975
- Closing costs
- $2,997
- Reserves months
- —
- Total cash needed
- —
Loan-product check · same deal, 3 products live
Conventional
25% down · 7.5% · 30yr
- Down + closing
- —
- Monthly P&I
- —
- Monthly cashflow
- —
- DSCR
- —
- Eligible?
- —
Personal DTI + credit; lowest rate.
DSCR
20% down · 8.5% · 30yr
- Down + closing
- —
- Monthly P&I
- —
- Monthly cashflow
- —
- DSCR
- —
- Eligible?
- —
No personal income docs; deal must DSCR.
Hard money
10% down · 12.0% · 12mo
- Down + closing
- —
- Monthly P&I
- —
- Monthly cashflow
- —
- DSCR
- —
- Eligible?
- —
Short-term bridge; refi at stabilization.
Listing history 19 events
-
2026-06-18days on market $99,900 Active 43 DOM
-
2026-06-17price $99,900 Active 42 DOM
-
2026-06-17days on market $105,000 Active 42 DOM
-
2026-06-16days on market $105,000 Active 41 DOM
-
2026-06-15days on market $105,000 Active 40 DOM
-
2026-06-14days on market $105,000 Active 38 DOM
-
2026-06-13days on market $105,000 Active 37 DOM
-
2026-06-10days on market $105,000 Active 35 DOM
-
2026-06-09days on market $105,000 Active 34 DOM
-
2026-06-08days on market $105,000 Active 33 DOM
-
2026-06-07days on market $105,000 Active 32 DOM
-
2026-06-03days on market $105,000 Active 28 DOM
-
2026-06-02days on market $105,000 Active 27 DOM
-
2026-06-01days on market $105,000 Active 26 DOM
-
2026-05-31days on market $105,000 Active 25 DOM
-
2026-05-30days on market $105,000 Active 24 DOM
-
2026-05-06$105,000 Active 293-char remark
-
2023-04-25soldstatus $600,000
-
2018-08-10soldstatus $1,343,000
ⓘ Source: listings_history table (triggers on properties + properties_extension) + one-shot
backfill from property_details.listing_events for pre-trigger history.
Tax reassessment forecast AL · Resets to sale price
- Current annual tax
- $717 · $60/mo
- Projected year-2 tax
- $717 · $60/mo
- Expected delta
- $0/yr ($0/mo · 0.0%)
ⓘ Screening estimate from a state-policy table — verify with the county assessor before closing.
Climate risk First Street
- Flood 1/10 Low FEMA zone X (unshaded) · 0% chance over 30 yrs
- Wildfire 4/10 Moderate
- Heat 7/10 Severe 7 d/yr ≥108°F today · 20 d/yr by 30 yrs out
- Wind 8/10 Severe 80% chance of damaging wind over 30 yrs
- Air quality 2/10 Low 1 unhealthy d/yr today · 1 by 30 yrs out
Nearby sold comps map
Loading sold comps map…
Walkable amenities ~0.75 mi
Loading nearby amenities…
Taxation est. · year 1
- Rental income
- $16,076
- − Mortgage interest
- −$5,596
- − Property taxes
- −$717
- − Insurance
- −$500
- − Repairs & maintenance
- −$1,286
- − Management
- −$1,286
- − Depreciation
- −$2,906
- Taxable income
- $3,786
- Est. tax owed @ 24.0%
- −$909
- After-tax cash flow
- $4,289/yr
For passive investors: Depreciation is non-cash, so a rental often shows a tax loss while cash-flowing — sheltering income. Rental losses are passive: they offset passive income freely, and up to $25,000/yr can offset ordinary (W-2) income if you actively participate and your MAGI is under $100k (phasing out to $0 by $150k); unused losses carry forward. On sale, claimed depreciation is recaptured at up to 25%, and gains may owe capital-gains tax (a 1031 exchange can defer both). Figures are a year-1 estimate at your 24.0% rate — not tax advice; consult a CPA.
Schools (NCES district)
- District
- Montgomery County
- NCES district ID
- 0102430
- Math proficiency
- 9% ▼ -21.00%
- Reading proficiency
- 31% ▼ -1.00%
- Median HH income
- $43,902
- Composite
- 17.24/100
- National rank
- #9093
- State rank
- #106 of 129 in AL
Livability — Montgomery
- Score
- 65/100
- State rank
- #138
- US rank
- #13416
Category grades
Schools grade is shown separately in the Schools card above.
Census & demographics
- Census place
- Montgomery, AL
- City population
- 175,913
- Population (ZIP)
- 15,549
Population outlook (Montgomery County) Hauer SSP2
- Today (2025)
- 224,008 people
- By 2030
- 221,460 · -1.1%
- By 2040
- 214,179 · -4.4%
- By 2050
- 204,912 · -8.5%
- By 2075
- 177,821 · -20.6%
- By 2100
- 145,134 · -35.2%
Race, ethnicity, and origin ACS 2023
- Neighborhood character
- Predominantly Black (82%)
- Race & ethnicity
- Black 82% White 10% Hispanic / Latino 6% Two or more races 2%
- Hispanic origin (detail)
- Mexican 4% Puerto Rican 1%
- Foreign-born
- 2% · Canada
- Languages at home
- 96% English-only · Spanish 3%
Political lean MEDSL · Montgomery
- 2024 margin
- Solid D (+30.7) · D 64.8% · R 34.1% · Other 1.1%
- 2008→2024 swing
- +11.5pp toward D · 2008: 19.2pp · 2024: 30.7pp
- All cycles
- 2024: D+30.7 2020: D+31.5 2016: D+26.2 2012: D+24.3 2008: D+19.2
Not yet ingested
- Civics
- —
Market trends
- HPI YoY
- ▲ 2.71%
- Current HPI
- 95.2405
- Rent YoY
- —
- Metro
- —
- State GDP YoY
- ▲ 2.94%
- F500 in state
- 4
Industry mix (Fortune 500 HQ in AL)
| Industry | F500 HQs | Revenue |
|---|---|---|
| Financial Services | 1 | $8B |
|
||
| Healthcare | 1 | $5B |
|
||
Price history
-92.6% since first listed4 events — show timeline
- 2026-06-17 Price Changed $99,900 MAAR
- 2026-05-06 Listed $105,000 MAAR
- 2023-04-25 Sold (Public Records) $600,000 Public Records
- 2018-08-10 Sold (Public Records) $1,343,000 Public Records
Property tax history
+5.0%/yrLatest (2025): $717 · +6.9% YoY. Source: county tax records.
Cash-flow waterfall
monthlySold comps — $/sqft
last 12 mo · ≤1 miLoading sold comps…