 🏢 Co-op
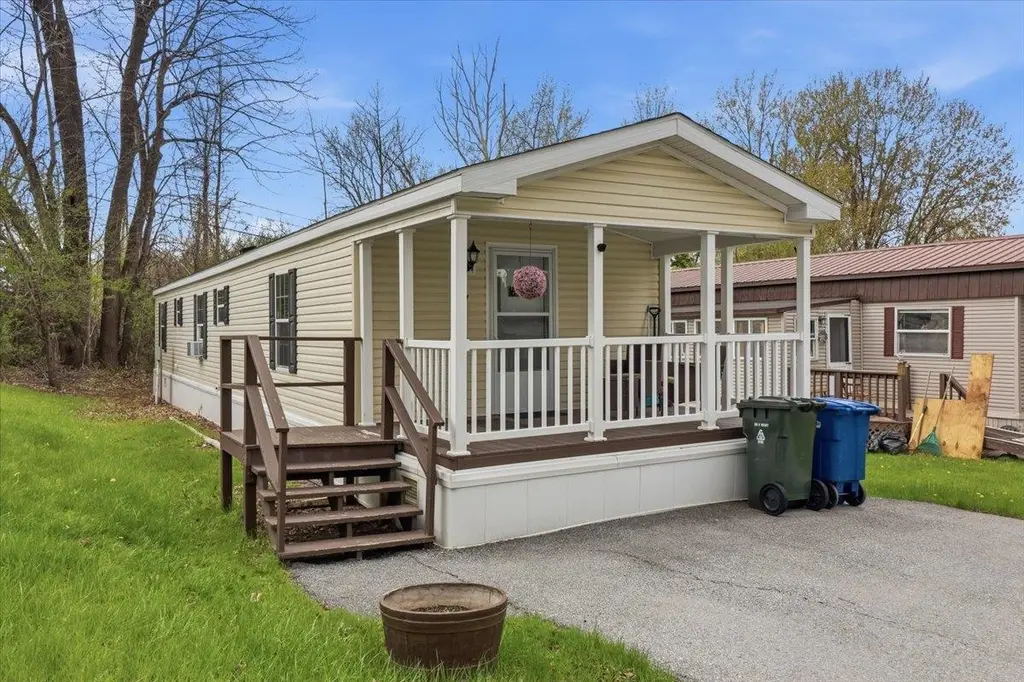
37 Penny Ln · Shelburne, VT
Flood risk 1/10 · Minimal
- FEMA flood zone
- X (unshaded)
- Chance of flooding over 30 yrs
- 0.0%
- Est. flood insurance / yr
- $507 – $1,088
Fire risk 1/10 · Minimal
- Est. fire insurance / yr
- $480 – $892
Heat risk 3/10 · Minor
- Hot days now (above 93°F)
- 7 days/yr
- Hot days in 30 yrs
- 15 days/yr
Wind risk 2/10 · Minimal
- Chance of severe wind over 30 yrs
- 1.0%
Air-quality risk 2/10 · Minimal
- Unhealthy air days now
- 1 days/yr
- Unhealthy air days in 30 yrs
- 1 days/yr
Risk factors via First Street. Map © Google.
Why this score? — see what drove the B grade
The composite is a weighted blend of 9 inputs, each scored 0–100. Each bar is that input's sub-score; the figure is the points it added to the 100-point composite (weight × sub-score).
- Cash flow +30.0/30.0
- 1% rule +10.0/10.0
- DSCR +10.0/10.0
- ARV discount +7.5/15.0
- Schools +5.0/10.0
- Livability +3.8/5.0
- Rent growth +2.5/5.0
- Condition / age +2.5/5.0
- Appreciation +0.0/10.0
$129,900
🖨 Deal sheet 📄 Offer letter ✓ Due diligence
Listing remarks
Well maintained 2 bedroom, 1 bath manufactured home built in 2011 and conveniently located in the Lake View Cooperative community just off Route 7 in desirable Shelburne. This bright and inviting home offers an open concept living area, spacious kitchen with ample cabinet space, laminate flooring, and a comfortable layout ideal for easy living. Enjoy the covered front porch, paved driveway, and manageable yard space with parking for 2. Conveniently located close to shopping, restaurants, schools, and just minutes to Burlington, while still offering a quiet neighborhood setting. Affordable and move in ready opportunity in a sought-after location.
Key facts
- Covered front porch
- Spacious kitchen
- Paved driveway
Tags
Property features AI
Finance
- Other: Located on a privately maintained private road; Mobile make: Commodore; model: Providence-JB537A
- HOA & community: Co-op park membership at Lakeview Coop; Monthly fee of 349 covering plowing and trash removal; Park approval required
Exterior
- Parking: Paved driveway
- Utilities: Public water; Public sewer; Circuit breaker electrical service; Internet available (Cable); Cable service (Xfinity); Fuel delivered by Robinson Fuels
- Home design: Manufactured home (Manuf/Mobile); Single-story; Entry on main level; Shingle - Architectural roof
- Construction: Built in 2011; Vinyl siding; Manufactured home structure
- Exterior features: Level lot; Paved driveway; Yellow exterior color
Interior
- Kitchen: Dishwasher; Microwave; Electric range; Refrigerator
- Bedrooms: Master bedroom on main level; Second bedroom on main level
- Flooring: Laminate flooring
- Bathrooms: One full bathroom
- Heating & cooling: Kerosene heat; Forced air
- Interior features: Four total rooms; No basement
- Laundry & utility: Washer; Dryer; Electric water heater (owned)
Neighborhood map
What this means for you Summary
Snapshot
- This is a 2-bed/1.0-bath manufactured listed at $130k.
Deal economics
- At list price, monthly cash flow is $564 ($7k/yr) — positive.
- The deal already cash-flows at list — no discount required.
- Meets the 1% rule at list price ($2k rent vs $130k).
- Recommended offer: $126k (3.0% below list) — sets the bar for market timing.
- Cap rate 11.5% vs local median 2.1% in Shelburne — top-decile yield for the area; either an underpriced asset or a hidden risk that comps aren't pricing in. Stress-test before assuming the spread holds.
Location & tenants
- Location reads 76/100 on livability (#14 in VT, #3,526 nationally) — a middle-class / working-renter tenant base. Strengths: crime A+, employment A+, housing A+; Watch: amenities F, commute F, cost of living F.
- Zoned schools: Shelburne Community School (math 47% / reading 65%, grade C+, #29 of 192 statewide, top 15%, 736 students, 14% FRL).
- Market conditions: 43 active listings in the ZIP; 3 comparable units currently listed for rent nearby; rentals at typical pace (median 21d on market — plan ~3-4 weeks tenant-placement turnaround); 898 units permitted in Chittenden County in 2024 (554 in 5+ unit buildings).
Forward outlook
- Local home prices are declining (-3.0%/yr); year-one equity from $898 of loan paydown is wiped out by about $4k of value loss. Plan a longer hold.
- Chittenden County population projected at +8% by 2050 — modest demand growth; plan on rents tracking national, not racing it.
- At projected returns (-3.0% appreciation + 3.0% rent growth), your $36k cash investment doubles in ~7 years — after that, you're playing with house money.
Negotiation context
- It's been on market 34 days — a 3% lower offer ($126k) is reasonable based on typical stale-listing flexibility.
- Current owner paid $56k; list at $130k implies a 132% gain — meaningful room to come down on a strong offer.
Questions for the listing agent
- It's been on market 34 days. Have you received any prior offers? Is the seller open to a 3% concession, seller financing, or rate buy-down credit?
- What does the HOA fee cover, when was the last increase, and are there any pending special assessments or reserve-fund shortfalls?
- Is there a deadline driving the sale (1031 exchange, divorce, estate, relocation)? That informs how much negotiation room exists.
- Schools are D-rated, which usually means shorter tenancies and higher turnover. Who's the typical renter profile here, and what's been the actual vacancy rate?
- What's the average days-on-market for RENTAL listings here right now (not sales)? A rising rental-DOM trend means longer vacancies and softer asking-rent achievability than the comps imply.
- What's the recent tenant-quality profile in this submarket — average credit score on applications, eviction rate, late-payment / NSF rate, and stable-employment percentage? A property-management company in the area should have these aggregated.
- How much new for-sale + rental construction is in the pipeline within 1–3 miles? Heavy new supply typically softens prices + rents 12–24 months out; constrained supply supports both.
Investment metrics
- 1% rule
- 1.72% ✓
- Cap rate
- 11.50%
- Cash-on-cash
- 18.61%
- DSCR
- 1.83
- GRM
- 4.8
CMA / ARV
- ARV (median comp)
- $74,986
- List price
- $129,900
- Delta
- 73.23%
- Verdict
- OVERPRICED
- Comps
- 6 within 1.0 mi
Show comp detail 7 sales within ~0.75 mi
| Address | Dist | Beds/Ba | Sqft | Sold | Price | $/sf | Match |
|---|---|---|---|---|---|---|---|
| 287 Penny Ln | 0.14mi | 2/1.5 | 848 (+1%) | 1mo | $89,900 | $106 | 89 |
| 208 Penny Ln | 0.14mi | 2/1.0 | 840 (0%) | 7mo | $31,000 | $37 | 88 |
| 363 Penny Ln | 0.06mi | 2/1.0 | 924 (+10%) | 2mo | $45,000 | $49 | 79 |
| 376 Penny Ln | 0.05mi | 2/1.5 | 920 (+10%) | 2mo | $156,000 | $170 | 79 |
| 278 Penny Ln | 0.15mi | 2/1.0 | 924 (+10%) | 4mo | $89,937 | $97 | 73 |
| 197 Penny Ln | 0.12mi | 2/1.0 | 750 (-11%) | 10mo | $59,900 | $80 | 68 |
| 338 Penny Ln | 0.08mi | 2/1.5 | 784 (-7%) | 23mo | $139,600 | $178 | 64 |
Match score weights: distance 35% · size 25% · config 20% · recency 20%. Top-matched comps best support the ARV.
Projected returns pro-forma
-3.0% appreciation · 3.0% rent growth · sell at horizon
- IRR
- 10.5%
- Equity multiple
- 1.42×
- Total profit
- $15,099
- Equity at exit
- $19,369
- IRR
- 19.7%
- Equity multiple
- 2.66×
- Total profit
- $60,307
- Equity at exit
- $11,231
Cash invested: $36,372 (down + closing). Projections, not guarantees.
Landlord ↔ Tenant lean methodology
- Overall (STATE)
- 41 Moderately Tenant-Leaning
- State Vermont
- 41 Moderately Tenant-Leaning · D+15
- County
- — inherits STATE
- City
- — inherits STATE
ZIP-level market 05482
- Active inventory
- 43
- Price-to-rent
- 4.8×
Monthly cashflow live
- Estimated rent
- $2,235 medium interval (Pro) →
- Mortgage (P&I)
- −$681
- Tax from tax record
- −$117 /mo · $1,403/yr
- Insurance
- −$54
- HOA
- −$349
- Vacancy / Maint / Mgmt
- −$469
- Net cashflow
- $564
Break-even live
UW: 25.0% down · 7.5% · 30yr · 1.5% tax · 5.0% vac · 8.0% maint · 8.0% mgmt
Financing live
Cash to close
- Down payment
- $32,475
- Closing costs
- $3,897
- Reserves months
- —
- Total cash needed
- —
Loan-product check · same deal, 3 products live
Conventional
25% down · 7.5% · 30yr
- Down + closing
- —
- Monthly P&I
- —
- Monthly cashflow
- —
- DSCR
- —
- Eligible?
- —
Personal DTI + credit; lowest rate.
DSCR
20% down · 8.5% · 30yr
- Down + closing
- —
- Monthly P&I
- —
- Monthly cashflow
- —
- DSCR
- —
- Eligible?
- —
No personal income docs; deal must DSCR.
Hard money
10% down · 12.0% · 12mo
- Down + closing
- —
- Monthly P&I
- —
- Monthly cashflow
- —
- DSCR
- —
- Eligible?
- —
Short-term bridge; refi at stabilization.
Rent comps 3 comps
| Address | Beds | Baths | Sqft | Rent | $/sqft | DOM | Units | Dist |
|---|---|---|---|---|---|---|---|---|
| 150 Allen Rd South Burlington, VT | 1.0 | 1.0 | 860 | $2,000 | $2.33 | 21d | 1 | 0.64mi |
| 151 Larkin Way South Burlington, VT | 2.0 | 1.0–2.0 | 709 | $2,600 | $3.66 | 21d | 3 | 0.71mi |
| 1 Olde Orchard Park South Burlington, VT | 2.0 | 1.0 | 994 | $2,100 | $2.11 | 21d | 1 | 1.48mi |
HOA detail
- Monthly dues
- $349 · $4,188/yr
Listing history 19 events
-
2026-06-17status $129,900 Pending 34 DOM
-
2026-06-17days on market $129,900 Active 34 DOM
-
2026-06-16days on market $129,900 Active 33 DOM
-
2026-06-15days on market $129,900 Active 32 DOM
-
2026-06-14days on market $129,900 Active 30 DOM
-
2026-06-13days on market $129,900 Active 29 DOM
-
2026-06-10days on market $129,900 Active 27 DOM
-
2026-06-09days on market $129,900 Active 26 DOM
-
2026-06-08days on market $129,900 Active 25 DOM
-
2026-06-07pricedays on market $129,900 Active 24 DOM
-
2026-06-02days on market $139,900 Active 19 DOM
-
2026-06-01days on market $139,900 Active 18 DOM
-
2026-05-31days on market $139,900 Active 17 DOM
-
2026-05-30days on market $139,900 Active 16 DOM
-
2026-05-14$139,900 Active 653-char remark
-
2012-09-17soldstatus $56,000
-
2010-06-09soldstatus $10,800
-
2002-01-03soldstatus $8,231
-
2001-04-20soldstatus $10,900
ⓘ Source: listings_history table (triggers on properties + properties_extension) + one-shot
backfill from property_details.listing_events for pre-trigger history.
Tax reassessment forecast VT · Partial reset (capped growth)
- Current annual tax
- $1,403 · $117/mo
- Projected year-2 tax
- $1,936 · $161/mo
- Expected delta
- +$532/yr (+$44/mo · 37.9%)
ⓘ Screening estimate from a state-policy table — verify with the county assessor before closing.
Climate risk First Street
- Flood 1/10 Low FEMA zone X (unshaded) · 0% chance over 30 yrs
- Wildfire 1/10 Low
- Heat 3/10 Moderate 7 d/yr ≥93°F today · 15 d/yr by 30 yrs out
- Wind 2/10 Low 100% chance of damaging wind over 30 yrs
- Air quality 2/10 Low 1 unhealthy d/yr today · 1 by 30 yrs out
Nearby sold comps map
Loading sold comps map…
Walkable amenities ~0.75 mi
Loading nearby amenities…
Taxation est. · year 1
- Rental income
- $26,816
- − Mortgage interest
- −$7,276
- − Property taxes
- −$1,403
- − Insurance
- −$650
- − Repairs & maintenance
- −$2,145
- − Management
- −$2,145
- − HOA
- −$4,188
- − Depreciation
- −$3,779
- Taxable income
- $5,229
- Est. tax owed @ 24.0%
- −$1,255
- After-tax cash flow
- $5,514/yr
For passive investors: Depreciation is non-cash, so a rental often shows a tax loss while cash-flowing — sheltering income. Rental losses are passive: they offset passive income freely, and up to $25,000/yr can offset ordinary (W-2) income if you actively participate and your MAGI is under $100k (phasing out to $0 by $150k); unused losses carry forward. On sale, claimed depreciation is recaptured at up to 25%, and gains may owe capital-gains tax (a 1031 exchange can defer both). Figures are a year-1 estimate at your 24.0% rate — not tax advice; consult a CPA.
Schools (NCES district)
No district data.
Livability — Shelburne
- Score
- 76/100
- State rank
- #14
- US rank
- #3526
Category grades
Schools grade is shown separately in the Schools card above.
Census & demographics
- Census place
- Shelburne, VT
- Population (ZIP)
- 7,844
Population outlook (Chittenden County) Hauer SSP2
- Today (2025)
- 170,769 people
- By 2030
- 174,716 · +2.3%
- By 2040
- 180,337 · +5.6%
- By 2050
- 183,768 · +7.6%
- By 2075
- 194,646 · +14.0%
- By 2100
- 194,933 · +14.2%
Race, ethnicity, and origin ACS 2023
- Neighborhood character
- Predominantly White (88%)
- Race & ethnicity
- White 88% Two or more races 6% Asian 4% Hispanic / Latino 3%
- Common ancestry
- Lithuanian 8% Slovak 5% Italian 3%
- Foreign-born
- 10% · Canada, Jamaica
- Languages at home
- 94% English-only · French/Haitian/Cajun 2% Other Indo-European 2% Russian/Polish/Slavic 1%
Political lean MEDSL · Chittenden
- 2024 margin
- Solid D (+53.6) · D 75.4% · R 21.7% · Other 2.9%
- 2008→2024 swing
- +8.9pp toward D · 2008: 44.8pp · 2024: 53.6pp
- All cycles
- 2024: D+53.6 2020: D+54.5 2016: D+46.8 2012: D+41.9 2008: D+44.8
Not yet ingested
- Civics
- —
Market trends
- HPI YoY
- ▼ -106.42%
- Current HPI
- 172.0031
- Rent YoY
- —
- Metro
- —
- State GDP YoY
- —
- F500 in state
- 0
Price history
+1091.7% since first listed7 events — show timeline
- 2026-06-17 Pending — PrimeMLS
- 2026-06-03 Price Changed $129,900 PrimeMLS
- 2026-05-14 Listed $139,900 PrimeMLS
- 2012-09-17 Sold (Public Records) $56,000 Public Records
- 2010-06-09 Sold (Public Records) $10,800 Public Records
- 2002-01-03 Sold (Public Records) $8,231 Public Records
- 2001-04-20 Sold (Public Records) $10,900 Public Records
Property tax history
+2.8%/yrLatest (2024): $1,403 · +16.6% YoY. Source: county tax records.
Cash-flow waterfall
monthlySold comps — $/sqft
last 12 mo · ≤1 miLoading sold comps…