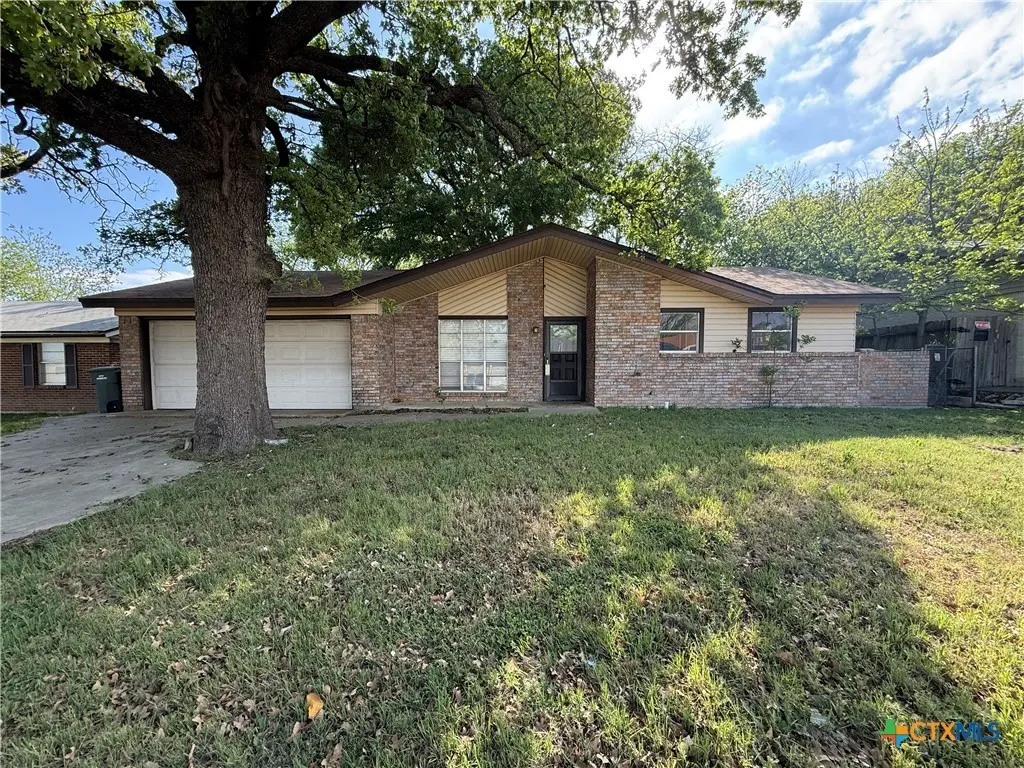
705 Kate St · Copperas Cove, TX
Flood risk 1/10 · Minimal
- FEMA flood zone
- X (unshaded)
- Chance of flooding over 30 yrs
- 0.0%
- Est. flood insurance / yr
- $507 – $1,088
Fire risk 6/10 · Moderate
- Est. fire insurance / yr
- $1,222 – $2,270
Heat risk 7/10 · Major
- Hot days now (above 106°F)
- 7 days/yr
- Hot days in 30 yrs
- 23 days/yr
Wind risk 6/10 · Moderate
- Chance of severe wind over 30 yrs
- 51.0%
Air-quality risk 1/10 · Minimal
- Unhealthy air days now
- 0 days/yr
- Unhealthy air days in 30 yrs
- 0 days/yr
Risk factors via First Street. Map © Google.
Why this score? — see what drove the C- grade
The composite is a weighted blend of 9 inputs, each scored 0–100. Each bar is that input's sub-score; the figure is the points it added to the 100-point composite (weight × sub-score).
- Cash flow +15.6/30.0
- ARV discount +15.0/15.0
- 1% rule +4.9/10.0
- DSCR +4.8/10.0
- Schools +3.6/10.0
- Livability +3.2/5.0
- Condition / age +2.5/5.0
- Rent growth +2.4/5.0
- Appreciation +0.0/10.0
$153,000
🖨 Deal sheet (PDF) 📄 Offer letter ✓ Due diligence
Listing remarks
You don't want to miss out on this!!! Inside you have multiple living rooms, large wood burning fireplace. Good size bedrooms and 2 full bath. Outside, a yard full of mature trees. Come and see it today!!!!
Key facts
- 8,398 sq ft lot
- 2 garage spots
- Built 1971
Tags
Property features AI
Finance
- HOA & community: Curbs and sidewalks in the community
Exterior
- Parking: 2-car garage
- Utilities: Public water; Public sewer; Public trash collection
- Home design: Single-story brick home; Slab foundation; Composition/Shingle roof
- Construction: Brick construction; Built (year from assessor)
- Exterior features: Patio; Back yard fencing
Interior
- Kitchen: Dishwasher; Gas range; Some gas appliances
- Bedrooms: Bedroom 2; Bedroom 3
- Flooring: Carpet; Ceramic tile
- Bathrooms: 2 full bathrooms
- Heating & cooling: Heating (present); One cooling unit
- Interior features: Ceiling fans; Vanity; Wood-burning fireplace in the living room
- Laundry & utility: Washer hookup; Electric dryer hookup; Laundry room / laundry in utility room
Neighborhood map
What this means for you Summary
Snapshot
- This is a 3-bed/2.0-bath single-family listed at $153k.
Deal economics
- At list price, monthly cash flow is $65 ($783/yr) — positive.
- The deal already cash-flows at list — no discount required.
- To meet the 1% rule (rent ≥ 1% of price), the offer needs to be $152k (0.9% below list).
- Recommended offer: $148k (3.0% below list) — sets the bar for market timing.
- Cap rate 6.8% vs local median 3.4% in Copperas Cove — top-decile yield for the area; either an underpriced asset or a hidden risk that comps aren't pricing in. Stress-test before assuming the spread holds.
Location & tenants
- Location reads 65/100 on livability (#706 in TX) — a middle-class / working-renter tenant base. Strengths: cost of living A+, housing A+; Watch: schools C-, employment D+, amenities F.
- Copperas Cove ISD (suburban): math 41% / reading 42% proficiency, ranked #340 of 826 in TX (top 41%) — families likely to look elsewhere, expect single-tenant / working-renter base with shorter leases.
- Market conditions: Rents soft (-0.2%/yr); 605 active listings in the ZIP; 40 comparable units currently listed for rent nearby; rentals at typical pace (median 24d on market — plan ~3-4 weeks tenant-placement turnaround); 48% of comp listings sitting > 30 days — soft ceiling on asking rent; 386 units permitted in Coryell County in 2024 (0 in 5+ unit buildings).
Forward outlook
- Local home prices are declining (-3.0%/yr); year-one equity from $1k of loan paydown is wiped out by about $5k of value loss. Plan a longer hold.
Negotiation context
- It's been on market 56 days — a 3% lower offer ($148k) is reasonable based on typical stale-listing flexibility.
- 7 sale attempts since 19y ago; this cycle's ask has dropped $10k (6%) from the opening price — seller is motivated, your offer sets the floor, not the list.
Risks & watch-outs
- Climate carrying-cost: major wind risk, 51% chance of damaging wind over 30y; major wildfire risk; extreme-heat days projected 7→23/yr by 2055 (HVAC capex compounding) — expect insurance premiums to compound above CPI over the hold.
Questions for the listing agent
- It's been on market 56 days. Have you received any prior offers? Is the seller open to a 3% concession, seller financing, or rate buy-down credit?
- Built in 1971 — when were the roof, HVAC, electrical panel, plumbing, and water heater last replaced?
- Is there a deadline driving the sale (1031 exchange, divorce, estate, relocation)? That informs how much negotiation room exists.
- What's the average days-on-market for RENTAL listings here right now (not sales)? A rising rental-DOM trend means longer vacancies and softer asking-rent achievability than the comps imply.
- What's the recent tenant-quality profile in this submarket — average credit score on applications, eviction rate, late-payment / NSF rate, and stable-employment percentage? A property-management company in the area should have these aggregated.
- How much new for-sale + rental construction is in the pipeline within 1–3 miles? Heavy new supply typically softens prices + rents 12–24 months out; constrained supply supports both.
Investment metrics
- 1% rule
- 0.99% ✗
- Cap rate
- 6.80%
- Cash-on-cash
- 1.83%
- DSCR
- 1.08
- GRM
- 8.4
CMA / ARV
- ARV (median comp)
- $201,967
- List price
- $153,000
- Delta
- -24.25%
- Verdict
- UNDERPRICED
- Comps
- 20 within 1.0 mi
Show comp detail 12 sales within ~0.75 mi
| Address | Dist | Beds/Ba | Sqft | Sold | Price | $/sf | Match |
|---|---|---|---|---|---|---|---|
| 905 Vernon Dr | 0.22mi | 4/2.0 (+1) | 1,560 (+2%) | 1mo | $230,000 | $147 | 80 |
| 1503 Joe Morse Dr | 0.47mi | 4/2.0 (+1) | 1,513 (-1%) | 2mo | $153,000 | $101 | 70 |
| 1306 Amthor Ave | 0.23mi | 3/2.0 | 1,366 (-10%) | 3mo | $220,000 | $161 | 70 |
| 608 Allen St | 0.28mi | 3/2.0 | 1,736 (+14%) | 2mo | $210,000 | $121 | 62 |
| 1603 E Robertson Ave | 0.41mi | 3/2.0 | 1,320 (-13%) | 2mo | $160,000 | $121 | 57 |
| 805 Craddock St | 0.43mi | 3/2.0 | 1,714 (+12%) | 3mo | $217,500 | $127 | 57 |
| 604 Yucca Dr | 0.52mi | 3/2.0 | 1,724 (+13%) | 1mo | $142,000 | $82 | 53 |
| 116 Williams St | 0.64mi | 4/1.5 (+1) | 1,619 (+6%) | 2mo | $159,999 | $99 | 51 |
| 1805 E Robertson Ave | 0.59mi | 3/2.0 | 1,718 (+13%) | 2mo | $214,999 | $125 | 49 |
| 109 Ridge St | 0.60mi | 3/1.5 | 1,353 (-11%) | 3mo | $144,100 | $107 | 48 |
| 423 Jeffery Ln | 0.62mi | 4/2.0 (+1) | 1,685 (+11%) | 4mo | $214,900 | $128 | 45 |
| 440 Jeffery Ln | 0.66mi | 3/2.0 | 1,736 (+14%) | 2mo | $210,000 | $121 | 44 |
Match score weights: distance 35% · size 25% · config 20% · recency 20%. Top-matched comps best support the ARV.
Projected returns pro-forma
-3.0% appreciation · 0.0% rent growth · sell at horizon
- IRR
- -17.0%
- Equity multiple
- 0.42×
- Total profit
- $-25,009
- Equity at exit
- $22,813
- IRR
- -16.3%
- Equity multiple
- 0.22×
- Total profit
- $-33,312
- Equity at exit
- $13,229
Cash invested: $42,840 (down + closing). Projections, not guarantees.
Landlord ↔ Tenant lean methodology
- Overall (STATE)
- 87 Strongly Landlord-Friendly
- State Texas
- 87 Strongly Landlord-Friendly · R+5
- County
- — inherits STATE
- City
- — inherits STATE
ZIP-level market 76522
- Home prices YoY
- -22.4%
- Rents YoY
- -0.2%
- Active inventory
- 605
- Price-to-rent
- 8.4×
Monthly cashflow live
- Estimated rent
- $1,516 high interval (Pro) →
- Mortgage (P&I)
- −$802
- Tax from tax record
- −$266 /mo · $3,193/yr
- Insurance
- −$64
- HOA
- −$0
- Vacancy / Maint / Mgmt
- −$318
- Net cashflow
- $65
Break-even live
Sensitivity live
| Price | -10% $152 | -5% $109 | +0% $65 | +5% $22 | +10% $-21 |
|---|---|---|---|---|---|
| Rent | -10% $-54 | -5% $5 | +0% $65 | +5% $125 | +10% $185 |
| Rate | -1.0pp $142 | -0.5pp $104 | base $65 | +0.5pp $26 | +1.0pp $-15 |
UW: 25.0% down · 7.5% · 30yr · 1.5% tax · 5.0% vac · 8.0% maint · 8.0% mgmt
Financing live
Cash to close
- Down payment
- $38,250
- Closing costs
- $4,590
- Reserves months
- —
- Total cash needed
- —
Loan-product check · same deal, 3 products live
Conventional
25% down · 7.5% · 30yr
- Down + closing
- —
- Monthly P&I
- —
- Monthly cashflow
- —
- DSCR
- —
- Eligible?
- —
Personal DTI + credit; lowest rate.
DSCR
20% down · 8.5% · 30yr
- Down + closing
- —
- Monthly P&I
- —
- Monthly cashflow
- —
- DSCR
- —
- Eligible?
- —
No personal income docs; deal must DSCR.
Hard money
10% down · 12.0% · 12mo
- Down + closing
- —
- Monthly P&I
- —
- Monthly cashflow
- —
- DSCR
- —
- Eligible?
- —
Short-term bridge; refi at stabilization.
Rent comps 40 comps
| Address | Beds | Baths | Sqft | Rent | $/sqft | DOM | Units | Dist |
|---|---|---|---|---|---|---|---|---|
| 518 Kate St Copperas Cove, TX | 4.0 | 1.5 | 1302 | $1,595 | $1.23 | 44d | 1 | 0.14mi |
| 507 Kate St Copperas Cove, TX | 3.0 | 2.0 | 1280 | $1,295 | $1.01 | 24d | 1 | 0.19mi |
| 1306 Amthor Ave Copperas Cove, TX | 3.0 | 2.0 | 1366 | $1,399 | $1.02 | 44d | 1 | 0.20mi |
| 1102 Creek St Copperas Cove, TX | 4.0 | 2.5 | 1834 | $1,675 | $0.91 | 44d | 1 | 0.30mi |
| 408 Allen St Copperas Cove, TX | 3.0 | 1.0 | 1300 | $1,095 | $0.84 | 24d | 1 | 0.43mi |
| 704 Kim Ave Copperas Cove, TX | 3.0 | 2.0 | 1692 | $1,695 | $1.00 | 22d | 1 | 0.47mi |
| 304 Oak St Copperas Cove, TX | 3.0 | 1.0 | 1627 | $1,350 | $0.83 | 44d | 1 | 0.48mi |
| 1316 Liberation Ln Unit B Copperas Cove, TX | 3.0 | 2.0 | 1300 | $1,300 | $1.00 | 44d | 1 | 0.50mi |
| 917 Whirlaway Dr Copperas Cove, TX | 3.0 | 2.0 | 1300 | $1,500 | $1.15 | 44d | 1 | 0.51mi |
| 208 Oak St Copperas Cove, TX | 3.0 | 2.0 | 1822 | $1,495 | $0.82 | 24d | 1 | 0.51mi |
| 1564 Risen Star Ln Unit A Copperas Cove, TX | 3.0 | 2.0 | 1110 | $1,400 | $1.26 | 24d | 1 | 0.53mi |
| 1335 Liberation Ln Unit A Copperas Cove, TX | 3.0 | 2.0 | 1333 | $2,500 | $1.88 | 14d | 1 | 0.53mi |
| 1335 Liberation Ln Unit B Copperas Cove, TX | 3.0 | 2.0 | 1333 | $2,400 | $1.80 | 14d | 1 | 0.53mi |
| 1243 Liberation Ln Unit A Copperas Cove, TX | 3.0 | 2.0 | 1309 | $1,249 | $0.95 | 44d | 1 | 0.54mi |
| 303 Margaret Lee St Copperas Cove, TX | 3.0 | 1.0 | 1124 | $915 | $0.81 | 14d | 1 | 0.54mi |
| 613 Cedar Dr Copperas Cove, TX | 3.0 | 2.5 | 2108 | $2,750 | $1.30 | 44d | 1 | 0.55mi |
| 1614 Risen Star Ln Unit B Copperas Cove, TX | 3.0 | 2.0 | 2220 | $1,450 | $0.65 | 24d | 1 | 0.57mi |
| 1002 Northern Dancer Dr Copperas Cove, TX | 4.0 | 2.0 | 1605 | $1,750 | $1.09 | 44d | 1 | 0.58mi |
| 924 Northern Dancer Dr Copperas Cove, TX | 4.0 | 2.0 | 1610 | $1,650 | $1.02 | 44d | 1 | 0.59mi |
| 107 Nauert St Copperas Cove, TX | 3.0 | 2.0 | 1710 | $1,300 | $0.76 | 44d | 1 | 0.59mi |
| 105 Nauert St Copperas Cove, TX | 4.0 | 1.0 | 1346 | $1,395 | $1.04 | 24d | 1 | 0.61mi |
| 1104 Cummings Ave Copperas Cove, TX | 3.0 | 2.0 | 1542 | $1,395 | $0.90 | 44d | 1 | 0.63mi |
| 1714 Risen Star Ln Unit A Copperas Cove, TX | 3.0 | 2.5 | 1213 | $1,325 | $1.09 | 24d | 1 | 0.63mi |
| 1714 Risen Star Ln Unit A Copperas Cove, TX | 3.0 | 2.5 | 1213 | $1,325 | $1.09 | 44d | 1 | 0.63mi |
| 418 Cottonwood Dr Copperas Cove, TX | 3.0 | 2.0 | 1208 | $1,495 | $1.24 | 44d | 1 | 0.63mi |
| 1106 Pack Ave Copperas Cove, TX | 3.0 | 2.0 | 1302 | $1,275 | $0.98 | 44d | 1 | 0.76mi |
| 809 Shady Ln Copperas Cove, TX | 4.0 | 1.5 | 1900 | $1,600 | $0.84 | 14d | 1 | 0.84mi |
| 2315 E Business 190 Copperas Cove, TX | 3.0 | 2.0 | 2103 | $1,700 | $0.81 | 24d | 1 | 0.85mi |
| 914 Chalk St Copperas Cove, TX | 3.0 | 2.0 | 1107 | $1,200 | $1.08 | 24d | 1 | 0.93mi |
| 202 Marston Ave Unit B Copperas Cove, TX | 3.0 | 2.0 | 1200 | $1,350 | $1.12 | 24d | 1 | 0.97mi |
| 202 Marston Ave Unit B Copperas Cove, TX | 3.0 | 2.0 | 1200 | $1,350 | $1.12 | 44d | 1 | 0.97mi |
| 912 Laurie Ln Copperas Cove, TX | 3.0 | 2.0 | 2080 | $1,700 | $0.82 | 14d | 1 | 1.05mi |
| 902 Lynn Ln Copperas Cove, TX | 3.0 | 2.0 | 1661 | $1,600 | $0.96 | 14d | 1 | 1.11mi |
| 1202 S FM 116 Copperas Cove, TX | 1.0–3.0 | 1.0–2.0 | 922 | $1,560 | $1.69 | 14d | 12 | 1.27mi |
| 2619 Phyllis Dr Copperas Cove, TX | 3.0 | 2.0 | 1293 | $1,000 | $0.77 | 45d | 1 | 1.28mi |
| 1904 Pleasant Ln Copperas Cove, TX | 3.0 | 2.0 | 1352 | $1,400 | $1.04 | 44d | 1 | 1.29mi |
| 211 E Hogan Dr Copperas Cove, TX | 3.0 | 2.0 | 1372 | $1,400 | $1.02 | 14d | 1 | 1.29mi |
| 401 E Hogan Dr Copperas Cove, TX | 3.0 | 2.0 | 1826 | $1,475 | $0.81 | 44d | 1 | 1.31mi |
| 403 E Hogan Dr Copperas Cove, TX | 4.0 | 2.0 | 1492 | $1,675 | $1.12 | 24d | 1 | 1.31mi |
| 1816 S FM 116 Unit A Copperas Cove, TX | 3.0 | 2.0 | 1058 | $1,150 | $1.09 | 14d | 1 | 1.33mi |
Listing history 29 events
-
2026-06-18days on market $153,000 Active 56 DOM
-
2026-06-17days on market $153,000 Active 55 DOM
-
2026-06-16days on market $153,000 Active 54 DOM
-
2026-06-15days on market $153,000 Active 53 DOM
-
2026-06-14days on market $153,000 Active 51 DOM
-
2026-06-13days on market $153,000 Active 50 DOM
-
2026-06-10days on market $153,000 Active 48 DOM
-
2026-06-09days on market $153,000 Active 47 DOM
-
2026-06-08days on market $153,000 Active 46 DOM
-
2026-06-07days on market $153,000 Active 45 DOM
-
2026-06-05days on market $153,000 Active 42 DOM
-
2026-06-03days on market $153,000 Active 41 DOM
-
2026-06-02days on market $153,000 Active 40 DOM
-
2026-06-01pricedays on market $153,000 Active 39 DOM
-
2026-05-31days on market $162,500 Active 38 DOM
-
2026-05-30days on market $162,500 Active 37 DOM
-
2026-04-23$162,500 Active 206-char remark
-
2025-12-12historical
-
2025-10-29Active
-
2025-08-17status Active
-
2023-01-11soldstatus
-
2022-12-16status Pending
-
2022-12-07price $185,000
-
2022-11-24historical
-
2022-11-22status Active
-
2022-11-03$189,000 Active
-
2008-03-24soldstatus
-
2008-02-04$99,900
-
2007-10-27$67,500
ⓘ Source: listings_history table (triggers on properties + properties_extension) + one-shot
backfill from property_details.listing_events for pre-trigger history.
Tax reassessment forecast TX · Resets to sale price
- Current annual tax
- $3,193 · $266/mo
- Projected year-2 tax
- $3,193 · $266/mo
- Expected delta
- $0/yr ($0/mo · 0.0%)
ⓘ Screening estimate from a state-policy table — verify with the county assessor before closing.
Climate risk First Street
- Flood 1/10 Low FEMA zone X (unshaded) · 0% chance over 30 yrs
- Wildfire 6/10 Major
- Heat 7/10 Severe 7 d/yr ≥106°F today · 23 d/yr by 30 yrs out
- Wind 6/10 Major 51% chance of damaging wind over 30 yrs
- Air quality 1/10 Low 0 unhealthy d/yr today · 0 by 30 yrs out
Nearby sold comps map
Loading sold comps map…
Walkable amenities ~0.75 mi
Loading nearby amenities…
Taxation est. · year 1
- Rental income
- $18,189
- − Mortgage interest
- −$8,570
- − Property taxes
- −$3,193
- − Insurance
- −$765
- − Repairs & maintenance
- −$1,455
- − Management
- −$1,455
- − Depreciation
- −$4,451
- Taxable loss
- −$1,701
- Est. tax savings @ 24.0%
- +$408
- After-tax cash flow
- $1,191/yr
For passive investors: Depreciation is non-cash, so a rental often shows a tax loss while cash-flowing — sheltering income. Rental losses are passive: they offset passive income freely, and up to $25,000/yr can offset ordinary (W-2) income if you actively participate and your MAGI is under $100k (phasing out to $0 by $150k); unused losses carry forward. On sale, claimed depreciation is recaptured at up to 25%, and gains may owe capital-gains tax (a 1031 exchange can defer both). Figures are a year-1 estimate at your 24.0% rate — not tax advice; consult a CPA.
Schools (NCES district)
- District
- Copperas Cove ISD
- NCES district ID
- 4815240
- Math proficiency
- 41% ▼ -6.00%
- Reading proficiency
- 42% ▼ -2.00%
- Median HH income
- $51,072
- Composite
- 35.85/100
- National rank
- #4822
- State rank
- #340 of 826 in TX
Livability — Copperas Cove
- Score
- 65/100
- State rank
- #706
- US rank
- #13158
Category grades
Schools grade is shown separately in the Schools card above.
Census & demographics
- Census place
- Copperas Cove, TX
- County
- Coryell County · 61,053 people
- City population
- 42,118
- Metro
- Killeen-Temple, TX
- Population (ZIP)
- 42,118
- Household income
- $72,206
- Rent vs Own
- Severe rent burden
- 1019.0
Population outlook (Coryell County) Hauer SSP2
- Today (2025)
- 75,485 people
- By 2030
- 75,627 · +0.2%
- By 2040
- 74,898 · -0.8%
- By 2050
- 74,221 · -1.7%
- By 2075
- 72,688 · -3.7%
- By 2100
- 66,862 · -11.4%
Race, ethnicity, and origin ACS 2023
- Neighborhood character
- Diverse neighborhood (Simpson 0.66)
- Race & ethnicity
- White 53% Hispanic / Latino 21% Two or more races 20% Black 14% Asian 2%
- Hispanic origin (detail)
- Mexican 11% Puerto Rican 6%
- Common ancestry
- Romanian 2% Italian 2% Lithuanian 2%
- Foreign-born
- 7% · Canada, South Korea
- Languages at home
- 85% English-only · Spanish 10% German/W. Germanic 2% Other Asian/Pacific 1%
Political lean MEDSL · Coryell
- 2024 margin
- Solid R (+40.7) · D 29.1% · R 69.8% · Other 1.1%
- 2008→2024 swing
- -13.8pp toward R · 2008: -26.9pp · 2024: -40.7pp
- All cycles
- 2024: R+40.7 2020: R+33.5 2016: R+39.5 2012: R+36.6 2008: R+26.9
Not yet ingested
- Civics
- —
Market trends
- HPI YoY
- ▼ -53.11%
- Current HPI
- 183.9452
- Rent YoY
- ▼ -0.25%
- Metro
- Killeen-Temple, TX
- State GDP YoY
- ▲ 3.95%
- F500 in state
- 110
Industry mix (Fortune 500 HQ in TX)
| Industry | F500 HQs | Revenue |
|---|---|---|
| Energy | 16 | $1,198B |
|
||
| Technology | 5 | $198B |
|
||
| Engineering / Construction | 4 | $72B |
|
||
| Energy Services | 3 | $60B |
|
||
| Utilities | 3 | $41B |
|
||
| Healthcare | 2 | $330B |
|
||
Price history
+126.7% since first listed14 events — show timeline
- 2026-06-01 Price Changed $153,000 CTXMLS
- 2026-04-23 Listed $162,500 CTXMLS
- 2025-12-12 Listing Removed — CTXMLS
- 2025-10-29 Listed — Unlock MLS
- 2025-08-17 Relisted — CTXMLS
- 2023-01-11 Sold (Public Records) — Public Records
- 2022-12-16 Pending — CTXMLS
- 2022-12-07 Price Changed $185,000 CTXMLS
- 2022-11-24 Rental Removed — RENT.
- 2022-11-22 Relisted — CTXMLS
- 2022-11-03 Listed $189,000 CTXMLS
- 2008-03-24 Sold (Public Records) — Public Records
- 2008-02-04 Listed $99,900 CTXMLS
- 2007-10-27 Listed $67,500 CTXMLS
Property tax history
+1.7%/yrLatest (2025): $3,193 · -5.4% YoY. Source: county tax records.
Cash-flow waterfall
monthlySold comps — $/sqft
last 12 mo · ≤1 miLoading sold comps…