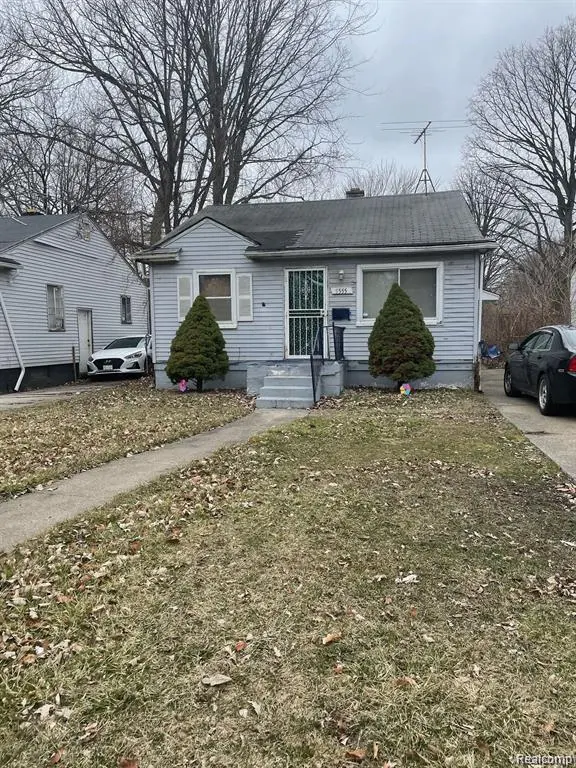
5555 Neff Ave · Detroit, MI
Flood risk 1/10 · Minimal
- FEMA flood zone
- X (unshaded)
- Chance of flooding over 30 yrs
- 0.0%
- Est. flood insurance / yr
- $473 – $860
Fire risk 1/10 · Minimal
- Est. fire insurance / yr
- $784 – $1,456
Heat risk 3/10 · Minor
- Hot days now (above 96°F)
- 7 days/yr
- Hot days in 30 yrs
- 15 days/yr
Wind risk 2/10 · Minimal
- Chance of severe wind over 30 yrs
- —
Air-quality risk 3/10 · Minor
- Unhealthy air days now
- 3 days/yr
- Unhealthy air days in 30 yrs
- 4 days/yr
Risk factors via First Street. Map © Google.
Why this score? — see what drove the B- grade
The composite is a weighted blend of 9 inputs, each scored 0–100. Each bar is that input's sub-score; the figure is the points it added to the 100-point composite (weight × sub-score).
- Cash flow +30.0/30.0
- 1% rule +10.0/10.0
- DSCR +10.0/10.0
- ARV discount +8.3/15.0
- Livability +3.7/5.0
- Rent growth +2.7/5.0
- Condition / age +2.5/5.0
- Schools +1.3/10.0
- Appreciation +0.0/10.0
$59,900
🖨 Deal sheet 📄 Offer letter ✓ Due diligence
Listing remarks MLS
Turnkey cash-flowing investment opportunity on Detroit's east side! Welcome to 5555 Neff Ave, Detroit, MI 48224, a solid rental property currently tenant-occupied and generating $1,100 per month in rental income. This property offers investors immediate cash flow from day one with a reliable tenant already in place. The home features a functional layout, spacious living areas, and strong long-term rental demand in a well-established neighborhood near East English Village and the Grosse Pointe border. Located close to schools, parks, shopping, and major commuter routes, this property sits in a high-demand rental corridor, making it a great addition to any buy-and-hold portfolio or investor looking to expand their Detroit rental holdings. Detroit continues to attract investors seeking affordable entry points and strong rental yields, and this property delivers both stability and income potential. Tenant occupied – please do not disturb tenant. For more information, contact: Samar Taha – 313-888-7653 (text preferred)
Key facts
- Functional layout
- 6,098 sq ft lot
- Built 1950
Tags
Neighborhood map
What this means for you Summary
Snapshot
- This is a 2-bed/1.0-bath single-family listed at $60k.
Deal economics
- At list price, monthly cash flow is $322 ($4k/yr) — positive.
- The deal already cash-flows at list — no discount required.
- Meets the 1% rule at list price ($1k rent vs $60k).
- Recommended offer: $56k (6.0% below list) — sets the bar for market timing.
- Cap rate 12.7% vs local median 10.2% in Detroit — meaningfully above typical; check what's discounted (condition, days-on-market, listing class) to confirm the premium yield is real.
Location & tenants
- Location reads 73/100 on livability (#218 in MI) — a middle-class / working-renter tenant base. Strengths: amenities A+, commute A+, cost of living A+; Watch: schools F, crime F, employment F.
- Detroit Public Schools Community District (urban): math 10% / reading 24% proficiency, ranked #499 of 540 in MI (top 92%) — low school quality limits family demand, transient renter base, plan for 1-2y turnover; 90% free/reduced lunch — lower-income household profile, screen leases tightly.
- Market conditions: Rents flat; 484 active listings in the ZIP; 14 comparable units currently listed for rent nearby; rentals at typical pace (median 24d on market — plan ~3-4 weeks tenant-placement turnaround); 43% of comp listings sitting > 30 days — soft ceiling on asking rent; lower-income renter base — watch delinquency; 2,639 units permitted in Wayne County in 2024 (1,216 in 5+ unit buildings).
Forward outlook
- Local home prices are declining (-3.0%/yr); year-one equity from $414 of loan paydown is wiped out by about $2k of value loss. Plan a longer hold.
- Wayne County population projected at -17% by 2050 — secular population decline; favor cash flow + early exit over multi-decade hold.
- At projected returns (-3.0% appreciation + 0.7% rent growth), your $17k cash investment doubles in ~7 years — after that, you're playing with house money.
Negotiation context
- It's been on market 80 days — a 6% lower offer ($56k) is reasonable based on typical stale-listing flexibility.
- 8 sale attempts since 13y ago; this cycle's ask has dropped $5k (8%) from the opening price — seller is motivated, your offer sets the floor, not the list.
- Current owner paid $5k; list at $60k implies a 1098% gain — meaningful room to come down on a strong offer.
Risks & watch-outs
- Watch-outs: property tax is 4.0% of price; built in 1950 — expect roof / HVAC / electrical / plumbing capex.
Questions for the listing agent
- It's been on market 80 days. Have you received any prior offers? Is the seller open to a 6% concession, seller financing, or rate buy-down credit?
- Built in 1950 — when were the roof, HVAC, electrical panel, plumbing, and water heater last replaced?
- Property tax is high relative to price — has the assessment been appealed recently, and will the sale trigger a re-assessment?
- Why hasn't it sold? Are there any deal-killer items the seller is aware of (foundation, flood, title, zoning, code violations)?
- Is there a deadline driving the sale (1031 exchange, divorce, estate, relocation)? That informs how much negotiation room exists.
- Schools are F-rated, which usually means shorter tenancies and higher turnover. Who's the typical renter profile here, and what's been the actual vacancy rate?
- Crime grade is F in this area — have there been break-ins, vandalism, or insurance claims at this property in the last 3 years? What carrier currently insures it and at what premium?
- What's the average days-on-market for RENTAL listings here right now (not sales)? A rising rental-DOM trend means longer vacancies and softer asking-rent achievability than the comps imply.
- What's the recent tenant-quality profile in this submarket — average credit score on applications, eviction rate, late-payment / NSF rate, and stable-employment percentage? A property-management company in the area should have these aggregated.
- How much new for-sale + rental construction is in the pipeline within 1–3 miles? Heavy new supply typically softens prices + rents 12–24 months out; constrained supply supports both.
Investment metrics
- 1% rule
- 1.82% ✓
- Cap rate
- 12.74%
- Cash-on-cash
- 23.01%
- DSCR
- 2.02
- GRM
- 4.6
CMA / ARV
- ARV (median comp)
- $61,016
- List price
- $59,900
- Delta
- -1.83%
- Verdict
- FAIR
- Comps
- 20 within 1.0 mi
Show comp detail 12 sales within ~0.75 mi
| Address | Dist | Beds/Ba | Sqft | Sold | Price | $/sf | Match |
|---|---|---|---|---|---|---|---|
| 5298 Neff Ave | 0.08mi | 2/1.0 | 720 (0%) | 2mo | $46,000 | $64 | 95 |
| 5251 Neff Ave | 0.11mi | 2/1.0 | 720 (0%) | 2mo | $46,000 | $64 | 93 |
| 5290 University Pl | 0.19mi | 2/1.0 | 721 (+0%) | 5mo | $60,000 | $83 | 86 |
| 6183 Woodhall St | 0.41mi | 3/1.0 (+1) | 720 (0%) | 1mo | $32,000 | $44 | 75 |
| 4607 Radnor St | 0.57mi | 2/1.0 | 731 (+2%) | 2mo | $50,000 | $68 | 69 |
| 5243 Neff Ave | 0.12mi | 2/1.0 | 816 (+13%) | 6mo | $85,000 | $104 | 67 |
| 5558 Radnor St | 0.40mi | 2/1.0 | 660 (-8%) | 6mo | $18,000 | $27 | 63 |
| 5955 Guilford St | 0.28mi | 3/1.0 (+1) | 802 (+11%) | 6mo | $43,000 | $54 | 58 |
| 5203 Marseilles St | 0.27mi | 3/1.0 (+1) | 816 (+13%) | 7mo | $77,500 | $95 | 54 |
| 4481 Radnor St | 0.68mi | 2/1.0 | 792 (+10%) | 5mo | $32,000 | $40 | 47 |
| 5007 Ashley St | 0.72mi | 2/1.0 | 817 (+14%) | 2mo | $30,000 | $37 | 42 |
| 4138 University Pl | 0.74mi | 3/1.0 (+1) | 780 (+8%) | 7mo | $77,500 | $99 | 41 |
Match score weights: distance 35% · size 25% · config 20% · recency 20%. Top-matched comps best support the ARV.
Projected returns pro-forma
-3.0% appreciation · 0.73% rent growth · sell at horizon
- IRR
- 13.0%
- Equity multiple
- 1.50×
- Total profit
- $8,435
- Equity at exit
- $8,931
- IRR
- 19.8%
- Equity multiple
- 2.46×
- Total profit
- $24,551
- Equity at exit
- $5,179
Cash invested: $16,772 (down + closing). Projections, not guarantees.
Landlord ↔ Tenant lean methodology
- Overall (STATE)
- 62 Landlord-Friendly
- State Michigan
- 62 Landlord-Friendly · EVEN
- County
- — inherits STATE
- City
- — inherits STATE
ZIP-level market 48224
- Rents YoY
- 0.7%
- Active inventory
- 484
- Price-to-rent
- 4.6×
Monthly cashflow live
- Estimated rent
- $1,091 high interval (Pro) →
- Mortgage (P&I)
- −$314
- Tax from tax record
- −$201 /mo · $2,411/yr
- Insurance
- −$25
- HOA
- −$0
- Vacancy / Maint / Mgmt
- −$229
- Net cashflow
- $322
Break-even live
UW: 25.0% down · 7.5% · 30yr · 1.5% tax · 5.0% vac · 8.0% maint · 8.0% mgmt
Financing live
Cash to close
- Down payment
- $14,975
- Closing costs
- $1,797
- Reserves months
- —
- Total cash needed
- —
Loan-product check · same deal, 3 products live
Conventional
25% down · 7.5% · 30yr
- Down + closing
- —
- Monthly P&I
- —
- Monthly cashflow
- —
- DSCR
- —
- Eligible?
- —
Personal DTI + credit; lowest rate.
DSCR
20% down · 8.5% · 30yr
- Down + closing
- —
- Monthly P&I
- —
- Monthly cashflow
- —
- DSCR
- —
- Eligible?
- —
No personal income docs; deal must DSCR.
Hard money
10% down · 12.0% · 12mo
- Down + closing
- —
- Monthly P&I
- —
- Monthly cashflow
- —
- DSCR
- —
- Eligible?
- —
Short-term bridge; refi at stabilization.
Rent comps 14 comps
| Address | Beds | Baths | Sqft | Rent | $/sqft | DOM | Units | Dist |
|---|---|---|---|---|---|---|---|---|
| 16927 Chandler Park Dr Unit 3_ Detroit, MI | 1.0 | 1.0 | 600 | $900 | $1.50 | 15d | 1 | 0.37mi |
| 4865 Cadieux Rd Unit 11 Detroit, MI | 2.0 | 1.0 | 630 | $1,200 | $1.90 | 43d | 1 | 0.48mi |
| 4837 Cadieux Rd Unit 9 Detroit, MI | 2.0 | 1.0 | 650 | $1,200 | $1.85 | 43d | 1 | 0.50mi |
| 4811 Cadieux Rd Unit 2 Detroit, MI | 1.0 | 1.0 | 600 | $950 | $1.58 | 43d | 1 | 0.51mi |
| 4811 Cadieux Rd Unit 11 Detroit, MI | 2.0 | 1.0 | 663 | $1,200 | $1.81 | 22d | 1 | 0.51mi |
| 4811 Cadieux Rd Unit 10 Detroit, MI | 2.0 | 1.0 | 663 | $1,200 | $1.81 | 43d | 1 | 0.51mi |
| 9140 Whittier Ave Unit 1 Detroit, MI | 1.0 | 1.0 | 550 | $700 | $1.27 | 43d | 1 | 0.82mi |
| 21301 Kingsville St Apt 108 Harper Woods, MI | 1.0 | 1.0 | 700 | $900 | $1.29 | 3d | 1 | 0.90mi |
| 5284 Devonshire Rd Unit 2 Detroit, MI | 1.0 | 1.0 | 750 | $1,050 | $1.40 | 15d | 1 | 0.94mi |
| 5284 Devonshire Rd Detroit, MI | 2.0 | 1.0 | 650 | $1,050 | $1.62 | 24d | 1 | 0.94mi |
| 17161 Denver St Apt 10 Detroit, MI | 1.0 | 1.0 | 700 | $800 | $1.14 | 11d | 1 | 1.06mi |
| 17161 Denver St Detroit, MI | 1.0 | 1.0 | 700 | $800 | $1.14 | 12d | 1 | 1.06mi |
| 11529 Roxbury St Detroit, MI | 2.0 | 1.0 | 720 | $1,200 | $1.67 | 12d | 1 | 1.33mi |
| 11611 Morang Ave Detroit, MI | 1.0–2.0 | 1.0 | 709 | $1,040 | $1.47 | 43d | 1 | 1.39mi |
Listing history 28 events
-
2026-06-04days on market $59,900 Active 80 DOM
-
2026-06-03days on market $59,900 Active 79 DOM
-
2026-06-01days on market $59,900 Active 77 DOM
-
2026-05-31days on market $59,900 Active 76 DOM
-
2026-04-03price $59,900 1067-char remark
Show marketing remark (1047 chars)
Turnkey cash-flowing investment opportunity on Detroit’s east side! Welcome to 5555 Neff Ave, Detroit, MI 48224, a solid rental property currently tenant-occupied and generating $1,100 per month in rental income. This property offers investors immediate cash flow from day one with a reliable tenant already in place. The home features a functional layout, spacious living areas, and strong long-term rental demand in a well-established neighborhood near East English Village and the Grosse Pointe border. Located close to schools, parks, shopping, and major commuter routes, this property sits in a high-demand rental corridor, making it a great addition to any buy-and-hold portfolio or investor looking to expand their Detroit rental holdings. Detroit continues to attract investors seeking affordable entry points and strong rental yields, and this property delivers both stability and income potential. Tenant occupied – please do not disturb tenant. For more information, contact: Samar Taha – 313-888-7653 (text preferred)
-
2026-04-03price $59,900 1047-char remark
Show marketing remark (1047 chars)
Turnkey cash-flowing investment opportunity on Detroit’s east side! Welcome to 5555 Neff Ave, Detroit, MI 48224, a solid rental property currently tenant-occupied and generating $1,100 per month in rental income. This property offers investors immediate cash flow from day one with a reliable tenant already in place. The home features a functional layout, spacious living areas, and strong long-term rental demand in a well-established neighborhood near East English Village and the Grosse Pointe border. Located close to schools, parks, shopping, and major commuter routes, this property sits in a high-demand rental corridor, making it a great addition to any buy-and-hold portfolio or investor looking to expand their Detroit rental holdings. Detroit continues to attract investors seeking affordable entry points and strong rental yields, and this property delivers both stability and income potential. Tenant occupied – please do not disturb tenant. For more information, contact: Samar Taha – 313-888-7653 (text preferred)
-
2026-03-16$64,900 Active 1047-char remark
Show marketing remark (1067 chars)
Turnkey cash-flowing investment opportunity on Detroit's east side! Welcome to 5555 Neff Ave, Detroit, MI 48224, a solid rental property currently tenant-occupied and generating $1,100 per month in rental income. This property offers investors immediate cash flow from day one with a reliable tenant already in place. The home features a functional layout, spacious living areas, and strong long-term rental demand in a well-established neighborhood near East English Village and the Grosse Pointe border. Located close to schools, parks, shopping, and major commuter routes, this property sits in a high-demand rental corridor, making it a great addition to any buy-and-hold portfolio or investor looking to expand their Detroit rental holdings. Detroit continues to attract investors seeking affordable entry points and strong rental yields, and this property delivers both stability and income potential. Tenant occupied – please do not disturb tenant. For more information, contact: Samar Taha – 313-888-7653 (text preferred)
-
2026-03-16$64,900 Active 1067-char remark
Show marketing remark (1067 chars)
Turnkey cash-flowing investment opportunity on Detroit's east side! Welcome to 5555 Neff Ave, Detroit, MI 48224, a solid rental property currently tenant-occupied and generating $1,100 per month in rental income. This property offers investors immediate cash flow from day one with a reliable tenant already in place. The home features a functional layout, spacious living areas, and strong long-term rental demand in a well-established neighborhood near East English Village and the Grosse Pointe border. Located close to schools, parks, shopping, and major commuter routes, this property sits in a high-demand rental corridor, making it a great addition to any buy-and-hold portfolio or investor looking to expand their Detroit rental holdings. Detroit continues to attract investors seeking affordable entry points and strong rental yields, and this property delivers both stability and income potential. Tenant occupied – please do not disturb tenant. For more information, contact: Samar Taha – 313-888-7653 (text preferred)
-
2023-03-21historical
-
2023-03-21historical
-
2023-03-10$55,000 Active
-
2023-03-10$55,000 Active
-
2016-04-26soldstatus $5,000 Sold
-
2016-04-26soldstatus $5,000 Closed
-
2016-03-29status Pending
-
2016-03-23historical
-
2016-02-04price $6,000
-
2015-11-30price $9,000
-
2015-09-18price $10,000
-
2015-07-30price $11,000
-
2015-06-17$15,000 Active
-
2015-06-17$6,000
-
2014-03-11soldstatus $10,500
-
2014-03-11soldstatus $10,500
-
2014-02-19historical
-
2013-09-27$13,900
-
2013-09-27$13,900
-
1998-08-18soldstatus $15,400
ⓘ Source: listings_history table (triggers on properties + properties_extension) + one-shot
backfill from property_details.listing_events for pre-trigger history.
Tax reassessment forecast MI · Partial reset (capped growth)
- Current annual tax
- $2,411 · $201/mo
- Projected year-2 tax
- $2,411 · $201/mo
- Expected delta
- $0/yr ($0/mo · 0.0%)
ⓘ Screening estimate from a state-policy table — verify with the county assessor before closing.
Climate risk First Street
- Flood 1/10 Low FEMA zone X (unshaded) · 0% chance over 30 yrs
- Wildfire 1/10 Low
- Heat 3/10 Moderate 7 d/yr ≥96°F today · 15 d/yr by 30 yrs out
- Wind 2/10 Low
- Air quality 3/10 Moderate 3 unhealthy d/yr today · 4 by 30 yrs out
Nearby sold comps map
Loading sold comps map…
Walkable amenities ~0.75 mi
Loading nearby amenities…
Taxation est. · year 1
- Rental income
- $13,088
- − Mortgage interest
- −$3,355
- − Property taxes
- −$2,411
- − Insurance
- −$300
- − Repairs & maintenance
- −$1,047
- − Management
- −$1,047
- − Depreciation
- −$1,743
- Taxable income
- $3,185
- Est. tax owed @ 24.0%
- −$764
- After-tax cash flow
- $3,095/yr
For passive investors: Depreciation is non-cash, so a rental often shows a tax loss while cash-flowing — sheltering income. Rental losses are passive: they offset passive income freely, and up to $25,000/yr can offset ordinary (W-2) income if you actively participate and your MAGI is under $100k (phasing out to $0 by $150k); unused losses carry forward. On sale, claimed depreciation is recaptured at up to 25%, and gains may owe capital-gains tax (a 1031 exchange can defer both). Figures are a year-1 estimate at your 24.0% rate — not tax advice; consult a CPA.
Schools (NCES district)
- District
- Detroit Public Schools Community District
- NCES district ID
- 2601103
- Math proficiency
- 10% ▼ -2.00%
- Reading proficiency
- 24% ▲ 6.00%
- Median HH income
- $25,815
- Composite
- 13.06/100
- National rank
- #9564
- State rank
- #499 of 540 in MI
Livability — Detroit
- Score
- 73/100
- State rank
- #218
- US rank
- #5427
Category grades
Schools grade is shown separately in the Schools card above.
Census & demographics
- Census place
- Detroit, MI
- County
- Wayne County · 1,562,939 people
- City population
- 572,865
- Metro
- Detroit-Warren-Dearborn, MI
- Population (ZIP)
- 39,668
- Household income
- $44,856
- Rent vs Own
- Severe rent burden
- 2515.0
Population outlook (Wayne County) Hauer SSP2
- Today (2025)
- 1,675,273 people
- By 2030
- 1,620,300 · -3.3%
- By 2040
- 1,502,341 · -10.3%
- By 2050
- 1,384,039 · -17.4%
- By 2075
- 1,124,592 · -32.9%
- By 2100
- 881,193 · -47.4%
Race, ethnicity, and origin ACS 2023
- Neighborhood character
- Predominantly Black (88%)
- Race & ethnicity
- Black 88% White 8% Two or more races 3% Hispanic / Latino 1%
- Common ancestry
- Iranian 1% Romanian 1% Lithuanian 1%
- Foreign-born
- 1%
- Languages at home
- 97% English-only · Spanish 2%
Political lean MEDSL · Wayne
- 2024 margin
- Strong D (+29.0) · D 62.7% · R 33.7% · Other 3.6%
- 2008→2024 swing
- -20.5pp toward R · 2008: 49.5pp · 2024: 29.0pp
- All cycles
- 2024: D+29.0 2020: D+38.1 2016: D+37.3 2012: D+46.9 2008: D+49.5
Not yet ingested
- Civics
- —
Market trends
- HPI YoY
- ▼ -226.38%
- Current HPI
- 161.886
- Rent YoY
- ▲ 0.73%
- Metro
- Detroit-Warren-Dearborn, MI
- State GDP YoY
- ▲ 1.37%
- F500 in state
- 28
Industry mix (Fortune 500 HQ in MI)
| Industry | F500 HQs | Revenue |
|---|---|---|
| Automotive Parts | 3 | $48B |
|
||
| Automotive | 2 | $372B |
|
||
| Chemicals | 1 | $45B |
|
||
| Automotive Retail | 1 | $29B |
|
||
| Healthcare / Medical Devices | 1 | $23B |
|
||
| Automotive Technology | 1 | $20B |
|
||
Price history
+289.0% since first listed24 events — show timeline
- 2026-04-03 Price Changed $59,900 MiRealSource-MiMLS
- 2026-04-03 Price Changed $59,900 REALCOMP
- 2026-03-16 Listed $64,900 REALCOMP
- 2026-03-16 Listed $64,900 MiRealSource-MiMLS
- 2023-03-21 Listing Removed — MiRealSource-MiMLS
- 2023-03-21 Listing Removed — REALCOMP
- 2023-03-10 Listed $55,000 MiRealSource-MiMLS
- 2023-03-10 Listed $55,000 REALCOMP
- 2016-04-26 Sold (MLS) $5,000 MiRealSource-MiMLS
- 2016-04-26 Sold (MLS) $5,000 REALCOMP
- 2016-03-29 Pending — REALCOMP
- 2016-03-23 Listing Removed — MiRealSource-MiMLS
- 2016-02-04 Price Changed $6,000 REALCOMP
- 2015-11-30 Price Changed $9,000 REALCOMP
- 2015-09-18 Price Changed $10,000 REALCOMP
- 2015-07-30 Price Changed $11,000 REALCOMP
- 2015-06-17 Listed $15,000 REALCOMP
- 2015-06-17 Listed $6,000 MiRealSource-MiMLS
- 2014-03-11 Sold (MLS) $10,500 MiRealSource-MiMLS
- 2014-03-11 Sold (MLS) $10,500 REALCOMP
- 2014-02-19 Listing Removed — MiRealSource-MiMLS
- 2013-09-27 Listed $13,900 MiRealSource-MiMLS
- 2013-09-27 Listed $13,900 REALCOMP
- 1998-08-18 Sold (Public Records) $15,400 Public Records
Property tax history
+6.3%/yrLatest (2025): $2,411 · +129.9% YoY. Source: county tax records.
Cash-flow waterfall
monthlySold comps — $/sqft
last 12 mo · ≤1 miLoading sold comps…