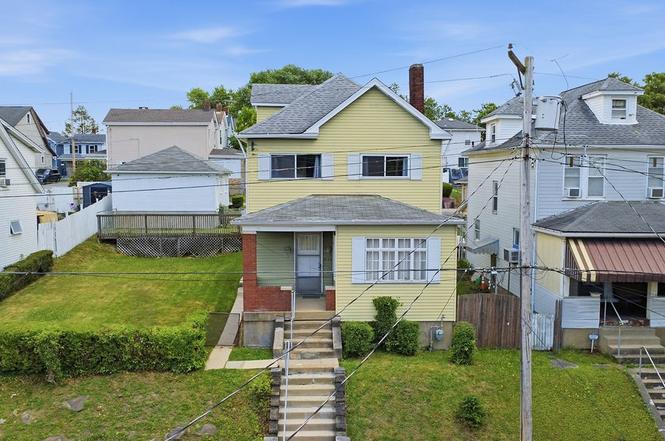
2705 Cleveland St · McKeesport, PA
Flood risk 1/10 · Minimal
- FEMA flood zone
- X (unshaded)
- Chance of flooding over 30 yrs
- 0.0%
- Est. flood insurance / yr
- $473 – $860
Fire risk 1/10 · Minimal
- Est. fire insurance / yr
- $511 – $949
Heat risk 3/10 · Minor
- Hot days now (above 97°F)
- 7 days/yr
- Hot days in 30 yrs
- 18 days/yr
Wind risk 2/10 · Minimal
- Chance of severe wind over 30 yrs
- —
Air-quality risk 5/10 · Moderate
- Unhealthy air days now
- 9 days/yr
- Unhealthy air days in 30 yrs
- 11 days/yr
Risk factors via First Street. Map © Google.
Why this score? — see what drove the B- grade
The composite is a weighted blend of 9 inputs, each scored 0–100. Each bar is that input's sub-score; the figure is the points it added to the 100-point composite (weight × sub-score).
- Cash flow +30.0/30.0
- 1% rule +10.0/10.0
- DSCR +10.0/10.0
- ARV discount +7.5/15.0
- Livability +3.3/5.0
- Rent growth +2.5/5.0
- Condition / age +2.5/5.0
- Schools +1.6/10.0
- Appreciation +0.0/10.0
$80,000
🖨 Deal sheet (PDF) 📄 Offer letter ✓ Due diligence
Listing remarks
Welcome home to this spacious and meticulously maintained classic two-story in the Grandview area of McKeesport. Offering nearly 2000 square feet of living space, this charming residence features large living and dining areas, front room that could be a reading nook or office, and a summer room with tons of windows and a sliding door to the backyard for those fun family gatherings. The second floor has three generous sized bedrooms, a full bath with double-vanity and access to the expansive walk up attic that can be converted to just about anything one can dream up. The lower level houses the laundry area, including the washer/dryer, and a full bath with walk in shower. Situated on a fantas
Key facts
- Grandview area
- Double lot
- Summer room
Tags
Property features AI
Exterior
- Parking: Detached garage with garage door opener; Total 2 parking spaces
- Utilities: Public water; Public sewer
- Home design: Two-story home; Resale property; Asphalt roof; Aluminum siding
- Construction: Aluminum siding construction; Asphalt roof
- Exterior features: Small lot (approx. 0.13 acre)
Interior
- Kitchen: Stove; Refrigerator; Dishwasher; Some gas appliances
- Bedrooms: Bedroom 2 on upper level (15x10); Bedroom 3 on upper level (9x9); Additional upper-level room (14x12)
- Flooring: Vinyl; Carpet
- Bathrooms: 2 full bathrooms
- Heating & cooling: Gas forced-air heating; Wall/window cooling units
- Interior features: Window treatments; Unfinished interior-entry basement
- Laundry & utility: Washer; Dryer; Laundry room on lower level
Neighborhood map
What this means for you Summary
Snapshot
- This is a 3-bed/1.0-bath single-family listed at $80k.
Deal economics
- At list price, monthly cash flow is $474 ($6k/yr) — positive.
- The deal already cash-flows at list — no discount required.
- Meets the 1% rule at list price ($1k rent vs $80k).
- Cap rate 13.4% vs local median 10.2% in McKeesport — top-decile yield for the area; either an underpriced asset or a hidden risk that comps aren't pricing in. Stress-test before assuming the spread holds.
Location & tenants
- Location reads 66/100 on livability (#1,089 in PA) — a middle-class / working-renter tenant base. Strengths: commute A+, cost of living A+, housing A+; Watch: health & safety D, crime F, amenities F.
- Mckeesport Area SD (suburban): math 11% / reading 28% proficiency, ranked #499 of 539 in PA (top 93%) — low school quality limits family demand, transient renter base, plan for 1-2y turnover; 66% free/reduced lunch — lower-income household profile, screen leases tightly.
- Zoned schools: Founders Hall Middle Sch (math 2% / reading 26%, grade F, #480 of 512 statewide, top 94%, 695 students, 100% FRL); Mckeesport Area Shs (math 22% / reading 30%, grade F, #372 of 437 statewide, top 86%, 1,045 students, 78% FRL) — zoned schools average 89% FRL vs 66% district-wide (23 pts higher); higher-poverty schools than district average — tighter screening recommended.
- Market conditions: 114 active listings in the ZIP; 12 comparable units currently listed for rent nearby; rentals at typical pace (median 26d on market — plan ~3-4 weeks tenant-placement turnaround); lower-income renter base — watch delinquency; 2,996 units permitted in Allegheny County in 2024 (1,588 in 5+ unit buildings).
- At $1,335/mo this rent would consume 45% of the median local household income ($35k/yr) (locally 1239% of renters already pay >50% of income on rent) — very limited rent-growth headroom before tenants either downsize or default.
Forward outlook
- Local home prices are declining (-3.0%/yr); year-one equity from $553 of loan paydown is wiped out by about $2k of value loss. Plan a longer hold.
- At projected returns (-3.0% appreciation + 3.0% rent growth), your $22k cash investment doubles in ~5 years — after that, you're playing with house money.
Negotiation context
- Only 3 days on market — expect competitive offers; lowballing is unlikely to land.
Risks & watch-outs
- Watch-outs: built in 1925 — expect roof / HVAC / electrical / plumbing capex.
Questions for the listing agent
- Built in 1925 — when were the roof, HVAC, electrical panel, plumbing, and water heater last replaced?
- Is there a deadline driving the sale (1031 exchange, divorce, estate, relocation)? That informs how much negotiation room exists.
- Schools are D-rated, which usually means shorter tenancies and higher turnover. Who's the typical renter profile here, and what's been the actual vacancy rate?
- Crime grade is F in this area — have there been break-ins, vandalism, or insurance claims at this property in the last 3 years? What carrier currently insures it and at what premium?
- What's the average days-on-market for RENTAL listings here right now (not sales)? A rising rental-DOM trend means longer vacancies and softer asking-rent achievability than the comps imply.
- What's the recent tenant-quality profile in this submarket — average credit score on applications, eviction rate, late-payment / NSF rate, and stable-employment percentage? A property-management company in the area should have these aggregated.
- How much new for-sale + rental construction is in the pipeline within 1–3 miles? Heavy new supply typically softens prices + rents 12–24 months out; constrained supply supports both.
Investment metrics
- 1% rule
- 1.67% ✓
- Cap rate
- 13.41%
- Cash-on-cash
- 25.40%
- DSCR
- 2.13
- GRM
- 5.0
CMA / ARV
- ARV (on-the-fly)
- $168,646
- Comps found
- 9
Show comp detail 9 sales within ~0.75 mi
| Address | Dist | Beds/Ba | Sqft | Sold | Price | $/sf | Match |
|---|---|---|---|---|---|---|---|
| 2703 Grandview Ave | 0.11mi | 3/1.5 | 2,040 (+4%) | 15mo | $24,000 | $12 | 74 |
| 2810 Jenny Lind St | 0.67mi | 3/1.0 | 1,852 (-6%) | 6mo | $19,900 | $11 | 55 |
| 405 Diehl Dr | 0.49mi | 3/1.5 | 1,725 (-12%) | 4mo | $151,000 | $88 | 52 |
| 310 30th St | 0.61mi | 4/1.0 (+1) | 1,980 (+1%) | 22mo | $68,500 | $35 | 47 |
| 2000 Eaton St | 0.67mi | 3/1.5 | 2,039 (+4%) | 20mo | $175,000 | $86 | 44 |
| 2320 Milburn St Unit 1 | 0.35mi | 3/2.0 | 1,667 (-15%) | 18mo | $260,000 | $156 | 40 |
| 2713 Jenny Lind St | 0.72mi | 3/1.5 | 2,064 (+5%) | 22mo | $45,000 | $22 | 38 |
| 3316 Stewart St | 0.68mi | 3/1.5 | 1,669 (-15%) | 14mo | $143,000 | $86 | 30 |
| 2815 Morlock St | 0.61mi | 3/1.5 | 1,675 (-15%) | 23mo | $149,900 | $89 | 26 |
Match score weights: distance 35% · size 25% · config 20% · recency 20%. Top-matched comps best support the ARV.
Projected returns pro-forma
-3.0% appreciation · 3.0% rent growth · sell at horizon
- IRR
- 19.0%
- Equity multiple
- 1.77×
- Total profit
- $17,273
- Equity at exit
- $11,928
- IRR
- 27.3%
- Equity multiple
- 3.41×
- Total profit
- $54,079
- Equity at exit
- $6,917
Cash invested: $22,400 (down + closing). Projections, not guarantees.
Landlord ↔ Tenant lean methodology
- Overall (STATE)
- 62 Landlord-Friendly
- State Pennsylvania
- 62 Landlord-Friendly · EVEN
- County
- — inherits STATE
- City
- — inherits STATE
ZIP-level market 15132
- Home prices YoY
- -32.9%
- Active inventory
- 114
- Price-to-rent
- 5.0×
Monthly cashflow live
- Estimated rent
- $1,335 high interval (Pro) →
- Mortgage (P&I)
- −$420
- Tax from tax record
- −$128 /mo · $1,532/yr
- Insurance
- −$33
- HOA
- −$0
- Vacancy / Maint / Mgmt
- −$280
- Net cashflow
- $474
Break-even live
Sensitivity live
| Price | -10% $519 | -5% $497 | +0% $474 | +5% $452 | +10% $429 |
|---|---|---|---|---|---|
| Rent | -10% $369 | -5% $421 | +0% $474 | +5% $527 | +10% $580 |
| Rate | -1.0pp $514 | -0.5pp $495 | base $474 | +0.5pp $453 | +1.0pp $432 |
UW: 25.0% down · 7.5% · 30yr · 1.5% tax · 5.0% vac · 8.0% maint · 8.0% mgmt
Financing live
Cash to close
- Down payment
- $20,000
- Closing costs
- $2,400
- Reserves months
- —
- Total cash needed
- —
Loan-product check · same deal, 3 products live
Conventional
25% down · 7.5% · 30yr
- Down + closing
- —
- Monthly P&I
- —
- Monthly cashflow
- —
- DSCR
- —
- Eligible?
- —
Personal DTI + credit; lowest rate.
DSCR
20% down · 8.5% · 30yr
- Down + closing
- —
- Monthly P&I
- —
- Monthly cashflow
- —
- DSCR
- —
- Eligible?
- —
No personal income docs; deal must DSCR.
Hard money
10% down · 12.0% · 12mo
- Down + closing
- —
- Monthly P&I
- —
- Monthly cashflow
- —
- DSCR
- —
- Eligible?
- —
Short-term bridge; refi at stabilization.
Rent comps 12 comps
| Address | Beds | Baths | Sqft | Rent | $/sqft | DOM | Units | Dist |
|---|---|---|---|---|---|---|---|---|
| 2311 Grandview Ave McKeesport, PA | 4.0 | 2.0 | 2550 | $1,250 | $0.49 | 19d | 1 | 0.22mi |
| 2408 McCarrell St McKeesport, PA | 4.0 | 1.0 | 1430 | $1,195 | $0.84 | 25d | 1 | 0.38mi |
| 3710 Mayfair St McKeesport, PA | 3.0 | 1.5 | 1314 | $1,095 | $0.83 | 4d | 1 | 0.44mi |
| 3211 Walnut St McKeesport, PA | 4.0 | 1.0 | 1434 | $1,500 | $1.05 | 9d | 1 | 0.55mi |
| 2807 Beaver St McKeesport, PA | 4.0 | 2.0 | 1700 | $1,200 | $0.71 | 45d | 1 | 0.75mi |
| 1506 Freemont St McKeesport, PA | 3.0 | 2.0 | 1250 | $1,295 | $1.04 | 25d | 1 | 0.78mi |
| 2618 Poinsettia Dr White Oak, PA | 4.0 | 1.0 | 1225 | $1,599 | $1.31 | 25d | 1 | 0.85mi |
| 1217 Scott St McKeesport, PA | 3.0 | 1.0 | 1500 | $1,165 | $0.78 | 45d | 1 | 1.04mi |
| 2710 Henderson Rd White Oak, PA | 3.0 | 1.5 | 1676 | $1,675 | $1.00 | 3d | 1 | 1.16mi |
| 1451 Jenny Lind St McKeesport, PA | 3.0 | 1.5 | 1408 | $1,150 | $0.82 | 25d | 1 | 1.40mi |
| 1507 Carnegie Ave McKeesport, PA | 3.0 | 1.5 | 1600 | $1,699 | $1.06 | 16d | 1 | 1.46mi |
| 2212 Cronemeyer St McKeesport, PA | 3.0 | 1.0 | 1720 | $1,375 | $0.80 | 45d | 1 | 1.48mi |
Listing history 3 events
-
2026-06-21days on market $80,000 Active 3 DOM
-
2026-06-19remarks 699-char remark
-
2026-06-19$80,000 Active 1 DOM
ⓘ Source: listings_history table (triggers on properties + properties_extension) + one-shot
backfill from property_details.listing_events for pre-trigger history.
Tax reassessment forecast PA · Partial reset (capped growth)
- Current annual tax
- $1,532 · $128/mo
- Projected year-2 tax
- $1,532 · $128/mo
- Expected delta
- $0/yr ($0/mo · 0.0%)
ⓘ Screening estimate from a state-policy table — verify with the county assessor before closing.
Climate risk First Street
- Flood 1/10 Low FEMA zone X (unshaded) · 0% chance over 30 yrs
- Wildfire 1/10 Low
- Heat 3/10 Moderate 7 d/yr ≥97°F today · 18 d/yr by 30 yrs out
- Wind 2/10 Low
- Air quality 5/10 Major 9 unhealthy d/yr today · 11 by 30 yrs out
Nearby sold comps map
Loading sold comps map…
Walkable amenities ~0.75 mi
Loading nearby amenities…
Taxation est. · year 1
- Rental income
- $16,021
- − Mortgage interest
- −$4,481
- − Property taxes
- −$1,532
- − Insurance
- −$400
- − Repairs & maintenance
- −$1,282
- − Management
- −$1,282
- − Depreciation
- −$2,327
- Taxable income
- $4,717
- Est. tax owed @ 24.0%
- −$1,132
- After-tax cash flow
- $4,558/yr
For passive investors: Depreciation is non-cash, so a rental often shows a tax loss while cash-flowing — sheltering income. Rental losses are passive: they offset passive income freely, and up to $25,000/yr can offset ordinary (W-2) income if you actively participate and your MAGI is under $100k (phasing out to $0 by $150k); unused losses carry forward. On sale, claimed depreciation is recaptured at up to 25%, and gains may owe capital-gains tax (a 1031 exchange can defer both). Figures are a year-1 estimate at your 24.0% rate — not tax advice; consult a CPA.
Schools (NCES district)
- District
- Mckeesport Area SD
- NCES district ID
- 4214940
- Math proficiency
- 11% ▼ -9.00%
- Reading proficiency
- 28% ▼ -10.00%
- Median HH income
- $33,779
- Composite
- 15.88/100
- National rank
- #9257
- State rank
- #499 of 539 in PA
Livability — McKeesport
- Score
- 66/100
- State rank
- #1089
- US rank
- #12321
Category grades
Schools grade is shown separately in the Schools card above.
Census & demographics
- Census place
- McKeesport, PA
- County
- Allegheny County · 1,022,028 people
- City population
- 25,010
- Metro
- Pittsburgh, PA
- Population (ZIP)
- 18,898
- Household income
- $35,397
- Rent vs Own
- Severe rent burden
- 1239.0
Population outlook (Allegheny County) Hauer SSP2
- Today (2025)
- 1,250,282 people
- By 2030
- 1,256,482 · +0.5%
- By 2040
- 1,256,318 · +0.5%
- By 2050
- 1,244,169 · -0.5%
- By 2075
- 1,197,693 · -4.2%
- By 2100
- 1,093,187 · -12.6%
Race, ethnicity, and origin ACS 2023
- Neighborhood character
- Diverse neighborhood (Simpson 0.62)
- Race & ethnicity
- White 50% Black 35% Two or more races 10% Hispanic / Latino 4% Asian 1%
- Common ancestry
- Romanian 5% Serbian 2% Scotch-Irish 2%
- Foreign-born
- 2% · Canada, China
- Languages at home
- 96% English-only · Spanish 3%
Political lean MEDSL · Allegheny
- 2024 margin
- Strong D (+20.3) · D 59.7% · R 39.4%
- 2008→2024 swing
- +4.8pp toward D · 2008: 15.5pp · 2024: 20.3pp
- All cycles
- 2024: D+20.3 2020: D+20.4 2016: D+16.4 2012: D+14.4 2008: D+15.5
Not yet ingested
- Civics
- —
Market trends
- HPI YoY
- ▼ -71.01%
- Current HPI
- 145.195
- Rent YoY
- —
- Metro
- Pittsburgh, PA
- State GDP YoY
- ▲ 1.68%
- F500 in state
- 34
Industry mix (Fortune 500 HQ in PA)
| Industry | F500 HQs | Revenue |
|---|---|---|
| Healthcare | 2 | $309B |
|
||
| Insurance | 2 | $27B |
|
||
| Telecommunications / Media | 1 | $124B |
|
||
| Industrial Distribution | 1 | $22B |
|
||
| Financial Services | 1 | $20B |
|
||
| Chemicals / Materials | 1 | $18B |
|
||
Price history
1 event — show timeline
- 2026-06-18 Listed $80,000 West Penn MLS
Property tax history
+5.0%/yrLatest (2026): $1,532 · +0.0% YoY. Source: county tax records.
Cash-flow waterfall
monthlySold comps — $/sqft
last 12 mo · ≤1 miLoading sold comps…