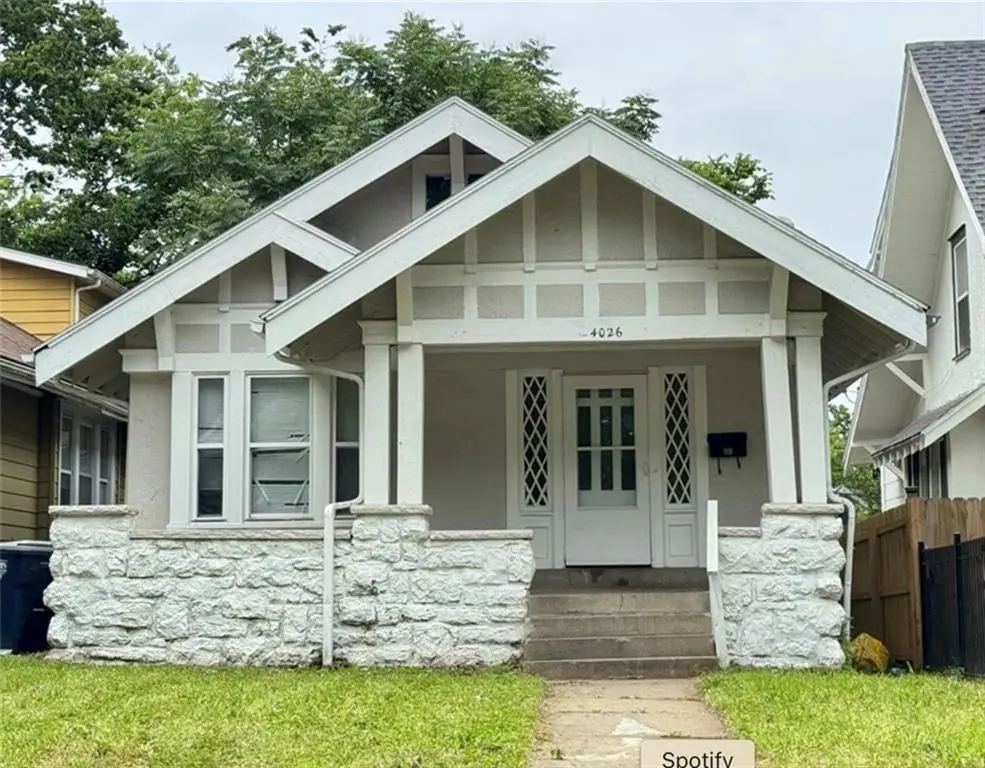
4026 Agnes Ave · Kansas City, MO
Flood risk 1/10 · Minimal
- FEMA flood zone
- X (unshaded)
- Chance of flooding over 30 yrs
- 0.0%
- Est. flood insurance / yr
- $473 – $860
Fire risk 1/10 · Minimal
- Est. fire insurance / yr
- $1,054 – $1,958
Heat risk 4/10 · Minor
- Hot days now (above 107°F)
- 7 days/yr
- Hot days in 30 yrs
- 17 days/yr
Wind risk 2/10 · Minimal
- Chance of severe wind over 30 yrs
- —
Air-quality risk 3/10 · Minor
- Unhealthy air days now
- 2 days/yr
- Unhealthy air days in 30 yrs
- 3 days/yr
Risk factors via First Street. Map © Google.
Why this score? — see what drove the C+ grade
The composite is a weighted blend of 9 inputs, each scored 0–100. Each bar is that input's sub-score; the figure is the points it added to the 100-point composite (weight × sub-score).
- Cash flow +28.8/30.0
- DSCR +10.0/10.0
- 1% rule +6.8/10.0
- ARV discount +6.2/15.0
- Livability +3.9/5.0
- Rent growth +3.6/5.0
- Condition / age +2.5/5.0
- Schools +1.5/10.0
- Appreciation +0.0/10.0
$105,000
🖨 Deal sheet 📄 Offer letter ✓ Due diligence
Listing remarks MLS
Portfoio of Four Single Family homes for sale! Do not disturb tenants. Package of 4 single family homes for sale. Turn key with high cash flow! At roughly a 10% cap rate this package offers strong performance in Kansas City's sought ofter rental market. 4026 Agnes Ave. 2463 Denver Ave. 5107 40th St. 3044 E 60th St.
Key facts
- Usable yard space
- Remodeled kitchen
- Updated vanities
Tags
Neighborhood map
What this means for you Summary
Snapshot
- This is a 2-bed/1.0-bath single-family listed at $105k.
Deal economics
- At list price, monthly cash flow is $352 ($4k/yr) — positive.
- The deal already cash-flows at list — no discount required.
- Meets the 1% rule at list price ($1k rent vs $105k).
- Recommended offer: $99k (6.0% below list) — sets the bar for market timing.
- Cap rate 10.3% vs local median 3.9% in Kansas City — top-decile yield for the area; either an underpriced asset or a hidden risk that comps aren't pricing in. Stress-test before assuming the spread holds.
Location & tenants
- Location reads 78/100 on livability (#28 in MO, #2,671 nationally) — a middle-class / working-renter tenant base. Strengths: amenities A+, commute A+, cost of living A+; Watch: schools C-, crime F.
- Kansas City 33 (urban): math 12% / reading 24% proficiency, ranked #308 of 324 in MO (top 95%) — low school quality limits family demand, transient renter base, plan for 1-2y turnover; 75% free/reduced lunch — lower-income household profile, screen leases tightly.
- Market conditions: Rents rising fast (+4.4%/yr); 187 active listings in the ZIP; 40 comparable units currently listed for rent nearby; rentals at typical pace (median 24d on market — plan ~3-4 weeks tenant-placement turnaround); lower-income renter base — watch delinquency; 4,002 units permitted in Jackson County in 2024 (2,271 in 5+ unit buildings).
- This rent runs 35% of the median local income ($42k/yr) — at the standard rent-burdened threshold; future hikes will face affordability resistance.
Forward outlook
- Local home prices are declining (-3.0%/yr); year-one equity from $726 of loan paydown is wiped out by about $3k of value loss. Plan a longer hold.
- Jackson County population projected at +4% by 2050 — modest demand growth; plan on rents tracking national, not racing it.
- At projected returns (-3.0% appreciation + 4.4% rent growth), your $29k cash investment doubles in ~8 years — after that, you're playing with house money.
Negotiation context
- It's been on market 80 days — a 6% lower offer ($99k) is reasonable based on typical stale-listing flexibility.
- 8 sale attempts since 21y ago; this cycle's ask has dropped $314k (75%) from the opening price — seller is motivated, your offer sets the floor, not the list.
Risks & watch-outs
- Watch-outs: built in 1912 — expect roof / HVAC / electrical / plumbing capex.
Questions for the listing agent
- It's been on market 80 days. Have you received any prior offers? Is the seller open to a 6% concession, seller financing, or rate buy-down credit?
- Built in 1912 — when were the roof, HVAC, electrical panel, plumbing, and water heater last replaced?
- Why hasn't it sold? Are there any deal-killer items the seller is aware of (foundation, flood, title, zoning, code violations)?
- Is there a deadline driving the sale (1031 exchange, divorce, estate, relocation)? That informs how much negotiation room exists.
- Crime grade is F in this area — have there been break-ins, vandalism, or insurance claims at this property in the last 3 years? What carrier currently insures it and at what premium?
- What's the average days-on-market for RENTAL listings here right now (not sales)? A rising rental-DOM trend means longer vacancies and softer asking-rent achievability than the comps imply.
- What's the recent tenant-quality profile in this submarket — average credit score on applications, eviction rate, late-payment / NSF rate, and stable-employment percentage? A property-management company in the area should have these aggregated.
- How much new for-sale + rental construction is in the pipeline within 1–3 miles? Heavy new supply typically softens prices + rents 12–24 months out; constrained supply supports both.
Investment metrics
- 1% rule
- 1.18% ✓
- Cap rate
- 10.31%
- Cash-on-cash
- 14.36%
- DSCR
- 1.64
- GRM
- 7.1
CMA / ARV
- ARV (median comp)
- $101,961
- List price
- $105,000
- Delta
- 2.98%
- Verdict
- FAIR
- Comps
- 20 within 1.0 mi
Show comp detail 12 sales within ~0.75 mi
| Address | Dist | Beds/Ba | Sqft | Sold | Price | $/sf | Match |
|---|---|---|---|---|---|---|---|
| 3838 S Benton Ave | 0.22mi | 3/1.0 (+1) | 1,066 (+4%) | 3mo | $90,000 | $84 | 75 |
| 4338 Indiana Ave | 0.49mi | 2/1.0 | 1,012 (-1%) | 0mo | $150,000 | $148 | 75 |
| 3711 Bellefontaine Ave | 0.42mi | 3/1.0 (+1) | 1,007 (-2%) | 4mo | $120,000 | $119 | 69 |
| 3920 S Benton Ave | 0.15mi | 2/1.5 | 1,160 (+14%) | 5mo | $65,000 | $56 | 64 |
| 3936 Wabash Ave | 0.32mi | 3/2.0 (+1) | 1,099 (+8%) | 2mo | $89,900 | $82 | 62 |
| 2303 E 41st St E | 0.41mi | 2/1.0 | 918 (-10%) | 4mo | $80,000 | $87 | 61 |
| 4427 Agnes Ave | 0.50mi | 3/1.0 (+1) | 1,100 (+8%) | 2mo | $69,900 | $64 | 57 |
| 4327 Mersington Ave | 0.70mi | 2/1.0 | 940 (-8%) | 4mo | $50,000 | $53 | 50 |
| 3536 College Ave | 0.63mi | 3/1.0 (+1) | 1,086 (+6%) | 6mo | $96,000 | $88 | 50 |
| 4520 Chestnut Ave | 0.62mi | 3/2.0 (+1) | 1,088 (+6%) | 3mo | $94,900 | $87 | 49 |
| 3942 Myrtle Ave | 0.63mi | 2/1.0 | 890 (-13%) | 3mo | $85,000 | $96 | 47 |
| 3640 Cleveland Ave | 0.68mi | 2/2.0 | 900 (-12%) | 4mo | $105,000 | $117 | 41 |
Match score weights: distance 35% · size 25% · config 20% · recency 20%. Top-matched comps best support the ARV.
Projected returns pro-forma
-3.0% appreciation · 4.42% rent growth · sell at horizon
- IRR
- 6.2%
- Equity multiple
- 1.24×
- Total profit
- $7,142
- Equity at exit
- $15,656
- IRR
- 16.6%
- Equity multiple
- 2.44×
- Total profit
- $42,470
- Equity at exit
- $9,078
Cash invested: $29,400 (down + closing). Projections, not guarantees.
Landlord ↔ Tenant lean methodology
- Overall (STATE)
- 81 Strongly Landlord-Friendly
- State Missouri
- 81 Strongly Landlord-Friendly · R+10
- County
- — inherits STATE
- City
- — inherits STATE
ZIP-level market 64130
- Home prices YoY
- -21.5%
- Rents YoY
- 4.4%
- Active inventory
- 187
- Price-to-rent
- 7.1×
Monthly cashflow live
- Estimated rent
- $1,237 high interval (Pro) →
- Mortgage (P&I)
- −$551
- Tax from tax record
- −$31 /mo · $376/yr
- Insurance
- −$44
- HOA
- −$0
- Vacancy / Maint / Mgmt
- −$260
- Net cashflow
- $352
Break-even live
UW: 25.0% down · 7.5% · 30yr · 1.5% tax · 5.0% vac · 8.0% maint · 8.0% mgmt
Financing live
Cash to close
- Down payment
- $26,250
- Closing costs
- $3,150
- Reserves months
- —
- Total cash needed
- —
Loan-product check · same deal, 3 products live
Conventional
25% down · 7.5% · 30yr
- Down + closing
- —
- Monthly P&I
- —
- Monthly cashflow
- —
- DSCR
- —
- Eligible?
- —
Personal DTI + credit; lowest rate.
DSCR
20% down · 8.5% · 30yr
- Down + closing
- —
- Monthly P&I
- —
- Monthly cashflow
- —
- DSCR
- —
- Eligible?
- —
No personal income docs; deal must DSCR.
Hard money
10% down · 12.0% · 12mo
- Down + closing
- —
- Monthly P&I
- —
- Monthly cashflow
- —
- DSCR
- —
- Eligible?
- —
Short-term bridge; refi at stabilization.
Rent comps 40 comps
| Address | Beds | Baths | Sqft | Rent | $/sqft | DOM | Units | Dist |
|---|---|---|---|---|---|---|---|---|
| 4116 Bellefontaine Ave Kansas City, MO | 3.0 | 1.0 | 1234 | $1,000 | $0.81 | 23d | 1 | 0.07mi |
| 4144 College Ave Kansas City, MO | 3.0 | 1.0 | 1108 | $1,095 | $0.99 | 23d | 1 | 0.21mi |
| 3840 Bellefontaine Ave Kansas City, MO | 3.0 | 1.0 | 1500 | $1,500 | $1.00 | 16d | 1 | 0.24mi |
| 4005 Bales Ave Kansas City, MO | 2.0 | 1.0 | 792 | $1,050 | $1.33 | 43d | 1 | 0.33mi |
| 4309 College Ave Kansas City, MO | 3.0 | 2.0 | 1040 | $1,550 | $1.49 | 16d | 1 | 0.36mi |
| 4107 Olive St Kansas City, MO | 3.0 | 1.5 | 1271 | $1,578 | $1.24 | 7d | 1 | 0.36mi |
| 3818 Indiana Ave Kansas City, MO | 3.0 | 1.5 | 1223 | $1,147 | $0.94 | 43d | 1 | 0.37mi |
| 2305 E 41st St Kansas City, MO | 2.0 | 1.0 | 750 | $1,000 | $1.33 | 7d | 1 | 0.42mi |
| 3841 Olive St Kansas City, MO | 2.0 | 1.0 | 792 | $985 | $1.24 | 14d | 1 | 0.44mi |
| 4014 Park Ave Kansas City, MO | 3.0 | 2.0 | 1271 | $1,273 | $1.00 | 43d | 1 | 0.46mi |
| 4427 Agnes Ave Kansas City, MO | 3.0 | 1.0 | 1100 | $1,350 | $1.23 | 16d | 1 | 0.47mi |
| 3739 Bales Ave Kansas City, MO | 3.0 | 2.0 | 1400 | $1,575 | $1.12 | 23d | 1 | 0.48mi |
| 4216 Cleveland Ave Kansas City, MO | 2.0 | 1.0 | 780 | $1,125 | $1.44 | 16d | 1 | 0.51mi |
| 3630 Agnes Ave Kansas City, MO | 3.0 | 2.0 | 1448 | $1,500 | $1.04 | 10d | 1 | 0.51mi |
| 3710 Wabash Ave Unit 2S Kansas City, MO | 2.0 | 1.0 | 875 | $850 | $0.97 | 23d | 1 | 0.58mi |
| 4028 Myrtle Ave Kansas City, MO | 3.0 | 1.0 | 1100 | $1,490 | $1.35 | 43d | 1 | 0.60mi |
| 4534 S Benton Ave Kansas City, MO | 2.0 | 1.0 | 912 | $1,045 | $1.15 | 16d | 1 | 0.62mi |
| 3524 Bellefontaine Ave Kansas City, MO | 3.0 | 1.0 | 1228 | $1,350 | $1.10 | 43d | 1 | 0.65mi |
| 3346 Agnes Ave Kansas City, MO | 3.0 | 1.0 | 1400 | $1,200 | $0.86 | 7d | 1 | 0.85mi |
| 3330 Agnes Ave Kansas City, MO | 3.0 | 1.0 | 1000 | $1,410 | $1.41 | 43d | 1 | 0.90mi |
| 4209 Flora Ave Kansas City, MO | 2.0 | 1.0 | 778 | $1,200 | $1.54 | 16d | 1 | 0.95mi |
| 3310 College Ave Kansas City, MO | 3.0 | 1.0 | 874 | $995 | $1.14 | 43d | 1 | 0.95mi |
| 4401 Wayne Ave Kansas City, MO | 2.0 | 1.5 | 955 | $1,300 | $1.36 | 23d | 1 | 0.95mi |
| 3304 Agnes Ave Unit Downstairs Kansas City, MO | 3.0 | 1.0 | 1150 | $1,095 | $0.95 | 43d | 1 | 0.95mi |
| 2002 E 35th St Kansas City, MO | 3.0 | 2.0 | 1426 | $1,295 | $0.91 | 7d | 1 | 0.96mi |
| 3736 Cypress Ave Kansas City, MO | 3.0 | 1.0 | 1100 | $1,200 | $1.09 | 7d | 1 | 0.99mi |
| 3305 Askew Ave Kansas City, MO | 3.0 | 1.5 | 1428 | $1,450 | $1.02 | 23d | 1 | 1.03mi |
| 3609 Wayne Ave Kansas City, MO | 3.0 | 1.5 | 1118 | $1,900 | $1.70 | 23d | 1 | 1.03mi |
| 4911 S Benton Ave Kansas City, MO | 2.0 | 1.0 | 1000 | $1,100 | $1.10 | 17d | 1 | 1.06mi |
| 3437 Jackson Ave Kansas City, MO | 2.0 | 1.0 | 700 | $1,150 | $1.64 | 16d | 1 | 1.07mi |
| 4917 S Benton Ave Kansas City, MO | 2.0 | 1.0 | 1000 | $1,100 | $1.10 | 23d | 1 | 1.07mi |
| 3233 Park Ave Unit 1 Kansas City, MO | 2.0 | 1.0 | 950 | $1,075 | $1.13 | 43d | 1 | 1.08mi |
| 3233 Park Ave Unit 2 Kansas City, MO | 2.0 | 1.0 | 950 | $1,000 | $1.05 | 23d | 1 | 1.08mi |
| 4228 Virginia Ave Kansas City, MO | 3.0 | 1.0 | 1200 | $1,250 | $1.04 | 10d | 1 | 1.10mi |
| 4232 Virginia Ave Unit 3 Kansas City, MO | 3.0 | 1.0 | 1296 | $1,100 | $0.85 | 12d | 1 | 1.10mi |
| 3332 Norton Ave Kansas City, MO | 3.0 | 1.0 | 1272 | $1,350 | $1.06 | 43d | 1 | 1.11mi |
| 4935 College Ave Kansas City, MO | 3.0 | 1.0 | 1216 | $1,350 | $1.11 | 23d | 1 | 1.13mi |
| 1500 E 46th St Kansas City, MO | 1.0–3.0 | 1.0 | 803 | $1,050 | $1.31 | 43d | 1 | 1.13mi |
| 4117 Forest Ave Kansas City, MO | 2.0 | 2.0 | 1300 | $1,390 | $1.07 | 23d | 1 | 1.17mi |
| 4119 Forest Ave Kansas City, MO | 2.0 | 1.0 | 950 | $1,400 | $1.47 | 12d | 1 | 1.17mi |
Listing history 34 events
-
2026-06-18days on market $105,000 Active 80 DOM
-
2026-06-17pricedays on market $105,000 Active 79 DOM
-
2026-06-16days on market $112,000 Active 78 DOM
-
2026-06-15days on market $112,000 Active 77 DOM
-
2026-06-13days on market $112,000 Active 75 DOM
-
2026-06-09days on market $112,000 Active 71 DOM
-
2026-06-08days on market $112,000 Active 70 DOM
-
2026-06-07days on market $112,000 Active 69 DOM
-
2026-06-05days on market $112,000 Active 66 DOM
-
2026-06-03days on market $112,000 Active 65 DOM
-
2026-06-02days on market $112,000 Active 64 DOM
-
2026-06-01days on market $112,000 Active 63 DOM
-
2026-05-31days on market $112,000 Active 62 DOM
-
2026-05-14price $399,500 316-char remark
Show marketing remark (316 chars)
Portfoio of Four Single Family homes for sale! Do not disturb tenants. Package of 4 single family homes for sale. Turn key with high cash flow! At roughly a 10% cap rate this package offers strong performance in Kansas City's sought ofter rental market. 4026 Agnes Ave. 2463 Denver Ave. 5107 40th St. 3044 E 60th St.
-
2026-05-09$419,000 Active 316-char remark
Show marketing remark (316 chars)
Portfoio of Four Single Family homes for sale! Do not disturb tenants. Package of 4 single family homes for sale. Turn key with high cash flow! At roughly a 10% cap rate this package offers strong performance in Kansas City's sought ofter rental market. 4026 Agnes Ave. 2463 Denver Ave. 5107 40th St. 3044 E 60th St.
-
2026-03-30$112,000 Active 1592-char remark
Show marketing remark (1592 chars)
Renovated 3-bedroom home offering functional layout, recent capital improvements, and strong rental or owner-occupant potential. Updates completed between 2023–2026 total over $25,000 and include fresh interior paint throughout, updated flooring, remodeled kitchen and bathrooms, new interior doors, new stove and refrigerator, and a new hot water heater. The kitchen features updated cabinetry and fixtures with a clean, modern finish. Bathrooms have been refreshed with updated vanities, lighting, and plumbing fixtures. The main level includes two bedrooms, a full bath, living area, dining space, and convenient laundry access on the primary floor. The second level features a generously sized third bedroom spanning the length of the home, providing privacy and flexibility for a primary suite, home office, flex space, or additional living area. The full basement offers substantial unfinished storage space with room for mechanical access, storage shelving, or future customization. Exterior access and lot layout provide usable yard space with potential for outdoor seating, garden beds, or additional improvements. Located near The Paseo corridor with access to U. S. 71 Highway, major east-west routes, and neighborhood parks, this property provides connectivity to Downtown Kansas City, Midtown, and surrounding commercial districts. Suitable for investors seeking a stabilized rental-ready asset or buyers looking for updated condition with expansion potential. Can be sold individually of as a package with MLS#s 2606783, 2610158, 2610424, 2610418. Package MLS# is 2619226.
-
2026-03-30historical
Show marketing remark (1592 chars)
Renovated 3-bedroom home offering functional layout, recent capital improvements, and strong rental or owner-occupant potential. Updates completed between 2023–2026 total over $25,000 and include fresh interior paint throughout, updated flooring, remodeled kitchen and bathrooms, new interior doors, new stove and refrigerator, and a new hot water heater. The kitchen features updated cabinetry and fixtures with a clean, modern finish. Bathrooms have been refreshed with updated vanities, lighting, and plumbing fixtures. The main level includes two bedrooms, a full bath, living area, dining space, and convenient laundry access on the primary floor. The second level features a generously sized third bedroom spanning the length of the home, providing privacy and flexibility for a primary suite, home office, flex space, or additional living area. The full basement offers substantial unfinished storage space with room for mechanical access, storage shelving, or future customization. Exterior access and lot layout provide usable yard space with potential for outdoor seating, garden beds, or additional improvements. Located near The Paseo corridor with access to U. S. 71 Highway, major east-west routes, and neighborhood parks, this property provides connectivity to Downtown Kansas City, Midtown, and surrounding commercial districts. Suitable for investors seeking a stabilized rental-ready asset or buyers looking for updated condition with expansion potential. Can be sold individually of as a package with MLS#s 2606783, 2610158, 2610424, 2610418. Package MLS# is 2619226.
-
2026-03-11historical Active Under Contract
-
2026-02-16$112,000 Active
-
2025-10-13historical
-
2025-08-02$105,000 Active
-
2025-07-25historical
-
2025-05-28price $113,950
-
2025-03-16historical $1,200
-
2025-01-23$114,950 Active
-
2024-12-30$1,200
-
2023-11-08historical $1,150
-
2023-09-21price $1,150
-
2023-09-08$1,400
-
2020-02-28soldstatus
-
2013-03-28soldstatus $91,396
-
2005-12-08soldstatus
-
2005-10-17$24,000
-
1984-08-01soldstatus
ⓘ Source: listings_history table (triggers on properties + properties_extension) + one-shot
backfill from property_details.listing_events for pre-trigger history.
Tax reassessment forecast MO · Resets to sale price
- Current annual tax
- $376 · $31/mo
- Projected year-2 tax
- $1,018 · $85/mo
- Expected delta
- +$643/yr (+$54/mo · 171.1%)
ⓘ Screening estimate from a state-policy table — verify with the county assessor before closing.
Climate risk First Street
- Flood 1/10 Low FEMA zone X (unshaded) · 0% chance over 30 yrs
- Wildfire 1/10 Low
- Heat 4/10 Moderate 7 d/yr ≥107°F today · 17 d/yr by 30 yrs out
- Wind 2/10 Low
- Air quality 3/10 Moderate 2 unhealthy d/yr today · 3 by 30 yrs out
Nearby sold comps map
Loading sold comps map…
Walkable amenities ~0.75 mi
Loading nearby amenities…
Taxation est. · year 1
- Rental income
- $14,848
- − Mortgage interest
- −$5,882
- − Property taxes
- −$376
- − Insurance
- −$525
- − Repairs & maintenance
- −$1,188
- − Management
- −$1,188
- − Depreciation
- −$3,055
- Taxable income
- $2,635
- Est. tax owed @ 24.0%
- −$633
- After-tax cash flow
- $3,589/yr
For passive investors: Depreciation is non-cash, so a rental often shows a tax loss while cash-flowing — sheltering income. Rental losses are passive: they offset passive income freely, and up to $25,000/yr can offset ordinary (W-2) income if you actively participate and your MAGI is under $100k (phasing out to $0 by $150k); unused losses carry forward. On sale, claimed depreciation is recaptured at up to 25%, and gains may owe capital-gains tax (a 1031 exchange can defer both). Figures are a year-1 estimate at your 24.0% rate — not tax advice; consult a CPA.
Schools (NCES district)
- District
- Kansas City 33
- NCES district ID
- 2916400
- Math proficiency
- 12% ▼ -8.00%
- Reading proficiency
- 24% ▬ 0.00%
- Median HH income
- $35,227
- Composite
- 14.8/100
- National rank
- #9387
- State rank
- #308 of 324 in MO
Livability — Kansas City
- Score
- 78/100
- State rank
- #28
- US rank
- #2671
Category grades
Schools grade is shown separately in the Schools card above.
Census & demographics
- Census place
- Kansas City, MO
- County
- Jackson County · 687,798 people
- City population
- 439,467
- Metro
- Kansas City, MO-KS
- Population (ZIP)
- 19,644
- Household income
- $42,221
- Rent vs Own
- Severe rent burden
- 1132.0
Population outlook (Jackson County) Hauer SSP2
- Today (2025)
- 719,589 people
- By 2030
- 731,456 · +1.6%
- By 2040
- 746,689 · +3.8%
- By 2050
- 749,289 · +4.1%
- By 2075
- 736,227 · +2.3%
- By 2100
- 668,210 · -7.1%
Race, ethnicity, and origin ACS 2023
- Neighborhood character
- Predominantly Black (80%)
- Race & ethnicity
- Black 80% White 9% Hispanic / Latino 8% Two or more races 6%
- Hispanic origin (detail)
- Mexican 5%
- Common ancestry
- Lithuanian 1% Swedish 0%
- Foreign-born
- 6% · Canada
- Languages at home
- 92% English-only · Spanish 7%
Political lean MEDSL · Jackson
- 2024 margin
- D (+19.3) · D 58.9% · R 39.5% · Other 1.6%
- 2008→2024 swing
- -6.1pp toward R · 2008: 25.4pp · 2024: 19.3pp
- All cycles
- 2024: D+19.3 2020: D+22.0 2016: D+16.6 2012: D+19.0 2008: D+25.4
Not yet ingested
- Civics
- —
Market trends
- HPI YoY
- ▼ -73.32%
- Current HPI
- 267.491
- Rent YoY
- ▲ 4.42%
- Metro
- Kansas City, MO-KS
- State GDP YoY
- ▲ 1.84%
- F500 in state
- 20
Industry mix (Fortune 500 HQ in MO)
| Industry | F500 HQs | Revenue |
|---|---|---|
| Healthcare | 1 | $163B |
|
||
| Insurance | 1 | $21B |
|
||
| Industrial Technology | 1 | $17B |
|
||
| Retail | 1 | $16B |
|
||
| Industrial Distribution | 1 | $10B |
|
||
| Utilities | 1 | $9B |
|
||
Price history
+1564.6% since first listed21 events — show timeline
- 2026-05-14 Price Changed $399,500 Heartland MLS as Distributed by MLS Grid
- 2026-05-09 Listed $419,000 Heartland MLS as Distributed by MLS Grid
- 2026-03-30 Listing Removed — Heartland MLS as Distributed by MLS Grid
- 2026-03-30 Listed $112,000 Heartland MLS as Distributed by MLS Grid
- 2026-03-11 Contingent — Heartland MLS as Distributed by MLS Grid
- 2026-02-16 Listed $112,000 Heartland MLS as Distributed by MLS Grid
- 2025-10-13 Listing Removed — Heartland MLS as Distributed by MLS Grid
- 2025-08-02 Listed $105,000 Heartland MLS as Distributed by MLS Grid
- 2025-07-25 Listing Removed — Heartland MLS as Distributed by MLS Grid
- 2025-05-28 Price Changed $113,950 Heartland MLS as Distributed by MLS Grid
- 2025-03-16 Rental Removed $1,200 RENTFEEDER
- 2025-01-23 Listed $114,950 Heartland MLS as Distributed by MLS Grid
- 2024-12-30 Listed for Rent $1,200 RENTFEEDER
- 2023-11-08 Rental Removed $1,150 RENTFEEDER
- 2023-09-21 Price Changed $1,150 RENTFEEDER
- 2023-09-08 Listed for Rent $1,400 RENTFEEDER
- 2020-02-28 Sold (Public Records) — Public Records
- 2013-03-28 Sold (Public Records) $91,396 Public Records
- 2005-12-08 Sold (MLS) — Heartland MLS as Distributed by MLS Grid
- 2005-10-17 Listed $24,000 Heartland MLS as Distributed by MLS Grid
- 1984-08-01 Sold (Public Records) — Public Records
Property tax history
+34.8%/yrLatest (2025): $376 · +22.2% YoY. Source: county tax records.
Cash-flow waterfall
monthlySold comps — $/sqft
last 12 mo · ≤1 miLoading sold comps…