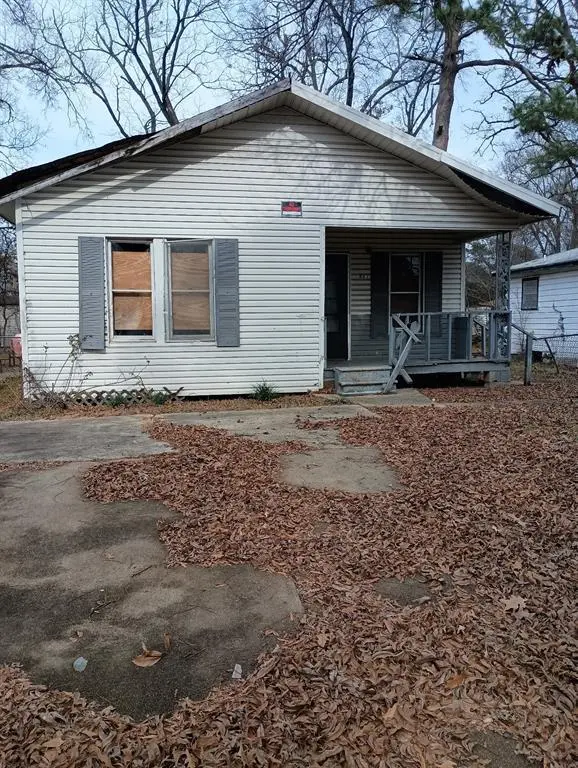
462 E 84th St · Shreveport, LA
Flood risk 1/10 · Minimal
- FEMA flood zone
- X (shaded)
- Chance of flooding over 30 yrs
- 0.0%
- Est. flood insurance / yr
- $507 – $1,088
Fire risk 1/10 · Minimal
- Est. fire insurance / yr
- $1,269 – $2,357
Heat risk 7/10 · Major
- Hot days now (above 110°F)
- 7 days/yr
- Hot days in 30 yrs
- 22 days/yr
Wind risk 6/10 · Moderate
- Chance of severe wind over 30 yrs
- 68.0%
Air-quality risk 2/10 · Minimal
- Unhealthy air days now
- 0 days/yr
- Unhealthy air days in 30 yrs
- 1 days/yr
Risk factors via First Street. Map © Google.
Why this score? — see what drove the B+ grade
The composite is a weighted blend of 9 inputs, each scored 0–100. Each bar is that input's sub-score; the figure is the points it added to the 100-point composite (weight × sub-score).
- Cash flow +30.0/30.0
- ARV discount +15.0/15.0
- 1% rule +10.0/10.0
- DSCR +10.0/10.0
- Rent growth +4.4/5.0
- Livability +3.0/5.0
- Condition / age +2.5/5.0
- Schools +2.2/10.0
- Appreciation +0.0/10.0
$32,000
🖨 Deal sheet (PDF) 📄 Offer letter ✓ Due diligence
Listing remarks MLS
Investor or Handyman Special — Great Opportunity in Shreveport! Introducing a fantastic value-driven opportunity at 462 E. 84th St, Shreveport, LA 71106 — a solid 3-bedroom, 1-bathroom residence with massive upside potential in the vibrant and growing Shreveport market. At 859 square feet, this home has the perfect footprint for a cozy living space, and its layout offers flexibility to redesign and modernize. While the home currently needs work and lacks some basic systems — including appliances, water heater, air conditioning, and heating — this means a buyer can truly tailor every detail and capture incredible added value through improvements. This is a rare blank canvas priced to reflect its condition and potential. One of the standout features of this property is the fenced backyard, offering privacy and safe outdoor space — perfect for family gatherings, pets, gardens, or future outdoor upgrades. The partial front yard fencing and concrete driveway add to the property’s charm and functionality right now, with even more potential ahead.
Key facts
- Fenced backyard
- Concrete driveway
- 5,009 sq ft lot
Tags
Neighborhood map
What this means for you Summary
Snapshot
- This is a 3-bed/1.0-bath single-family listed at $32k.
Deal economics
- At list price, monthly cash flow is $671 ($8k/yr) — positive.
- The deal already cash-flows at list — no discount required.
- Meets the 1% rule at list price ($1k rent vs $32k).
- Recommended offer: $28k (12.0% below list) — sets the bar for market timing.
- Cap rate 31.5% vs local median 5.7% in Shreveport — top-decile yield for the area; either an underpriced asset or a hidden risk that comps aren't pricing in. Stress-test before assuming the spread holds.
Location & tenants
- Location reads 59/100 on livability (#270 in LA) — a working-class tenant base; expect higher turnover. Strengths: cost of living A+, housing A; Watch: schools D+, crime F, amenities F.
- Caddo Parish (urban): math 21% / reading 32% proficiency, ranked #53 of 98 in LA (top 54%) — low school quality limits family demand, transient renter base, plan for 1-2y turnover; 64% free/reduced lunch — lower-income household profile, screen leases tightly.
- Market conditions: Rents rising fast (+7.5%/yr); 485 active listings in the ZIP; 9 comparable units currently listed for rent nearby; rentals at typical pace (median 22d on market — plan ~3-4 weeks tenant-placement turnaround); 44% of comp listings sitting > 30 days — soft ceiling on asking rent; solid renter incomes; 221 units permitted in Caddo Parish in 2024 (0 in 5+ unit buildings).
- This rent is only 16% of the median local income ($81k/yr) — well below the 30% rent-burden line; pricing power to push rent on renewal without tenant pushback.
Forward outlook
- Local home prices are declining (-3.0%/yr); year-one equity from $221 of loan paydown is wiped out by about $960 of value loss. Plan a longer hold.
- Caddo County population projected at -15% by 2050 — secular population decline; favor cash flow + early exit over multi-decade hold.
- At projected returns (-3.0% appreciation + 7.5% rent growth), your $9k cash investment doubles in ~2 years — after that, you're playing with house money.
Negotiation context
- It's been on market 161 days — a 12% lower offer ($28k) is reasonable based on typical stale-listing flexibility.
Risks & watch-outs
- Climate carrying-cost: major wind risk, 68% chance of damaging wind over 30y; extreme-heat days projected 7→22/yr by 2055 (HVAC capex compounding) — expect insurance premiums to compound above CPI over the hold.
Questions for the listing agent
- It's been on market 161 days. Have you received any prior offers? Is the seller open to a 12% concession, seller financing, or rate buy-down credit?
- Built in 1960 — when were the roof, HVAC, electrical panel, plumbing, and water heater last replaced?
- Why hasn't it sold? Are there any deal-killer items the seller is aware of (foundation, flood, title, zoning, code violations)?
- Is there a deadline driving the sale (1031 exchange, divorce, estate, relocation)? That informs how much negotiation room exists.
- Schools are D-rated, which usually means shorter tenancies and higher turnover. Who's the typical renter profile here, and what's been the actual vacancy rate?
- Crime grade is F in this area — have there been break-ins, vandalism, or insurance claims at this property in the last 3 years? What carrier currently insures it and at what premium?
- What's the average days-on-market for RENTAL listings here right now (not sales)? A rising rental-DOM trend means longer vacancies and softer asking-rent achievability than the comps imply.
- What's the recent tenant-quality profile in this submarket — average credit score on applications, eviction rate, late-payment / NSF rate, and stable-employment percentage? A property-management company in the area should have these aggregated.
- How much new for-sale + rental construction is in the pipeline within 1–3 miles? Heavy new supply typically softens prices + rents 12–24 months out; constrained supply supports both.
Investment metrics
- 1% rule
- 3.47% ✓
- Cap rate
- 31.45%
- Cash-on-cash
- 89.85%
- DSCR
- 5.00
- GRM
- 2.4
CMA / ARV
- ARV (median comp)
- $56,501
- List price
- $32,000
- Delta
- -43.36%
- Verdict
- UNDERPRICED
- Comps
- 20 within 1.0 mi
Show comp detail 5 sales within ~0.75 mi
| Address | Dist | Beds/Ba | Sqft | Sold | Price | $/sf | Match |
|---|---|---|---|---|---|---|---|
| 740 Rainbow Dr | 0.69mi | 3/1.0 | 864 (+1%) | 2mo | $48,000 | $56 | 65 |
| 610 Terrell Dr | 0.47mi | 3/1.0 | 950 (+11%) | 2mo | $85,000 | $89 | 59 |
| 328 E 81st St | 0.21mi | 3/1.0 | 950 (+11%) | 22mo | $35,000 | $37 | 54 |
| 134 S Greenbrook Loop | 0.40mi | 3/1.0 | 950 (+11%) | 13mo | $88,000 | $93 | 53 |
| 7620 Liberty St | 0.67mi | 2/1.5 (-1) | 875 (+2%) | 19mo | $60,900 | $70 | 43 |
Match score weights: distance 35% · size 25% · config 20% · recency 20%. Top-matched comps best support the ARV.
Projected returns pro-forma
-3.0% appreciation · 7.51% rent growth · sell at horizon
- IRR
- 95.5%
- Equity multiple
- 5.78×
- Total profit
- $42,818
- Equity at exit
- $4,771
- IRR
- 99.1%
- Equity multiple
- 13.95×
- Total profit
- $116,057
- Equity at exit
- $2,767
Cash invested: $8,960 (down + closing). Projections, not guarantees.
Landlord ↔ Tenant lean methodology
- Overall (STATE)
- 90 Strongly Landlord-Friendly
- State Louisiana
- 90 Strongly Landlord-Friendly · R+12
- County
- — inherits STATE
- City
- — inherits STATE
ZIP-level market 71106
- Rents YoY
- 7.5%
- Active inventory
- 485
- Price-to-rent
- 2.4×
Monthly cashflow live
- Estimated rent
- $1,110 high interval (Pro) →
- Mortgage (P&I)
- −$168
- Tax from tax record
- −$25 /mo · $298/yr
- Insurance
- −$13
- HOA
- −$0
- Vacancy / Maint / Mgmt
- −$233
- Net cashflow
- $671
Break-even live
Sensitivity live
| Price | -10% $689 | -5% $680 | +0% $671 | +5% $662 | +10% $653 |
|---|---|---|---|---|---|
| Rent | -10% $583 | -5% $627 | +0% $671 | +5% $715 | +10% $759 |
| Rate | -1.0pp $687 | -0.5pp $679 | base $671 | +0.5pp $663 | +1.0pp $654 |
UW: 25.0% down · 7.5% · 30yr · 1.5% tax · 5.0% vac · 8.0% maint · 8.0% mgmt
Financing live
Cash to close
- Down payment
- $8,000
- Closing costs
- $960
- Reserves months
- —
- Total cash needed
- —
Loan-product check · same deal, 3 products live
Conventional
25% down · 7.5% · 30yr
- Down + closing
- —
- Monthly P&I
- —
- Monthly cashflow
- —
- DSCR
- —
- Eligible?
- —
Personal DTI + credit; lowest rate.
DSCR
20% down · 8.5% · 30yr
- Down + closing
- —
- Monthly P&I
- —
- Monthly cashflow
- —
- DSCR
- —
- Eligible?
- —
No personal income docs; deal must DSCR.
Hard money
10% down · 12.0% · 12mo
- Down + closing
- —
- Monthly P&I
- —
- Monthly cashflow
- —
- DSCR
- —
- Eligible?
- —
Short-term bridge; refi at stabilization.
Rent comps 9 comps
| Address | Beds | Baths | Sqft | Rent | $/sqft | DOM | Units | Dist |
|---|---|---|---|---|---|---|---|---|
| 323 W 83rd St Shreveport, LA | 3.0 | 1.0 | 973 | $750 | $0.77 | 44d | 1 | 0.77mi |
| 629 David Dr Shreveport, LA | 3.0 | 1.5 | 1064 | $1,100 | $1.03 | 22d | 1 | 1.13mi |
| 223 W 69th St Shreveport, LA | 2.0 | 1.0 | 990 | $750 | $0.76 | 44d | 1 | 1.16mi |
| 570 Sally Ann Dr Shreveport, LA | 3.0 | 1.0 | 1082 | $825 | $0.76 | 14d | 1 | 1.23mi |
| 622 W 75th St Shreveport, LA | 2.0 | 1.0 | 833 | $800 | $0.96 | 22d | 1 | 1.26mi |
| 7913 Woodfield Dr Shreveport, LA | 3.0 | 1.0 | 1067 | $1,000 | $0.94 | 44d | 1 | 1.32mi |
| 8902 Coyth Ln Shreveport, LA | 3.0 | 2.0 | 1082 | $1,200 | $1.11 | 44d | 1 | 1.37mi |
| 7000 Fern Ave Shreveport, LA | 2.0 | 1.0–2.0 | 895 | $1,605 | $1.79 | 14d | 6 | 1.44mi |
| 8455 Fern Ave Shreveport, LA | 1.0–2.0 | 1.0–2.0 | 978 | $2,229 | $2.28 | 14d | 9 | 1.49mi |
Listing history 17 events
-
2026-06-18days on market $32,000 Active 161 DOM
-
2026-06-17days on market $32,000 Active 160 DOM
-
2026-06-16days on market $32,000 Active 159 DOM
-
2026-06-15days on market $32,000 Active 158 DOM
-
2026-06-14days on market $32,000 Active 156 DOM
-
2026-06-13days on market $32,000 Active 155 DOM
-
2026-06-10days on market $32,000 Active 153 DOM
-
2026-06-09days on market $32,000 Active 152 DOM
-
2026-06-08days on market $32,000 Active 151 DOM
-
2026-06-07days on market $32,000 Active 150 DOM
-
2026-06-05days on market $32,000 Active 147 DOM
-
2026-06-03days on market $32,000 Active 146 DOM
-
2026-06-02days on market $32,000 Active 145 DOM
-
2026-06-01days on market $32,000 Active 144 DOM
-
2026-05-31days on market $32,000 Active 143 DOM
-
2026-05-30days on market $32,000 Active 142 DOM
-
2026-01-09$32,000 Active 1102-char remark
Show marketing remark (1102 chars)
Investor or Handyman Special — Great Opportunity in Shreveport! Introducing a fantastic value-driven opportunity at 462 E. 84th St, Shreveport, LA 71106 — a solid 3-bedroom, 1-bathroom residence with massive upside potential in the vibrant and growing Shreveport market. At 859 square feet, this home has the perfect footprint for a cozy living space, and its layout offers flexibility to redesign and modernize. While the home currently needs work and lacks some basic systems — including appliances, water heater, air conditioning, and heating — this means a buyer can truly tailor every detail and capture incredible added value through improvements. This is a rare blank canvas priced to reflect its condition and potential. One of the standout features of this property is the fenced backyard, offering privacy and safe outdoor space — perfect for family gatherings, pets, gardens, or future outdoor upgrades. The partial front yard fencing and concrete driveway add to the property’s charm and functionality right now, with even more potential ahead.
ⓘ Source: listings_history table (triggers on properties + properties_extension) + one-shot
backfill from property_details.listing_events for pre-trigger history.
Tax reassessment forecast LA · Resets to sale price
- Current annual tax
- $298 · $25/mo
- Projected year-2 tax
- $298 · $25/mo
- Expected delta
- $0/yr ($0/mo · 0.0%)
ⓘ Screening estimate from a state-policy table — verify with the county assessor before closing.
Climate risk First Street
- Flood 1/10 Low FEMA zone X (shaded) · 0% chance over 30 yrs
- Wildfire 1/10 Low
- Heat 7/10 Severe 7 d/yr ≥110°F today · 22 d/yr by 30 yrs out
- Wind 6/10 Major 68% chance of damaging wind over 30 yrs
- Air quality 2/10 Low 0 unhealthy d/yr today · 1 by 30 yrs out
Nearby sold comps map
Loading sold comps map…
Walkable amenities ~0.75 mi
Loading nearby amenities…
Taxation est. · year 1
- Rental income
- $13,320
- − Mortgage interest
- −$1,792
- − Property taxes
- −$298
- − Insurance
- −$160
- − Repairs & maintenance
- −$1,066
- − Management
- −$1,066
- − Depreciation
- −$931
- Taxable income
- $8,007
- Est. tax owed @ 24.0%
- −$1,922
- After-tax cash flow
- $6,129/yr
For passive investors: Depreciation is non-cash, so a rental often shows a tax loss while cash-flowing — sheltering income. Rental losses are passive: they offset passive income freely, and up to $25,000/yr can offset ordinary (W-2) income if you actively participate and your MAGI is under $100k (phasing out to $0 by $150k); unused losses carry forward. On sale, claimed depreciation is recaptured at up to 25%, and gains may owe capital-gains tax (a 1031 exchange can defer both). Figures are a year-1 estimate at your 24.0% rate — not tax advice; consult a CPA.
Schools (NCES district)
- District
- Caddo Parish
- NCES district ID
- 2200300
- Math proficiency
- 21% ▼ -33.00%
- Reading proficiency
- 32% ▼ -30.00%
- Median HH income
- $39,227
- Composite
- 22.23/100
- National rank
- #8148
- State rank
- #53 of 98 in LA
Livability — Shreveport
- Score
- 59/100
- State rank
- #270
- US rank
- #19730
Category grades
Schools grade is shown separately in the Schools card above.
Census & demographics
- Census place
- Shreveport, LA
- County
- Caddo Parish · 178,536 people
- City population
- 164,123
- Metro
- Shreveport-Bossier City, LA
- Population (ZIP)
- 34,117
- Household income
- $81,452
- Rent vs Own
- Severe rent burden
- 1333.0
Population outlook (Caddo County) Hauer SSP2
- Today (2025)
- 243,190 people
- By 2030
- 237,231 · -2.5%
- By 2040
- 222,502 · -8.5%
- By 2050
- 206,516 · -15.1%
- By 2075
- 165,706 · -31.9%
- By 2100
- 122,262 · -49.7%
Race, ethnicity, and origin ACS 2023
- Neighborhood character
- Diverse neighborhood (Simpson 0.59)
- Race & ethnicity
- White 51% Black 39% Hispanic / Latino 5% Two or more races 5%
- Hispanic origin (detail)
- Mexican 3%
- Common ancestry
- Lithuanian 3% Slovak 2% Serbian 1%
- Foreign-born
- 3% · Canada
- Languages at home
- 96% English-only · Spanish 3% Other Indo-European 0%
Political lean MEDSL · Caddo
- 2024 margin
- Toss-up / Even · D 51.6% · R 47.0% · Other 1.4%
- 2008→2024 swing
- +1.6pp toward D · 2008: 3.0pp · 2024: 4.6pp
- All cycles
- 2024: D+4.6 2020: D+6.8 2016: D+4.2 2012: D+4.9 2008: D+3.0
Not yet ingested
- Civics
- —
Market trends
- HPI YoY
- ▼ -86.48%
- Current HPI
- 124.2416
- Rent YoY
- ▲ 7.51%
- Metro
- Shreveport-Bossier City, LA
- State GDP YoY
- ▲ 3.29%
- F500 in state
- 10
Industry mix (Fortune 500 HQ in LA)
| Industry | F500 HQs | Revenue |
|---|---|---|
| Telecommunications | 2 | $23B |
|
||
| Utilities | 1 | $12B |
|
||
| Wholesale / Distribution | 1 | $5B |
|
||
| Advertising | 1 | $2B |
|
||
Price history
1 event — show timeline
- 2026-01-09 Listed $32,000 NTREIS
Property tax history
+11.1%/yrLatest (2025): $298 · +0.4% YoY. Source: county tax records.
Cash-flow waterfall
monthlySold comps — $/sqft
last 12 mo · ≤1 miLoading sold comps…