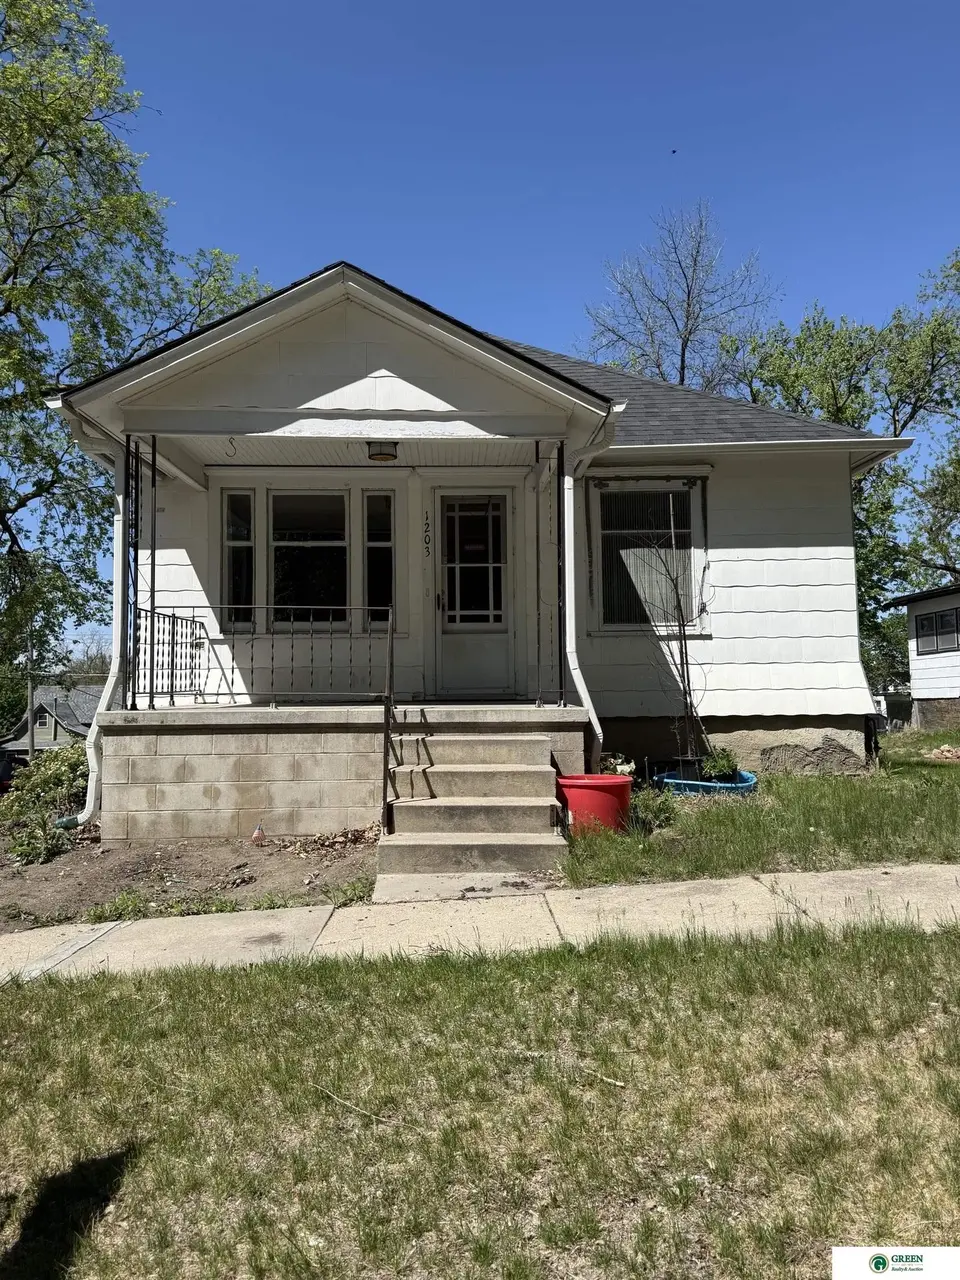
1203 N Iowa Ave · York, NE
Flood risk 1/10 · Minimal
- FEMA flood zone
- X (unshaded)
- Chance of flooding over 30 yrs
- 0.0%
- Est. flood insurance / yr
- $473 – $860
Fire risk 1/10 · Minimal
- Est. fire insurance / yr
- $1,161 – $2,155
Heat risk 3/10 · Minor
- Hot days now (above 104°F)
- 7 days/yr
- Hot days in 30 yrs
- 15 days/yr
Wind risk 2/10 · Minimal
- Chance of severe wind over 30 yrs
- —
Air-quality risk 1/10 · Minimal
- Unhealthy air days now
- 0 days/yr
- Unhealthy air days in 30 yrs
- 0 days/yr
Risk factors via First Street. Map © Google.
Why this score? — see what drove the B grade
The composite is a weighted blend of 9 inputs, each scored 0–100. Each bar is that input's sub-score; the figure is the points it added to the 100-point composite (weight × sub-score).
- Cash flow +30.0/30.0
- 1% rule +10.0/10.0
- DSCR +10.0/10.0
- ARV discount +7.5/15.0
- Schools +4.5/10.0
- Livability +4.0/5.0
- Rent growth +2.5/5.0
- Condition / age +2.5/5.0
- Appreciation +0.0/10.0
$55,000
🖨 Deal sheet 📄 Offer letter ✓ Due diligence
Listing remarks
Opportunity awaits you! Property sells 'as-is'!
Key facts
- 6,098 sq ft lot
- Garage
- Built 1900
Property features AI
Exterior
- Parking: Attached garage with space for one vehicle (covered)
- Utilities: Public water; Public sewer
- Home design: Single-family residential home; Not new (built in 1900); Total living area approximately 1,103 square feet with about 928 above-grade and 175 below-grade finished
- Construction: Foundation: Other
- Exterior features: Front porch; Lot about 0.14 acre (approximately 49.73 x 119.49)
Interior
- Kitchen: Range; Refrigerator
- Bedrooms: Primary bedroom on the main floor; Second bedroom on the main floor
- Bathrooms: One main-level bathroom
- Heating & cooling: Natural gas forced-air heating; Central air conditioning
- Interior features: Partial, partially finished basement (approximately 640 below-grade finished area); No fireplaces
- Laundry & utility: Washer/dryer location not specified
Neighborhood map
What this means for you Summary
Snapshot
- This is a 2-bed/1.0-bath single-family listed at $55k.
Deal economics
- At list price, monthly cash flow is $416 ($5k/yr) — positive.
- The deal already cash-flows at list — no discount required.
- Meets the 1% rule at list price ($1k rent vs $55k).
- Recommended offer: $53k (3.0% below list) — sets the bar for market timing.
- Cap rate 15.4% vs local median 3.2% in York — top-decile yield for the area; either an underpriced asset or a hidden risk that comps aren't pricing in. Stress-test before assuming the spread holds.
Location & tenants
- Location reads 80/100 on livability (#24 in NE, #1,666 nationally) — a professional / high-income tenant draw. Strengths: cost of living A+, housing A+, health & safety A+; Watch: amenities F, commute F.
- York Public Schools (town): math 55% / reading 51% proficiency, ranked #55 of 111 in NE (top 50%) — acceptable for families but not a draw, mixed tenant base, ~2y average lease.
- Zoned schools: York Elementary School (math 58% / reading 50%, grade C, #194 of 502 statewide, top 39%, 594 students, 50% FRL); York Middle School (math 54% / reading 52%, grade C+, #41 of 128 statewide, top 32%, 315 students, 44% FRL); York High School (math 52% / reading 47%, grade D, #107 of 261 statewide, top 52%, 522 students, 39% FRL).
- Market conditions: 74 active listings in the ZIP; 1 comparable units currently listed for rent nearby; 29 units permitted in York County in 2024 (0 in 5+ unit buildings).
Forward outlook
- Local home prices are declining (-3.0%/yr); year-one equity from $380 of loan paydown is wiped out by about $2k of value loss. Plan a longer hold.
- York County population projected at +8% by 2050 — modest demand growth; plan on rents tracking national, not racing it.
- At projected returns (-3.0% appreciation + 3.0% rent growth), your $15k cash investment doubles in ~4 years — after that, you're playing with house money.
Negotiation context
- It's been on market 45 days — a 3% lower offer ($53k) is reasonable based on typical stale-listing flexibility.
Risks & watch-outs
- Watch-outs: built in 1900 — expect roof / HVAC / electrical / plumbing capex.
Questions for the listing agent
- It's been on market 45 days. Have you received any prior offers? Is the seller open to a 3% concession, seller financing, or rate buy-down credit?
- Built in 1900 — when were the roof, HVAC, electrical panel, plumbing, and water heater last replaced?
- Is there a deadline driving the sale (1031 exchange, divorce, estate, relocation)? That informs how much negotiation room exists.
- Schools are A-rated — typically a magnet for longer-tenancy family renters. What's the average tenant stay here, and is there a school-zone premium baked into asking?
- What's the average days-on-market for RENTAL listings here right now (not sales)? A rising rental-DOM trend means longer vacancies and softer asking-rent achievability than the comps imply.
- What's the recent tenant-quality profile in this submarket — average credit score on applications, eviction rate, late-payment / NSF rate, and stable-employment percentage? A property-management company in the area should have these aggregated.
- How much new for-sale + rental construction is in the pipeline within 1–3 miles? Heavy new supply typically softens prices + rents 12–24 months out; constrained supply supports both.
Investment metrics
- 1% rule
- 1.82% ✓
- Cap rate
- 15.37%
- Cash-on-cash
- 32.43%
- DSCR
- 2.44
- GRM
- 4.6
CMA / ARV
- ARV (median comp)
- $131,494
- List price
- $55,000
- Delta
- -58.17%
- Verdict
- UNDERPRICED
- Comps
- 20 within 1.0 mi
Show comp detail 12 sales within ~0.75 mi
| Address | Dist | Beds/Ba | Sqft | Sold | Price | $/sf | Match |
|---|---|---|---|---|---|---|---|
| 1121 N East Ave | 0.06mi | 3/1.0 (+1) | 1,628 (+4%) | 1mo | $75,000 | $46 | 85 |
| 1108 N Nebraska Ave | 0.11mi | 2/1.0 | 1,640 (+5%) | 7mo | $175,500 | $107 | 82 |
| 1125 N Burlington Ave | 0.06mi | 3/1.0 (+1) | 1,400 (-11%) | 6mo | $130,000 | $93 | 69 |
| 22 Arbor Ct | 0.30mi | 3/1.0 (+1) | 1,674 (+7%) | 4mo | $218,000 | $130 | 67 |
| 1217 N Grant Ave | 0.19mi | 3/2.0 (+1) | 1,708 (+9%) | 3mo | $173,500 | $102 | 65 |
| 1003 N Blackburn Ave | 0.32mi | 2/1.5 | 1,684 (+7%) | 10mo | $160,000 | $95 | 63 |
| 423 E 6th St | 0.40mi | 3/1.0 (+1) | 1,424 (-9%) | 6mo | $150,000 | $105 | 57 |
| 418 E 5th St | 0.50mi | 2/1.0 | 1,392 (-11%) | 4mo | $150,000 | $108 | 55 |
| 1730 N Main Ave | 0.42mi | 2/2.5 | 1,370 (-13%) | 6mo | $369,300 | $270 | 48 |
| 200 W 19th St | 0.54mi | 3/1.0 (+1) | 1,400 (-11%) | 10mo | $183,000 | $131 | 44 |
| 1826 N York Ave | 0.55mi | 2/1.5 | 1,760 (+12%) | 11mo | $240,000 | $136 | 43 |
| 320 N East Ave | 0.58mi | 3/2.0 (+1) | 1,784 (+14%) | 7mo | $198,000 | $111 | 35 |
Match score weights: distance 35% · size 25% · config 20% · recency 20%. Top-matched comps best support the ARV.
Projected returns pro-forma
-3.0% appreciation · 3.0% rent growth · sell at horizon
- IRR
- 27.5%
- Equity multiple
- 2.14×
- Total profit
- $17,610
- Equity at exit
- $8,201
- IRR
- 35.0%
- Equity multiple
- 4.22×
- Total profit
- $49,517
- Equity at exit
- $4,755
Cash invested: $15,400 (down + closing). Projections, not guarantees.
Landlord ↔ Tenant lean methodology
- Overall (STATE)
- 83 Strongly Landlord-Friendly
- State Nebraska
- 83 Strongly Landlord-Friendly · R+13
- County
- — inherits STATE
- City
- — inherits STATE
ZIP-level market 68467
- Active inventory
- 74
- Price-to-rent
- 4.6×
Monthly cashflow live
- Estimated rent
- $1,000 medium interval (Pro) →
- Mortgage (P&I)
- −$288
- Tax from tax record
- −$62 /mo · $749/yr
- Insurance
- −$23
- HOA
- −$0
- Vacancy / Maint / Mgmt
- −$210
- Net cashflow
- $416
Break-even live
UW: 25.0% down · 7.5% · 30yr · 1.5% tax · 5.0% vac · 8.0% maint · 8.0% mgmt
Financing live
Cash to close
- Down payment
- $13,750
- Closing costs
- $1,650
- Reserves months
- —
- Total cash needed
- —
Loan-product check · same deal, 3 products live
Conventional
25% down · 7.5% · 30yr
- Down + closing
- —
- Monthly P&I
- —
- Monthly cashflow
- —
- DSCR
- —
- Eligible?
- —
Personal DTI + credit; lowest rate.
DSCR
20% down · 8.5% · 30yr
- Down + closing
- —
- Monthly P&I
- —
- Monthly cashflow
- —
- DSCR
- —
- Eligible?
- —
No personal income docs; deal must DSCR.
Hard money
10% down · 12.0% · 12mo
- Down + closing
- —
- Monthly P&I
- —
- Monthly cashflow
- —
- DSCR
- —
- Eligible?
- —
Short-term bridge; refi at stabilization.
Rent comps 1 comps
| Address | Beds | Baths | Sqft | Rent | $/sqft | DOM | Units | Dist |
|---|---|---|---|---|---|---|---|---|
| 1911 N Linden Ave Unit 09-612 York, NE | 3.0 | 2.0 | 1345 | $1,000 | $0.74 | 44d | 1 | 0.51mi |
Listing history 15 events
-
2026-06-18days on market $55,000 Active 45 DOM
-
2026-06-17days on market $55,000 Active 44 DOM
-
2026-06-16days on market $55,000 Active 43 DOM
-
2026-06-15pricedays on market $55,000 Active 42 DOM
-
2026-06-13days on market $61,500 Active 40 DOM
-
2026-06-12days on market $61,500 Active 39 DOM
-
2026-06-09days on market $61,500 Active 36 DOM
-
2026-06-08days on market $61,500 Active 35 DOM
-
2026-06-07days on market $61,500 Active 34 DOM
-
2026-06-07days on market $61,500 Active 33 DOM
-
2026-06-04days on market $61,500 Active 30 DOM
-
2026-06-02days on market $61,500 Active 29 DOM
-
2026-06-01days on market $61,500 Active 28 DOM
-
2026-05-31days on market $61,500 Active 27 DOM
-
2026-05-03$67,500 New 47-char remark
ⓘ Source: listings_history table (triggers on properties + properties_extension) + one-shot
backfill from property_details.listing_events for pre-trigger history.
Tax reassessment forecast NE · Resets to sale price
- Current annual tax
- $749 · $62/mo
- Projected year-2 tax
- $952 · $79/mo
- Expected delta
- +$203/yr (+$17/mo · 27.0%)
ⓘ Screening estimate from a state-policy table — verify with the county assessor before closing.
Climate risk First Street
- Flood 1/10 Low FEMA zone X (unshaded) · 0% chance over 30 yrs
- Wildfire 1/10 Low
- Heat 3/10 Moderate 7 d/yr ≥104°F today · 15 d/yr by 30 yrs out
- Wind 2/10 Low
- Air quality 1/10 Low 0 unhealthy d/yr today · 0 by 30 yrs out
Nearby sold comps map
Loading sold comps map…
Walkable amenities ~0.75 mi
Loading nearby amenities…
Taxation est. · year 1
- Rental income
- $12,000
- − Mortgage interest
- −$3,081
- − Property taxes
- −$749
- − Insurance
- −$275
- − Repairs & maintenance
- −$960
- − Management
- −$960
- − Depreciation
- −$1,600
- Taxable income
- $4,375
- Est. tax owed @ 24.0%
- −$1,050
- After-tax cash flow
- $3,945/yr
For passive investors: Depreciation is non-cash, so a rental often shows a tax loss while cash-flowing — sheltering income. Rental losses are passive: they offset passive income freely, and up to $25,000/yr can offset ordinary (W-2) income if you actively participate and your MAGI is under $100k (phasing out to $0 by $150k); unused losses carry forward. On sale, claimed depreciation is recaptured at up to 25%, and gains may owe capital-gains tax (a 1031 exchange can defer both). Figures are a year-1 estimate at your 24.0% rate — not tax advice; consult a CPA.
Schools (NCES district)
- District
- York Public Schools
- NCES district ID
- 3179050
- Math proficiency
- 55% ▼ -9.00%
- Reading proficiency
- 51% ▼ -4.00%
- Median HH income
- $48,726
- Composite
- 45.18/100
- National rank
- #2675
- State rank
- #55 of 111 in NE
Livability — York
- Score
- 80/100
- State rank
- #24
- US rank
- #1666
Category grades
Schools grade is shown separately in the Schools card above.
Census & demographics
- Census place
- York, NE
- City population
- 9,688
- Population (ZIP)
- 9,688
Population outlook (York County) Hauer SSP2
- Today (2025)
- 13,976 people
- By 2030
- 14,103 · +0.9%
- By 2040
- 14,490 · +3.7%
- By 2050
- 15,059 · +7.7%
- By 2075
- 18,276 · +30.8%
- By 2100
- 21,449 · +53.5%
Race, ethnicity, and origin ACS 2023
- Neighborhood character
- Predominantly White (88%)
- Race & ethnicity
- White 88% Hispanic / Latino 7% Two or more races 6% Black 1%
- Hispanic origin (detail)
- Mexican 3% Puerto Rican 1%
- Common ancestry
- Iranian 2% Romanian 1% Italian 1%
- Foreign-born
- 3% · Canada
- Languages at home
- 94% English-only · Spanish 4% Other Asian/Pacific 1%
Political lean MEDSL · York
- 2024 margin
- Solid R (+51.3) · D 23.6% · R 74.9% · Other 1.5%
- 2008→2024 swing
- -2.0pp toward R · 2008: -49.3pp · 2024: -51.3pp
- All cycles
- 2024: R+51.3 2020: R+51.8 2016: R+56.0 2012: R+55.4 2008: R+49.3
Not yet ingested
- Civics
- —
Market trends
- HPI YoY
- ▼ -126.71%
- Current HPI
- 192.5562
- Rent YoY
- —
- Metro
- —
- State GDP YoY
- ▲ 0.68%
- F500 in state
- 2
Industry mix (Fortune 500 HQ in NE)
| Industry | F500 HQs | Revenue |
|---|---|---|
| Conglomerate | 1 | $371B |
|
||
Price history
-18.5% since first listed3 events — show timeline
- 2026-06-15 Price Changed $55,000 GPRMLS
- 2026-05-21 Price Changed $61,500 GPRMLS
- 2026-05-03 Listed $67,500 GPRMLS
Property tax history
-1.0%/yrLatest (2025): $749 · +36.2% YoY. Source: county tax records.
Cash-flow waterfall
monthlySold comps — $/sqft
last 12 mo · ≤1 miLoading sold comps…