 12-Plex
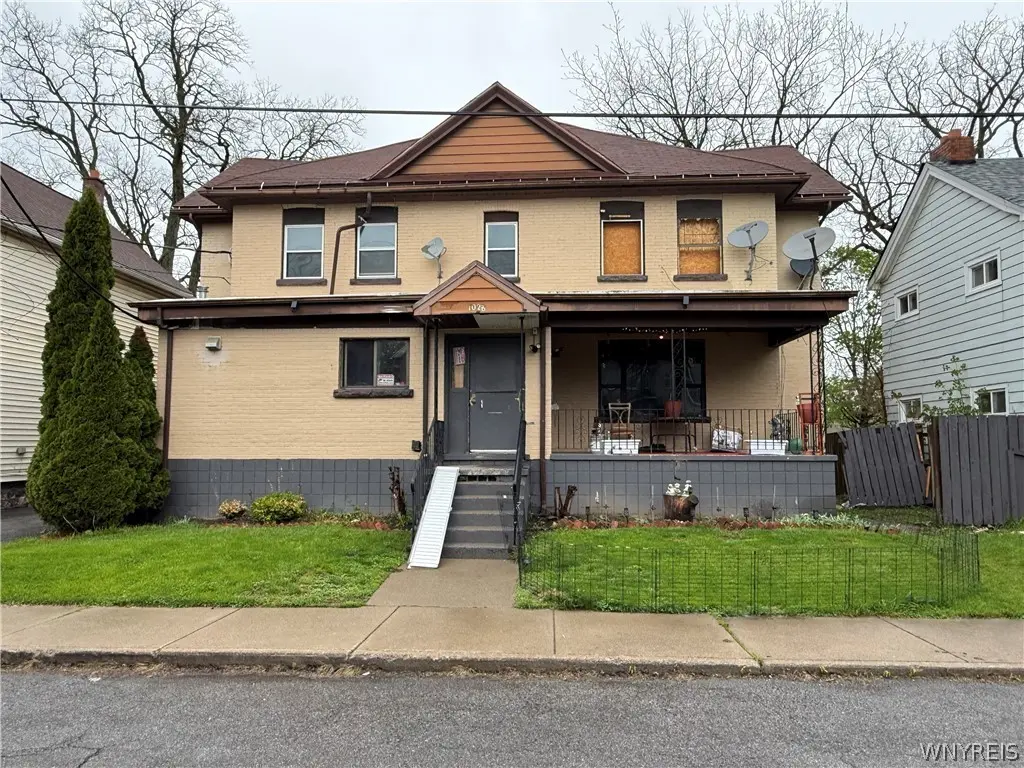
1028 South Ave · Niagara Falls, NY
Flood risk 1/10 · Minimal
- FEMA flood zone
- X (unshaded)
- Chance of flooding over 30 yrs
- 0.0%
- Est. flood insurance / yr
- $473 – $860
Fire risk 3/10 · Minor
- Est. fire insurance / yr
- $691 – $1,283
Heat risk 2/10 · Minimal
- Hot days now (above 94°F)
- 7 days/yr
- Hot days in 30 yrs
- 15 days/yr
Wind risk 1/10 · Minimal
- Chance of severe wind over 30 yrs
- —
Air-quality risk 2/10 · Minimal
- Unhealthy air days now
- 1 days/yr
- Unhealthy air days in 30 yrs
- 2 days/yr
Risk factors via First Street. Map © Google.
Why this score? — see what drove the D+ grade
The composite is a weighted blend of 9 inputs, each scored 0–100. Each bar is that input's sub-score; the figure is the points it added to the 100-point composite (weight × sub-score).
- Cash flow +15.0/30.0
- ARV discount +11.1/15.0
- 1% rule +5.0/10.0
- DSCR +5.0/10.0
- Livability +3.0/5.0
- Rent growth +2.5/5.0
- Schools +2.5/10.0
- Condition / age +2.5/5.0
- Appreciation +0.0/10.0
$285,000
🖨 Deal sheet (PDF) 📄 Offer letter ✓ Due diligence
Multi-family units
County records classify this as Multi-Family (5+ Unit). Listing-text estimate: 12 units. confirmed
5+ unit building — per-unit beds/baths from public records are typically unavailable; the breakdown below (if shown) is an estimate from the listing text.
Listing remarks MLS
Seller (s) will entertain offers between $285,000 and $330,000 or higher. All Brick solid 12-unit apartment building on quiet street in Niagara Falls. 10 out of the 12 units are rented for about $650/month and 2 units need cosmetic repair (about $10k per unit) before HUD will start paying rent again. Lots of room to up the rent to make this a big money maker and the seller is very motivated. One set of mechanics in great condition and updated electrical. National Fuel $700/month. National Grid $1000/month. Water $1000/month. Insurance $900/month. Taxes $3700/year. Come take a look at all the potential this has!
Key facts
- 8,700 sq ft lot
- Built 1926
- Listed 40 days
Neighborhood map
What this means for you Summary
Snapshot
- This is a 12 × 1-bed/1-bath units multifamily listed at $285k.
Deal economics
- At list price, monthly cash flow is $9k ($113k/yr) — positive. Per door: $787/mo.
- The deal already cash-flows at list — no discount required.
- Meets the 1% rule at list price ($14k rent vs $285k).
- Recommended offer: $276k (3.0% below list) — sets the bar for market timing.
- Cap rate 46.0% vs local median 7.6% in Niagara Falls — top-decile yield for the area; either an underpriced asset or a hidden risk that comps aren't pricing in. Stress-test before assuming the spread holds.
Location & tenants
- Location reads 60/100 on livability (#956 in NY) — a middle-class / working-renter tenant base. Strengths: cost of living A+, housing A+; Watch: crime F, amenities F, commute F.
- Niagara Falls City School District (urban): math 26% / reading 34% proficiency, ranked #578 of 590 in NY (top 98%) — families likely to look elsewhere, expect single-tenant / working-renter base with shorter leases; 66% free/reduced lunch — lower-income household profile, screen leases tightly.
- Zoned schools: Harry F Abate Elementary School (math 16% / reading 32%, grade F, #1,909 of 2,108 statewide, top 91%, 695 students, 82% FRL); Gaskill Preparatory School (math 10% / reading 22%, grade F, #702 of 729 statewide, top 96%, 500 students, 78% FRL); Niagara Falls High School (math 75% / reading 92%, grade A, #409 of 1,100 statewide, top 39%, 2,139 students, 71% FRL).
- Market conditions: 145 active listings in the ZIP; 167 units permitted in Niagara County in 2024 (0 in 5+ unit buildings).
- At $14,384/mo this rent would consume 338% of the median local household income ($51k/yr) (locally 1095% of renters already pay >50% of income on rent) — very limited rent-growth headroom before tenants either downsize or default.
Forward outlook
- Local home prices are declining (-3.0%/yr); year-one equity from $2k of loan paydown is wiped out by about $9k of value loss. Plan a longer hold.
- Niagara County population projected at -19% by 2050 — secular population decline; favor cash flow + early exit over multi-decade hold.
- At projected returns (-3.0% appreciation + 3.0% rent growth), your $80k cash investment doubles in ~1 year — after that, you're playing with house money.
Negotiation context
- It's been on market 40 days — a 3% lower offer ($276k) is reasonable based on typical stale-listing flexibility.
Risks & watch-outs
- Watch-outs: built in 1926 — expect roof / HVAC / electrical / plumbing capex.
Questions for the listing agent
- It's been on market 40 days. Have you received any prior offers? Is the seller open to a 3% concession, seller financing, or rate buy-down credit?
- Can we see the unit-by-unit rent roll, current vacancy, and any below-market leases? What's the average tenancy length?
- What capital expenditures (roof, boiler, parking lot, exteriors) have been made in the last 5 years, and what's planned in the next 2?
- Built in 1926 — when were the roof, HVAC, electrical panel, plumbing, and water heater last replaced?
- Is there a deadline driving the sale (1031 exchange, divorce, estate, relocation)? That informs how much negotiation room exists.
- Schools are F-rated, which usually means shorter tenancies and higher turnover. Who's the typical renter profile here, and what's been the actual vacancy rate?
- Crime grade is F in this area — have there been break-ins, vandalism, or insurance claims at this property in the last 3 years? What carrier currently insures it and at what premium?
- The area grade is low — what's the realistic commute time and amenity access for the typical tenant pool here? Any planned neighborhood developments (good or bad) we should know about?
- What's the average days-on-market for RENTAL listings here right now (not sales)? A rising rental-DOM trend means longer vacancies and softer asking-rent achievability than the comps imply.
- What's the recent tenant-quality profile in this submarket — average credit score on applications, eviction rate, late-payment / NSF rate, and stable-employment percentage? A property-management company in the area should have these aggregated.
- How much new apartment / multifamily construction is in the pipeline within 1–3 miles? Heavy new supply (>2% of stock underway) typically softens rents 12–24 months out; light construction supports rent growth.
Investment metrics
- 1% rule
- 5.05% ✓
- Cap rate
- 46.03%
- Cash-on-cash
- 141.93%
- DSCR
- 7.32
- GRM
- 1.7
CMA / ARV
- ARV (median comp)
- $310,060
- List price
- $285,000
- Delta
- -8.08%
- Verdict
- FAIR
- Comps
- 9 within 1.0 mi
Projected returns pro-forma
-3.0% appreciation · 3.0% rent growth · sell at horizon
- IRR
- —
- Equity multiple
- 7.96×
- Total profit
- $555,155
- Equity at exit
- $42,494
- IRR
- —
- Equity multiple
- 16.77×
- Total profit
- $1,258,263
- Equity at exit
- $24,642
Cash invested: $79,800 (down + closing). Projections, not guarantees.
Landlord ↔ Tenant lean methodology
- Overall (STATE)
- 15 Strongly Tenant-Friendly
- State New York
- 15 Strongly Tenant-Friendly · D+10
- County
- — inherits STATE
- City
- — inherits STATE
ZIP-level market 14305
- Home prices YoY
- -10.9%
- Active inventory
- 145
- Price-to-rent
- 19.8×
Monthly cashflow live
- Estimated rent
- $14,384 high interval (Pro) →
- Mortgage (P&I)
- −$1,495
- Tax from tax record
- −$311 /mo · $3,738/yr
- Insurance
- −$119
- HOA
- −$0
- Lot rent
- −$0
- Vacancy / Maint / Mgmt
- −$3,021
- Net cashflow
- $9,439
Break-even live
Sensitivity live
| Price | -10% $9,600 | -5% $9,519 | +0% $9,439 | +5% $9,358 | +10% $9,277 |
|---|---|---|---|---|---|
| Rent | -10% $8,302 | -5% $8,870 | +0% $9,439 | +5% $10,007 | +10% $10,575 |
| Rate | -1.0pp $9,582 | -0.5pp $9,511 | base $9,439 | +0.5pp $9,365 | +1.0pp $9,290 |
12-unit breakdown (identical units grouped — click to expand)
| Units | Beds | Baths | Est. rent |
|---|---|---|---|
| 12× units | 1 | 1 | $14,388 |
| #1 | 1 | 1 | $1,199 |
| #2 | 1 | 1 | $1,199 |
| #3 | 1 | 1 | $1,199 |
| #4 | 1 | 1 | $1,199 |
| #5 | 1 | 1 | $1,199 |
| #6 | 1 | 1 | $1,199 |
| #7 | 1 | 1 | $1,199 |
| #8 | 1 | 1 | $1,199 |
| #9 | 1 | 1 | $1,199 |
| #10 | 1 | 1 | $1,199 |
| #11 | 1 | 1 | $1,199 |
| #12 | 1 | 1 | $1,199 |
| Total (12 units) | $14,384 | ||
UW: 25.0% down · 7.5% · 30yr · 1.5% tax · 5.0% vac · 8.0% maint · 8.0% mgmt
Financing live
Cash to close
- Down payment
- $71,250
- Closing costs
- $8,550
- Reserves months
- —
- Total cash needed
- —
Loan-product check · same deal, 3 products live
Conventional
25% down · 7.5% · 30yr
- Down + closing
- —
- Monthly P&I
- —
- Monthly cashflow
- —
- DSCR
- —
- Eligible?
- —
Personal DTI + credit; lowest rate.
DSCR
20% down · 8.5% · 30yr
- Down + closing
- —
- Monthly P&I
- —
- Monthly cashflow
- —
- DSCR
- —
- Eligible?
- —
No personal income docs; deal must DSCR.
Hard money
10% down · 12.0% · 12mo
- Down + closing
- —
- Monthly P&I
- —
- Monthly cashflow
- —
- DSCR
- —
- Eligible?
- —
Short-term bridge; refi at stabilization.
Listing history 17 events
-
2026-06-22days on market $285,000 Active 40 DOM
-
2026-06-21days on market $285,000 Active 39 DOM
-
2026-06-18days on market $285,000 Active 36 DOM
-
2026-06-17days on market $285,000 Active 35 DOM
-
2026-06-16days on market $285,000 Active 34 DOM
-
2026-06-15days on market $285,000 Active 33 DOM
-
2026-06-13days on market $285,000 Active 31 DOM
-
2026-06-13days on market $285,000 Active 30 DOM
-
2026-06-10days on market $285,000 Active 28 DOM
-
2026-06-09days on market $285,000 Active 27 DOM
-
2026-06-08days on market $285,000 Active 26 DOM
-
2026-06-07days on market $285,000 Active 25 DOM
-
2026-06-03days on market $285,000 Active 21 DOM
-
2026-06-02days on market $285,000 Active 20 DOM
-
2026-06-01days on market $285,000 Active 19 DOM
-
2026-05-31days on market $285,000 Active 18 DOM
-
2026-05-13$285,000 Active 618-char remark
Show marketing remark (618 chars)
Seller (s) will entertain offers between $285,000 and $330,000 or higher. All Brick solid 12-unit apartment building on quiet street in Niagara Falls. 10 out of the 12 units are rented for about $650/month and 2 units need cosmetic repair (about $10k per unit) before HUD will start paying rent again. Lots of room to up the rent to make this a big money maker and the seller is very motivated. One set of mechanics in great condition and updated electrical. National Fuel $700/month. National Grid $1000/month. Water $1000/month. Insurance $900/month. Taxes $3700/year. Come take a look at all the potential this has!
ⓘ Source: listings_history table (triggers on properties + properties_extension) + one-shot
backfill from property_details.listing_events for pre-trigger history.
Tax reassessment forecast NY · Partial reset (capped growth)
- Current annual tax
- $3,738 · $311/mo
- Projected year-2 tax
- $4,277 · $356/mo
- Expected delta
- +$539/yr (+$45/mo · 14.4%)
ⓘ Screening estimate from a state-policy table — verify with the county assessor before closing.
Climate risk First Street
- Flood 1/10 Low FEMA zone X (unshaded) · 0% chance over 30 yrs
- Wildfire 3/10 Moderate
- Heat 2/10 Low 7 d/yr ≥94°F today · 15 d/yr by 30 yrs out
- Wind 1/10 Low
- Air quality 2/10 Low 1 unhealthy d/yr today · 2 by 30 yrs out
Nearby sold comps map
Loading sold comps map…
Walkable amenities ~0.75 mi
Loading nearby amenities…
Taxation est. · year 1
- Rental income
- $172,608
- − Mortgage interest
- −$15,964
- − Property taxes
- −$3,738
- − Insurance
- −$1,425
- − Repairs & maintenance
- −$13,809
- − Management
- −$13,809
- − Depreciation
- −$8,291
- Taxable income
- $115,573
- Est. tax owed @ 24.0%
- −$27,737
- After-tax cash flow
- $85,525/yr
For passive investors: Depreciation is non-cash, so a rental often shows a tax loss while cash-flowing — sheltering income. Rental losses are passive: they offset passive income freely, and up to $25,000/yr can offset ordinary (W-2) income if you actively participate and your MAGI is under $100k (phasing out to $0 by $150k); unused losses carry forward. On sale, claimed depreciation is recaptured at up to 25%, and gains may owe capital-gains tax (a 1031 exchange can defer both). Figures are a year-1 estimate at your 24.0% rate — not tax advice; consult a CPA.
Schools (NCES district)
- District
- Niagara Falls City School District
- NCES district ID
- 3620820
- Math proficiency
- 26% ▼ -10.00%
- Reading proficiency
- 34% ▲ 3.00%
- Median HH income
- $32,488
- Composite
- 24.5/100
- National rank
- #7655
- State rank
- #578 of 590 in NY
Livability — Niagara Falls
- Score
- 60/100
- State rank
- #956
- US rank
- #18749
Category grades
Schools grade is shown separately in the Schools card above.
Census & demographics
- Census place
- Niagara Falls, NY
- County
- Niagara County · 157,377 people
- City population
- 62,983
- Metro
- Buffalo-Cheektowaga, NY
- Population (ZIP)
- 16,696
- Household income
- $51,004
- Rent vs Own
- Severe rent burden
- 1095.0
Population outlook (Niagara County) Hauer SSP2
- Today (2025)
- 204,149 people
- By 2030
- 197,900 · -3.1%
- By 2040
- 182,239 · -10.7%
- By 2050
- 165,198 · -19.1%
- By 2075
- 129,416 · -36.6%
- By 2100
- 96,222 · -52.9%
Race, ethnicity, and origin ACS 2023
- Neighborhood character
- Diverse neighborhood (Simpson 0.63)
- Race & ethnicity
- White 55% Black 24% Two or more races 13% Hispanic / Latino 8% Asian 1% Native American 1%
- Hispanic origin (detail)
- Puerto Rican 4%
- Common ancestry
- Romanian 6% Slovak 2% Lithuanian 2%
- Foreign-born
- 6% · Canada, Jamaica
- Languages at home
- 93% English-only · Spanish 4% Other Indo-European 1%
Political lean MEDSL · Niagara
- 2024 margin
- R (+14.9) · D 42.5% · R 57.5%
- 2008→2024 swing
- -15.9pp toward R · 2008: 1.0pp · 2024: -14.9pp
- All cycles
- 2024: R+14.9 2020: R+9.7 2016: R+19.0 2012: D+0.6 2008: D+1.0
Not yet ingested
- Civics
- —
Market trends
- HPI YoY
- ▼ -43.08%
- Current HPI
- 350.8741
- Rent YoY
- —
- Metro
- Buffalo-Cheektowaga, NY
- State GDP YoY
- ▲ 2.60%
- F500 in state
- 92
Industry mix (Fortune 500 HQ in NY)
| Industry | F500 HQs | Revenue |
|---|---|---|
| Financial Services | 10 | $950B |
|
||
| Consumer Goods | 9 | $162B |
|
||
| Insurance | 4 | $225B |
|
||
| Telecommunications | 2 | $144B |
|
||
| Pharmaceuticals | 2 | $112B |
|
||
| Media / Entertainment | 2 | $69B |
|
||
Price history
1 event — show timeline
- 2026-05-13 Listed $285,000 WNYREIS
Property tax history
+2.8%/yrLatest (2025): $3,738 · -79.1% YoY. Source: county tax records.
Cash-flow waterfall
monthlySold comps — $/sqft
last 12 mo · ≤1 miLoading sold comps…