240 Ranger Dr · Lakeshore Gardens-Hidden Acres, TX
Flood risk 1/10 · Minimal
- FEMA flood zone
- X (unshaded)
- Chance of flooding over 30 yrs
- 0.0%
- Est. flood insurance / yr
- $507 – $1,088
Fire risk 6/10 · Moderate
- Est. fire insurance / yr
- $1,222 – $2,270
Heat risk 9/10 · Severe
- Hot days now (above 111°F)
- 7 days/yr
- Hot days in 30 yrs
- 22 days/yr
Wind risk 9/10 · Severe
- Chance of severe wind over 30 yrs
- 99.0%
Air-quality risk 1/10 · Minimal
- Unhealthy air days now
- 0 days/yr
- Unhealthy air days in 30 yrs
- 0 days/yr
Risk factors via First Street. Map © Google.
Why this score? — see what drove the B- grade
The composite is a weighted blend of 9 inputs, each scored 0–100. Each bar is that input's sub-score; the figure is the points it added to the 100-point composite (weight × sub-score).
- Cash flow +30.0/30.0
- 1% rule +10.0/10.0
- DSCR +10.0/10.0
- ARV discount +7.5/15.0
- Schools +4.8/10.0
- Rent growth +2.5/5.0
- Livability +2.5/5.0
- Condition / age +2.5/5.0
- Appreciation +0.0/10.0
$35,000
🖨 Deal sheet 📄 Offer letter ✓ Due diligence
Listing remarks MLS
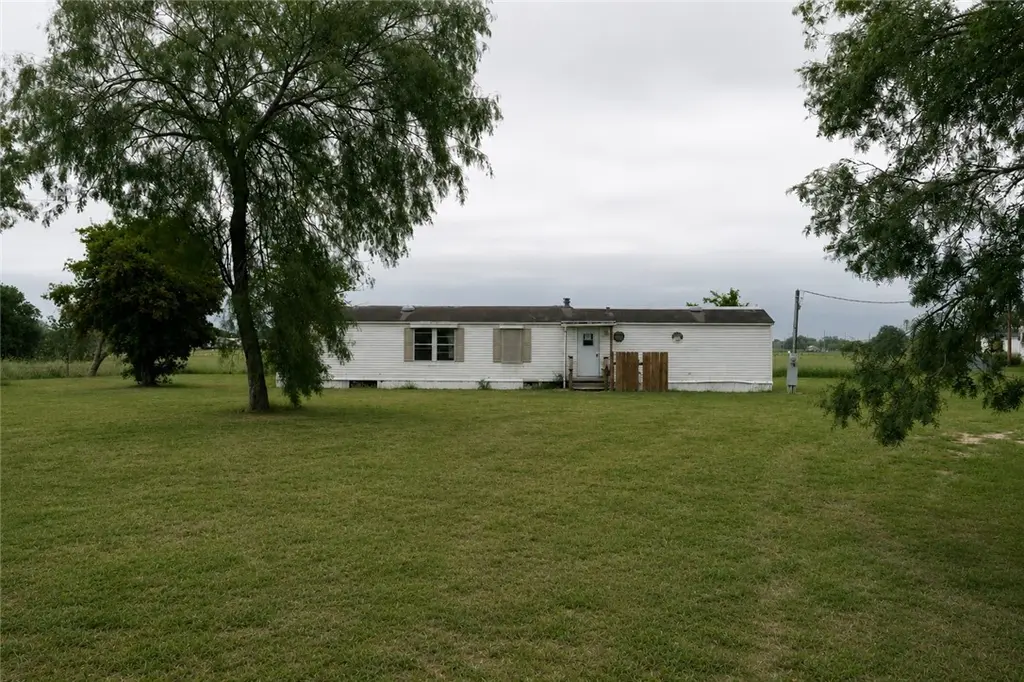
Great single wide on 1 acre tree covered lot in the Arrowhead Subdivision of Lake Corpus Christi. Lots of storage in the oversized storage building for all the toys. Bring the RV 'cause there is a hookup in place. Quiet evenings on the covered back porch will make this a real pleasure. Easy access to Corpus Christi beaches, the San Antonio River walk and Lake Corpus Christi. Just the place for the getaway weekend too.
Key facts
- Water well
- 1 acre lot
- Built 1999
Tags
Property features AI
Finance
- HOA & community: Short-term rentals allowed
Exterior
- Utilities: Well water; Private sewer; Water available; Sewer available
- Home design: Single-story home; Shingle roof; Frame construction; Pillar/post/pier foundation
- Construction: Built with frame construction; Shingle roof; Pillar/post/pier foundation
- Exterior features: Interior lot
Interior
- Flooring: Vinyl
- Bathrooms: 2 full bathrooms
- Interior features: Split bedroom layout; Vinyl flooring
- Laundry & utility: Washer hookup
Neighborhood map
What this means for you Summary
Snapshot
- This is a 2-bed/2.0-bath manufactured listed at $35k.
Deal economics
- At list price, monthly cash flow is $820 ($10k/yr) — positive.
- The deal already cash-flows at list — no discount required.
- Meets the 1% rule at list price ($1k rent vs $35k).
- Recommended offer: $34k (3.0% below list) — sets the bar for market timing.
- Cap rate 34.4% vs local median 3.8% in Lakeshore Gardens-Hidden Acres — top-decile yield for the area; either an underpriced asset or a hidden risk that comps aren't pricing in. Stress-test before assuming the spread holds.
Location & tenants
- Location reads: area grade B — affects rentability + tenant quality, not the cash-flow math above.
- George West ISD (rural): math 55% / reading 59% proficiency, ranked #95 of 826 in TX (top 12%) — acceptable for families but not a draw, mixed tenant base, ~2y average lease.
- Market conditions: 118 active listings in the ZIP; 12 units permitted in Live Oak County in 2024 (0 in 5+ unit buildings).
Forward outlook
- Local home prices are declining (-3.0%/yr); year-one equity from $242 of loan paydown is wiped out by about $1k of value loss. Plan a longer hold.
- Live Oak County population projected at +33% by 2050 — long-run rental-demand tailwind backs the buy-and-hold thesis.
- At projected returns (-3.0% appreciation + 3.0% rent growth), your $10k cash investment doubles in ~2 years — after that, you're playing with house money.
Negotiation context
- It's been on market 42 days — a 3% lower offer ($34k) is reasonable based on typical stale-listing flexibility.
- 5 sale attempts since 14y ago with the ask held roughly flat each time — persistent listings suggest the price (not the market) is what's stuck; bring a comps-based counter.
Risks & watch-outs
- Climate carrying-cost: severe wind risk, 99% chance of damaging wind over 30y; major wildfire risk; extreme-heat days projected 7→22/yr by 2055 (HVAC capex compounding) — expect insurance premiums to compound above CPI over the hold.
Questions for the listing agent
- It's been on market 42 days. Have you received any prior offers? Is the seller open to a 3% concession, seller financing, or rate buy-down credit?
- Is there a deadline driving the sale (1031 exchange, divorce, estate, relocation)? That informs how much negotiation room exists.
- What's the average days-on-market for RENTAL listings here right now (not sales)? A rising rental-DOM trend means longer vacancies and softer asking-rent achievability than the comps imply.
- What's the recent tenant-quality profile in this submarket — average credit score on applications, eviction rate, late-payment / NSF rate, and stable-employment percentage? A property-management company in the area should have these aggregated.
- How much new for-sale + rental construction is in the pipeline within 1–3 miles? Heavy new supply typically softens prices + rents 12–24 months out; constrained supply supports both.
Investment metrics
- 1% rule
- 3.80% ✓
- Cap rate
- 34.42%
- Cash-on-cash
- 100.44%
- DSCR
- 5.47
- GRM
- 2.2
CMA / ARV
No comps found within radius.
Projected returns pro-forma
-3.0% appreciation · 3.0% rent growth · sell at horizon
- IRR
- —
- Equity multiple
- 5.75×
- Total profit
- $46,584
- Equity at exit
- $5,219
- IRR
- —
- Equity multiple
- 12.01×
- Total profit
- $107,887
- Equity at exit
- $3,026
Cash invested: $9,800 (down + closing). Projections, not guarantees.
Landlord ↔ Tenant lean methodology
- Overall (STATE)
- 87 Strongly Landlord-Friendly
- State Texas
- 87 Strongly Landlord-Friendly · R+5
- County
- — inherits STATE
- City
- — inherits STATE
ZIP-level market 78383
- Home prices YoY
- -12.8%
- Active inventory
- 118
- Price-to-rent
- 2.2×
Monthly cashflow live
- Estimated rent
- $1,330 medium interval (Pro) →
- Mortgage (P&I)
- −$184
- Tax from tax record
- −$32 /mo · $389/yr
- Insurance
- −$15
- HOA
- −$0
- Vacancy / Maint / Mgmt
- −$279
- Net cashflow
- $820
Break-even live
UW: 25.0% down · 7.5% · 30yr · 1.5% tax · 5.0% vac · 8.0% maint · 8.0% mgmt
Financing live
Cash to close
- Down payment
- $8,750
- Closing costs
- $1,050
- Reserves months
- —
- Total cash needed
- —
Loan-product check · same deal, 3 products live
Conventional
25% down · 7.5% · 30yr
- Down + closing
- —
- Monthly P&I
- —
- Monthly cashflow
- —
- DSCR
- —
- Eligible?
- —
Personal DTI + credit; lowest rate.
DSCR
20% down · 8.5% · 30yr
- Down + closing
- —
- Monthly P&I
- —
- Monthly cashflow
- —
- DSCR
- —
- Eligible?
- —
No personal income docs; deal must DSCR.
Hard money
10% down · 12.0% · 12mo
- Down + closing
- —
- Monthly P&I
- —
- Monthly cashflow
- —
- DSCR
- —
- Eligible?
- —
Short-term bridge; refi at stabilization.
Listing history 28 events
-
2026-06-19days on market $35,000 Active 42 DOM
-
2026-06-18days on market $35,000 Active 41 DOM
-
2026-06-17days on market $35,000 Active 40 DOM
-
2026-06-16days on market $35,000 Active 39 DOM
-
2026-06-15days on market $35,000 Active 38 DOM
-
2026-06-14days on market $35,000 Active 36 DOM
-
2026-06-12days on market $35,000 Active 35 DOM
-
2026-06-09days on market $35,000 Active 32 DOM
-
2026-06-08days on market $35,000 Active 31 DOM
-
2026-06-07days on market $35,000 Active 30 DOM
-
2026-06-05days on market $35,000 Active 28 DOM
-
2026-06-02days on market $35,000 Active 25 DOM
-
2026-06-01days on market $35,000 Active 24 DOM
-
2026-05-31days on market $35,000 Active 23 DOM
-
2026-05-30days on market $35,000 Active 22 DOM
-
2026-05-07$35,000 Active 429-char remark
-
2025-05-19historical
-
2025-05-05price $34,900
-
2025-04-21price $39,900
-
2025-04-14price $44,900
-
2025-04-08price $49,900
-
2025-03-31$59,900 Active
-
2015-08-05historical
Show marketing remark (421 chars)
Great single wide on 1 acre tree covered lot in the Arrowhead Subdivision of Lake Corpus Christi. Lots of storage in the oversized storage building for all the toys. Bring the RV 'cause there is a hookup in place. Quiet evenings on the covered back porch will make this a real pleasure. Easy access to Corpus Christi beaches, the San Antonio River walk and Lake Corpus Christi. Just the place for the getaway weekend too.
-
2015-08-05soldstatus Closed
Show marketing remark (421 chars)
Great single wide on 1 acre tree covered lot in the Arrowhead Subdivision of Lake Corpus Christi. Lots of storage in the oversized storage building for all the toys. Bring the RV 'cause there is a hookup in place. Quiet evenings on the covered back porch will make this a real pleasure. Easy access to Corpus Christi beaches, the San Antonio River walk and Lake Corpus Christi. Just the place for the getaway weekend too.
-
2015-03-01$62,500
Show marketing remark (421 chars)
Great single wide on 1 acre tree covered lot in the Arrowhead Subdivision of Lake Corpus Christi. Lots of storage in the oversized storage building for all the toys. Bring the RV 'cause there is a hookup in place. Quiet evenings on the covered back porch will make this a real pleasure. Easy access to Corpus Christi beaches, the San Antonio River walk and Lake Corpus Christi. Just the place for the getaway weekend too.
-
2013-06-28$65,000
-
2012-09-20$78,500
-
2006-10-26soldstatus
ⓘ Source: listings_history table (triggers on properties + properties_extension) + one-shot
backfill from property_details.listing_events for pre-trigger history.
Tax reassessment forecast TX · Resets to sale price
- Current annual tax
- $389 · $32/mo
- Projected year-2 tax
- $640 · $53/mo
- Expected delta
- +$252/yr (+$21/mo · 64.8%)
ⓘ Screening estimate from a state-policy table — verify with the county assessor before closing.
Climate risk First Street
- Flood 1/10 Low FEMA zone X (unshaded) · 0% chance over 30 yrs
- Wildfire 6/10 Major
- Heat 9/10 Extreme 7 d/yr ≥111°F today · 22 d/yr by 30 yrs out
- Wind 9/10 Extreme 99% chance of damaging wind over 30 yrs
- Air quality 1/10 Low 0 unhealthy d/yr today · 0 by 30 yrs out
Nearby sold comps map
Loading sold comps map…
Walkable amenities ~0.75 mi
Loading nearby amenities…
Taxation est. · year 1
- Rental income
- $15,961
- − Mortgage interest
- −$1,961
- − Property taxes
- −$389
- − Insurance
- −$175
- − Repairs & maintenance
- −$1,277
- − Management
- −$1,277
- − Depreciation
- −$1,018
- Taxable income
- $9,865
- Est. tax owed @ 24.0%
- −$2,368
- After-tax cash flow
- $7,475/yr
For passive investors: Depreciation is non-cash, so a rental often shows a tax loss while cash-flowing — sheltering income. Rental losses are passive: they offset passive income freely, and up to $25,000/yr can offset ordinary (W-2) income if you actively participate and your MAGI is under $100k (phasing out to $0 by $150k); unused losses carry forward. On sale, claimed depreciation is recaptured at up to 25%, and gains may owe capital-gains tax (a 1031 exchange can defer both). Figures are a year-1 estimate at your 24.0% rate — not tax advice; consult a CPA.
Schools (NCES district)
- District
- George West ISD
- NCES district ID
- 4820550
- Math proficiency
- 55% ▼ -7.00%
- Reading proficiency
- 59% ▲ 2.00%
- Median HH income
- $45,721
- Composite
- 48.17/100
- National rank
- #2175
- State rank
- #95 of 826 in TX
Livability — Lakeshore Gardens-Hidden Acres
No livability data for this city. (Only ~50 U.S. cities are tracked.)
Census & demographics
- Population (ZIP)
- 4,306
Population outlook (Live Oak County) Hauer SSP2
- Today (2025)
- 13,886 people
- By 2030
- 14,793 · +6.5%
- By 2040
- 16,633 · +19.8%
- By 2050
- 18,511 · +33.3%
- By 2075
- 23,859 · +71.8%
- By 2100
- 26,396 · +90.1%
Race, ethnicity, and origin ACS 2023
- Neighborhood character
- Diverse neighborhood (Simpson 0.57)
- Race & ethnicity
- White 51% Hispanic / Latino 40% Two or more races 17% Black 4% Pacific Islander 1%
- Hispanic origin (detail)
- Mexican 29%
- Common ancestry
- Lithuanian 3% Romanian 3% Italian 1%
- Foreign-born
- 5% · Canada
- Languages at home
- 80% English-only · Spanish 19% Other Asian/Pacific 1%
Political lean MEDSL · Live Oak
- 2024 margin
- Solid R (+69.6) · D 14.9% · R 84.6%
- 2008→2024 swing
- -20.6pp toward R · 2008: -49.0pp · 2024: -69.6pp
- All cycles
- 2024: R+69.6 2020: R+66.9 2016: R+63.5 2012: R+54.5 2008: R+49.0
Not yet ingested
- Civics
- —
Market trends
- HPI YoY
- ▼ -26.06%
- Current HPI
- 178.3727
- Rent YoY
- —
- Metro
- —
- State GDP YoY
- ▲ 3.95%
- F500 in state
- 110
Industry mix (Fortune 500 HQ in TX)
| Industry | F500 HQs | Revenue |
|---|---|---|
| Energy | 16 | $1,198B |
|
||
| Technology | 5 | $198B |
|
||
| Engineering / Construction | 4 | $72B |
|
||
| Energy Services | 3 | $60B |
|
||
| Utilities | 3 | $41B |
|
||
| Healthcare | 2 | $330B |
|
||
Price history
-55.4% since first listed13 events — show timeline
- 2026-05-07 Listed $35,000 CBMLS
- 2025-05-19 Listing Removed — HARMLS
- 2025-05-05 Price Changed $34,900 HARMLS
- 2025-04-21 Price Changed $39,900 HARMLS
- 2025-04-14 Price Changed $44,900 HARMLS
- 2025-04-08 Price Changed $49,900 HARMLS
- 2025-03-31 Listed $59,900 HARMLS
- 2015-08-05 Delisted — CBMLS
- 2015-08-05 Sold (MLS) — CBMLS
- 2015-03-01 Listed $62,500 CBMLS
- 2013-06-28 Listed $65,000 CBMLS
- 2012-09-20 Listed $78,500 CBMLS
- 2006-10-26 Sold (Public Records) — Public Records
Property tax history
+0.1%/yrLatest (2025): $389 · +12.1% YoY. Source: county tax records.
Cash-flow waterfall
monthlySold comps — $/sqft
last 12 mo · ≤1 miLoading sold comps…