 Multi-family
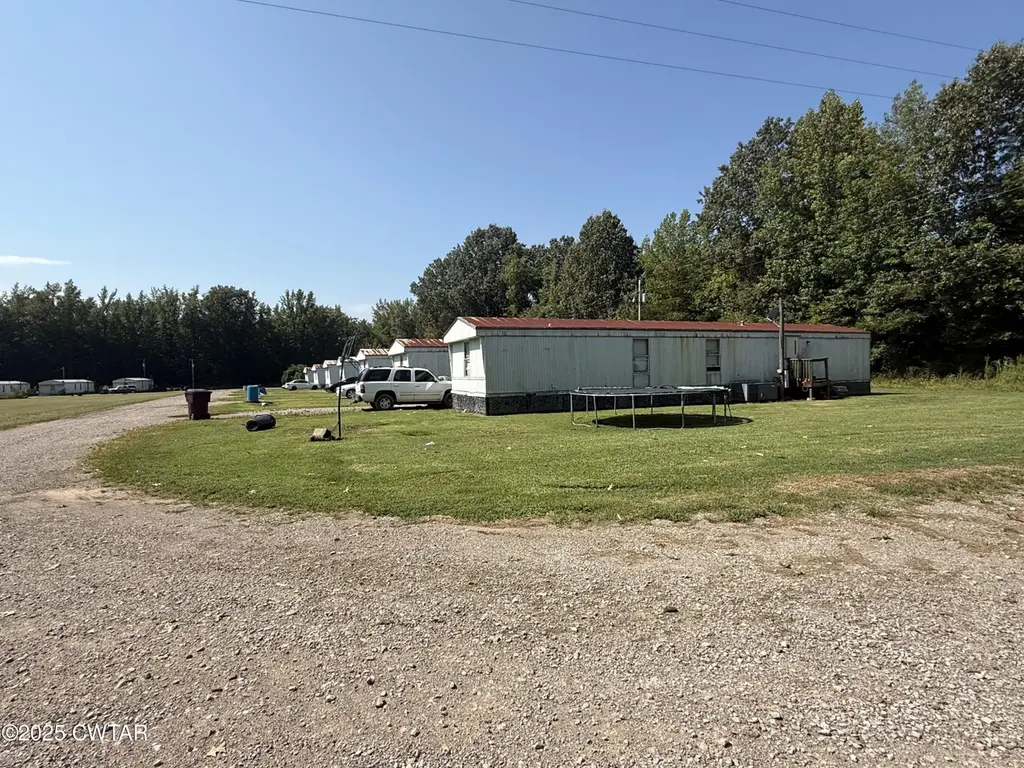
0 Skylar Way -kirk Loop · Middleton, TN
Flood risk 8/10 · Major
- FEMA flood zone
- X (unshaded)
- Chance of flooding over 30 yrs
- 0.99%
- Est. flood insurance / yr
- $507 – $1,088
Fire risk 4/10 · Minor
- Est. fire insurance / yr
- $949 – $1,763
Heat risk 6/10 · Moderate
- Hot days now (above 110°F)
- 7 days/yr
- Hot days in 30 yrs
- 20 days/yr
Wind risk 4/10 · Minor
- Chance of severe wind over 30 yrs
- 19.0%
Air-quality risk 1/10 · Minimal
- Unhealthy air days now
- 0 days/yr
- Unhealthy air days in 30 yrs
- 0 days/yr
Risk factors via First Street. Map © Google.
Why this score? — see what drove the B+ grade
The composite is a weighted blend of 9 inputs, each scored 0–100. Each bar is that input's sub-score; the figure is the points it added to the 100-point composite (weight × sub-score).
- Cash flow +30.0/30.0
- 1% rule +10.0/10.0
- DSCR +10.0/10.0
- Appreciation +9.5/10.0
- ARV discount +7.5/15.0
- Livability +3.1/5.0
- Rent growth +2.5/5.0
- Condition / age +2.2/5.0
- Schools +1.1/10.0
$750,000
🖨 Deal sheet 📄 Offer letter ✓ Due diligence
Multi-family units
County records classify this as Multi-Family (2-4 Unit). Listing-text estimate: 1 unit. estimate disagrees with records
Listing remarks MLS
Increase your rental inventory!!! Unusual opportunity!!! Mobile home park, long established, with 15 units plus ADDITIONAL 3 ACRES INCLUDED IN SALES PRICE already zoned for mobile home park designation. Middleton draws tenants from Bolivar, Whiteville, and surrounding areas. Give me a call at 731 467 1133 for more information and/or to set up a viewing. Sales price includes 3 additional acres already zoned for mobile home parks
Key facts
- 15 units
- 3 acres included
- 8.43 acre lot
Tags
Neighborhood map
What this means for you Summary
Snapshot
- This is a multifamily listed at $750k. Condition is rated fair.
Deal economics
- At list price, monthly cash flow is $5k ($56k/yr) — positive.
- The deal already cash-flows at list — no discount required.
- Meets the 1% rule at list price ($13k rent vs $750k).
- Recommended offer: $660k (12.0% below list) — sets the bar for market timing.
Location & tenants
- Location reads 61/100 on livability (#247 in TN) — a middle-class / working-renter tenant base. Strengths: cost of living A+, housing A; Watch: health & safety C-, schools F, crime F.
- Hardeman County Schools (rural): math 11% / reading 16% proficiency, ranked #133 of 139 in TN (top 96%) — low school quality limits family demand, transient renter base, plan for 1-2y turnover; 73% free/reduced lunch — lower-income household profile, screen leases tightly.
- Market conditions: 40 active listings in the ZIP; 43 units permitted in Hardeman County in 2024 (0 in 5+ unit buildings).
Forward outlook
- In year one you build about $73k of equity ($5k loan paydown + $68k appreciation (9.1% local appreciation)).
- Hardeman County population projected at -25% by 2050 — secular population decline; favor cash flow + early exit over multi-decade hold.
- At projected returns (9.1% appreciation + 3.0% rent growth), your $210k cash investment doubles in ~2 years — after that, you're playing with house money.
- By year 2, paydown + projected appreciation supports a ~$117k cash-out refi (75% LTV) — recoverable capital for the next deal without selling this one.
Negotiation context
- It's been on market 300 days — a 12% lower offer ($660k) is reasonable based on typical stale-listing flexibility.
Risks & watch-outs
- Watch-outs: flood insurance adds $66/mo.
- Climate carrying-cost: severe flood risk; extreme-heat days projected 7→20/yr by 2055 (HVAC capex compounding) — expect insurance premiums to compound above CPI over the hold.
Questions for the listing agent
- It's been on market 300 days. Have you received any prior offers? Is the seller open to a 12% concession, seller financing, or rate buy-down credit?
- Have any recent inspections been done? Can we get a copy of the seller's disclosures and any deferred-maintenance estimates?
- What's the actual annual flood-insurance premium (NFIP or private), and is the property in a SFHA with mandatory coverage?
- Why hasn't it sold? Are there any deal-killer items the seller is aware of (foundation, flood, title, zoning, code violations)?
- Is there a deadline driving the sale (1031 exchange, divorce, estate, relocation)? That informs how much negotiation room exists.
- Schools are F-rated, which usually means shorter tenancies and higher turnover. Who's the typical renter profile here, and what's been the actual vacancy rate?
- Crime grade is F in this area — have there been break-ins, vandalism, or insurance claims at this property in the last 3 years? What carrier currently insures it and at what premium?
- What's the average days-on-market for RENTAL listings here right now (not sales)? A rising rental-DOM trend means longer vacancies and softer asking-rent achievability than the comps imply.
- What's the recent tenant-quality profile in this submarket — average credit score on applications, eviction rate, late-payment / NSF rate, and stable-employment percentage? A property-management company in the area should have these aggregated.
- How much new apartment / multifamily construction is in the pipeline within 1–3 miles? Heavy new supply (>2% of stock underway) typically softens rents 12–24 months out; light construction supports rent growth.
Investment metrics
- 1% rule
- 1.67% ✓
- Cap rate
- 13.85%
- Cash-on-cash
- 27.00%
- DSCR
- 2.20
- GRM
- 5.0
CMA / ARV
No comps found within radius.
Projected returns pro-forma
9.05% appreciation · 3.0% rent growth · sell at horizon
- IRR
- 42.9%
- Equity multiple
- 4.13×
- Total profit
- $657,256
- Equity at exit
- $624,484
- IRR
- 37.7%
- Equity multiple
- 9.06×
- Total profit
- $1,692,673
- Equity at exit
- $1,295,740
Cash invested: $210,000 (down + closing). Projections, not guarantees.
Landlord ↔ Tenant lean methodology
- Overall (STATE)
- 87 Strongly Landlord-Friendly
- State Tennessee
- 87 Strongly Landlord-Friendly · R+13
- County
- — inherits STATE
- City
- — inherits STATE
ZIP-level market 38052
- Home prices YoY
- 2.7%
- Active inventory
- 40
- Price-to-rent
- 74.8×
Monthly cashflow live
- Estimated rent
- $12,541 medium interval (Pro) →
- Mortgage (P&I)
- −$3,933
- Tax est. 1.5%
- −$938 /mo · $11,250/yr
- Insurance
- −$312
- Flood insurance flood zone
- −$66 /mo · $798/yr
- HOA
- −$0
- Vacancy / Maint / Mgmt
- −$2,634
- Net cashflow
- $4,658
Break-even live
15-unit breakdown (identical units grouped — click to expand)
| Units | Beds | Baths | Est. rent |
|---|---|---|---|
| 15× units | 2 | 1 | $12,540 |
| #1 | 2 | 1 | $836 |
| #2 | 2 | 1 | $836 |
| #3 | 2 | 1 | $836 |
| #4 | 2 | 1 | $836 |
| #5 | 2 | 1 | $836 |
| #6 | 2 | 1 | $836 |
| #7 | 2 | 1 | $836 |
| #8 | 2 | 1 | $836 |
| #9 | 2 | 1 | $836 |
| #10 | 2 | 1 | $836 |
| #11 | 2 | 1 | $836 |
| #12 | 2 | 1 | $836 |
| #13 | 2 | 1 | $836 |
| #14 | 2 | 1 | $836 |
| #15 | 2 | 1 | $836 |
| Total (15 units) | $12,541 | ||
UW: 25.0% down · 7.5% · 30yr · 1.5% tax · 5.0% vac · 8.0% maint · 8.0% mgmt
Financing live
Cash to close
- Down payment
- $187,500
- Closing costs
- $22,500
- Reserves months
- —
- Total cash needed
- —
Loan-product check · same deal, 3 products live
Conventional
25% down · 7.5% · 30yr
- Down + closing
- —
- Monthly P&I
- —
- Monthly cashflow
- —
- DSCR
- —
- Eligible?
- —
Personal DTI + credit; lowest rate.
DSCR
20% down · 8.5% · 30yr
- Down + closing
- —
- Monthly P&I
- —
- Monthly cashflow
- —
- DSCR
- —
- Eligible?
- —
No personal income docs; deal must DSCR.
Hard money
10% down · 12.0% · 12mo
- Down + closing
- —
- Monthly P&I
- —
- Monthly cashflow
- —
- DSCR
- —
- Eligible?
- —
Short-term bridge; refi at stabilization.
Listing history 14 events
-
2026-06-18days on market $750,000 Active 300 DOM
-
2026-06-17days on market $750,000 Active 299 DOM
-
2026-06-16days on market $750,000 Active 298 DOM
-
2026-06-15days on market $750,000 Active 297 DOM
-
2026-06-13days on market $750,000 Active 295 DOM
-
2026-06-12days on market $750,000 Active 294 DOM
-
2026-06-09days on market $750,000 Active 291 DOM
-
2026-06-08days on market $750,000 Active 290 DOM
-
2026-06-08days on market $750,000 Active 289 DOM
-
2026-06-03days on market $750,000 Active 285 DOM
-
2026-06-02days on market $750,000 Active 284 DOM
-
2026-06-01days on market $750,000 Active 283 DOM
-
2026-05-31days on market $750,000 Active 282 DOM
-
2025-08-22$750,000 Active 433-char remark
Show marketing remark (433 chars)
Increase your rental inventory!!! Unusual opportunity!!! Mobile home park, long established, with 15 units plus ADDITIONAL 3 ACRES INCLUDED IN SALES PRICE already zoned for mobile home park designation. Middleton draws tenants from Bolivar, Whiteville, and surrounding areas. Give me a call at 731 467 1133 for more information and/or to set up a viewing. Sales price includes 3 additional acres already zoned for mobile home parks
ⓘ Source: listings_history table (triggers on properties + properties_extension) + one-shot
backfill from property_details.listing_events for pre-trigger history.
Climate risk First Street
- Flood 8/10 Severe FEMA zone X (unshaded) · 99% chance over 30 yrs
- Wildfire 4/10 Moderate
- Heat 6/10 Major 7 d/yr ≥110°F today · 20 d/yr by 30 yrs out
- Wind 4/10 Moderate 19% chance of damaging wind over 30 yrs
- Air quality 1/10 Low 0 unhealthy d/yr today · 0 by 30 yrs out
Nearby sold comps map
Loading sold comps map…
Walkable amenities ~0.75 mi
Loading nearby amenities…
Taxation est. · year 1
- Rental income
- $150,492
- − Mortgage interest
- −$42,012
- − Property taxes
- −$11,250
- − Insurance
- −$4,548
- − Repairs & maintenance
- −$12,039
- − Management
- −$12,039
- − Depreciation
- −$21,818
- Taxable income
- $46,786
- Est. tax owed @ 24.0%
- −$11,229
- After-tax cash flow
- $44,666/yr
For passive investors: Depreciation is non-cash, so a rental often shows a tax loss while cash-flowing — sheltering income. Rental losses are passive: they offset passive income freely, and up to $25,000/yr can offset ordinary (W-2) income if you actively participate and your MAGI is under $100k (phasing out to $0 by $150k); unused losses carry forward. On sale, claimed depreciation is recaptured at up to 25%, and gains may owe capital-gains tax (a 1031 exchange can defer both). Figures are a year-1 estimate at your 24.0% rate — not tax advice; consult a CPA.
Condition & rehab AI · 11 photos
This mobile home park requires significant repairs and maintenance to improve its condition and value. Potential buyers should be aware of the extensive work needed.
Repairs flagged
- Major exterior paint — Peeling paint indicates significant wear
- Major roof — Aged roof may need replacement
- Major HVAC units — No visible units, likely in need of repair
Value-add opportunities
- Both paint exterior — Fresh paint would improve curb appeal and home value
- Both replace roof — A new roof would significantly increase the home's value
- Both repair HVAC — Functional HVAC would improve comfort and energy efficiency
Renovation cost estimate screening
| Repair item | Severity | Est. cost |
|---|---|---|
| exterior paint · Peeling paint indicates significant wear | Major | $15,000–50,000 |
| roof · Aged roof may need replacement | Major | $15,000–50,000 |
| HVAC units · No visible units, likely in need of repair | Major | $15,000–50,000 |
| Total estimated repair cost · 3 items | $45,000–150,000 |
Value-add ROI direction
- Both paint exterior — Fresh paint would improve curb appeal and home value ↑
- Both replace roof — A new roof would significantly increase the home's value ↑
- Both repair HVAC — Functional HVAC would improve comfort and energy efficiency ↑
ⓘ Cost ranges are severity-bucket heuristics (US national rule-of-thumb). Get contractor quotes + a written scope before underwriting a rehab budget.
Schools (NCES district)
- District
- Hardeman County Schools
- NCES district ID
- 4701650
- Math proficiency
- 11% ▼ -11.00%
- Reading proficiency
- 16% ▼ -6.00%
- Median HH income
- $33,190
- Composite
- 10.9/100
- National rank
- #9754
- State rank
- #133 of 139 in TN
Livability — Middleton
- Score
- 61/100
- State rank
- #247
- US rank
- #17650
Category grades
Schools grade is shown separately in the Schools card above.
Census & demographics
- Census place
- Middleton, TN
- Population (ZIP)
- 3,566
Population outlook (Hardeman County) Hauer SSP2
- Today (2025)
- 23,629 people
- By 2030
- 22,413 · -5.1%
- By 2040
- 19,910 · -15.7%
- By 2050
- 17,692 · -25.1%
- By 2075
- 13,532 · -42.7%
- By 2100
- 10,178 · -56.9%
Race, ethnicity, and origin ACS 2023
- Neighborhood character
- Predominantly White (86%)
- Race & ethnicity
- White 86% Black 9% Asian 2% Hispanic / Latino 1% Two or more races 1%
- Common ancestry
- Lithuanian 2% Italian 2% Iranian 1%
- Foreign-born
- 4% · Canada
- Languages at home
- 96% English-only · Other Asian/Pacific 2% Spanish 1% German/W. Germanic 1%
Political lean MEDSL · Hardeman
- 2024 margin
- Strong R (+24.1) · D 37.5% · R 61.6%
- 2008→2024 swing
- -30.3pp toward R · 2008: 6.2pp · 2024: -24.1pp
- All cycles
- 2024: R+24.1 2020: R+15.7 2016: R+8.0 2012: D+5.9 2008: D+6.2
Not yet ingested
- Civics
- —
Market trends
- HPI YoY
- ▲ 9.05%
- Current HPI
- 346.8825
- Rent YoY
- —
- Metro
- —
- State GDP YoY
- ▲ 2.78%
- F500 in state
- 22
Industry mix (Fortune 500 HQ in TN)
| Industry | F500 HQs | Revenue |
|---|---|---|
| Healthcare | 3 | $91B |
|
||
| Retail | 3 | $72B |
|
||
| Transportation / Logistics | 1 | $88B |
|
||
| Paper / Packaging | 1 | $19B |
|
||
| Insurance | 1 | $13B |
|
||
| Energy | 1 | $12B |
|
||
Price history
1 event — show timeline
- 2025-08-22 Listed $750,000 CWTAR
Cash-flow waterfall
monthlySold comps — $/sqft
last 12 mo · ≤1 miLoading sold comps…