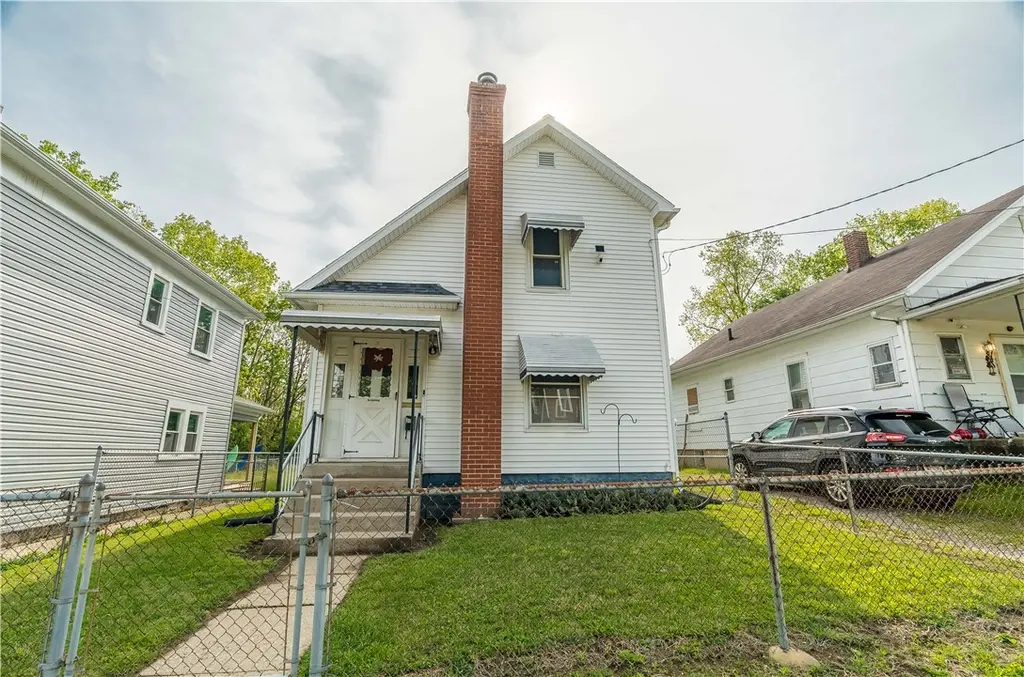
316 S Wilkinson Ave · Sidney, OH
Flood risk 1/10 · Minimal
- FEMA flood zone
- X (unshaded)
- Chance of flooding over 30 yrs
- 0.0%
- Est. flood insurance / yr
- $473 – $860
Fire risk 1/10 · Minimal
- Est. fire insurance / yr
- $713 – $1,323
Heat risk 3/10 · Minor
- Hot days now (above 100°F)
- 7 days/yr
- Hot days in 30 yrs
- 18 days/yr
Wind risk 2/10 · Minimal
- Chance of severe wind over 30 yrs
- —
Air-quality risk 2/10 · Minimal
- Unhealthy air days now
- 1 days/yr
- Unhealthy air days in 30 yrs
- 2 days/yr
Risk factors via First Street. Map © Google.
Why this score? — see what drove the C+ grade
The composite is a weighted blend of 9 inputs, each scored 0–100. Each bar is that input's sub-score; the figure is the points it added to the 100-point composite (weight × sub-score).
- Cash flow +23.2/30.0
- ARV discount +15.0/15.0
- DSCR +7.5/10.0
- 1% rule +5.4/10.0
- Schools +4.2/10.0
- Livability +3.8/5.0
- Rent growth +2.5/5.0
- Condition / age +2.5/5.0
- Appreciation +0.0/10.0
$106,900
🖨 Deal sheet 📄 Offer letter ✓ Due diligence
Listing remarks MLS
Opportunity awaits with this 3-bedroom, 2-bath home offering tons of potential for the right buyer! Featuring a fenced-in yard, this property is perfect for creating your own private outdoor retreat. Inside, you'll find a welcoming entry room--ideal for relaxing with your morning coffee or unwinding at the end of the day. This home does need some TLC, but it's a fantastic chance to build instant equity and customize the space to your style and needs. Whether you're an investor or a homeowner looking to put in a little work, the possibilities here are endless. Conveniently located near downtown, West Town shopping, and local schools, you'll enjoy easy access to everything you need while still having a place to make your own. Don't miss this value-packed opportunity!
Key facts
- Entry room
- Fenced-in yard
- 5,200 sq ft lot
Tags
Property features AI
Finance
- Financial info: Offered for sale
Exterior
- Parking: No garage
- Utilities: Has heating
- Home design: Two-story frame home with vinyl siding; Residential zoning
- Construction: Frame construction; Vinyl siding
- Exterior features: Fenced yard
Interior
- Kitchen: Main-level kitchen (10 x 8)
- Bedrooms: Second-floor bedrooms: three bedrooms (12 x 10, 12 x 10, 14 x 14)
- Bathrooms: Two full bathrooms; One main-level bathroom
- Heating & cooling: Forced-air heating
- Interior features: 7 total rooms; Unfinished basement
Neighborhood map
What this means for you Summary
Snapshot
- This is a 3-bed/2.0-bath single-family listed at $107k.
Deal economics
- At list price, monthly cash flow is $194 ($2k/yr) — positive.
- The deal already cash-flows at list — no discount required.
- Meets the 1% rule at list price ($1k rent vs $107k).
- Recommended offer: $104k (3.0% below list) — sets the bar for market timing.
- Cap rate 8.5% vs local median 4.1% in Sidney — top-decile yield for the area; either an underpriced asset or a hidden risk that comps aren't pricing in. Stress-test before assuming the spread holds.
Location & tenants
- Location reads 76/100 on livability (#220 in OH, #3,412 nationally) — a middle-class / working-renter tenant base. Strengths: cost of living A+, housing A+, health & safety A+; Watch: crime C-, employment C-, amenities D.
- Sidney City (town): math 46% / reading 52% proficiency, ranked #454 of 656 in OH (top 69%) — families likely to look elsewhere, expect single-tenant / working-renter base with shorter leases.
- Market conditions: 145 active listings in the ZIP; 10 comparable units currently listed for rent nearby; rentals leasing fast (median 3d on market — plan ~1-2 weeks tenant-placement turnaround); 337 units permitted in Shelby County in 2024 (216 in 5+ unit buildings).
Forward outlook
- Local home prices are declining (-3.0%/yr); year-one equity from $739 of loan paydown is wiped out by about $3k of value loss. Plan a longer hold.
- Shelby County population projected at -18% by 2050 — secular population decline; favor cash flow + early exit over multi-decade hold.
Negotiation context
- It's been on market 44 days — a 3% lower offer ($104k) is reasonable based on typical stale-listing flexibility.
- 4 sale attempts since 19y ago with the ask held roughly flat each time — persistent listings suggest the price (not the market) is what's stuck; bring a comps-based counter.
- Current owner paid $52k; list at $107k implies a 106% gain — meaningful room to come down on a strong offer.
Risks & watch-outs
- Watch-outs: built in 1900 — expect roof / HVAC / electrical / plumbing capex.
Questions for the listing agent
- It's been on market 44 days. Have you received any prior offers? Is the seller open to a 3% concession, seller financing, or rate buy-down credit?
- Built in 1900 — when were the roof, HVAC, electrical panel, plumbing, and water heater last replaced?
- Is there a deadline driving the sale (1031 exchange, divorce, estate, relocation)? That informs how much negotiation room exists.
- What's the average days-on-market for RENTAL listings here right now (not sales)? A rising rental-DOM trend means longer vacancies and softer asking-rent achievability than the comps imply.
- What's the recent tenant-quality profile in this submarket — average credit score on applications, eviction rate, late-payment / NSF rate, and stable-employment percentage? A property-management company in the area should have these aggregated.
- How much new for-sale + rental construction is in the pipeline within 1–3 miles? Heavy new supply typically softens prices + rents 12–24 months out; constrained supply supports both.
Investment metrics
- 1% rule
- 1.04% ✓
- Cap rate
- 8.47%
- Cash-on-cash
- 7.77%
- DSCR
- 1.35
- GRM
- 8.0
CMA / ARV
- ARV (median comp)
- $138,041
- List price
- $106,900
- Delta
- -22.56%
- Verdict
- UNDERPRICED
- Comps
- 20 within 1.0 mi
Show comp detail 12 sales within ~0.75 mi
| Address | Dist | Beds/Ba | Sqft | Sold | Price | $/sf | Match |
|---|---|---|---|---|---|---|---|
| 230 N Pomeroy Ave | 0.34mi | 3/1.0 | 1,188 (+1%) | 2mo | $148,000 | $125 | 78 |
| 1116 Taft St | 0.52mi | 3/1.5 | 1,259 (+7%) | 2mo | $218,000 | $173 | 60 |
| 830 Chestnut Ave | 0.47mi | 2/1.0 (-1) | 1,204 (+2%) | 8mo | $195,400 | $162 | 58 |
| 604 2nd Ave | 0.73mi | 3/1.5 | 1,184 (+0%) | 6mo | $139,000 | $117 | 58 |
| 614 Michigan St | 0.40mi | 4/2.0 (+1) | 1,305 (+11%) | 4mo | $185,000 | $142 | 55 |
| 104 S Pomeroy Ave | 0.19mi | 3/1.0 | 1,344 (+14%) | 11mo | $176,000 | $131 | 55 |
| 209 Pike St | 0.65mi | 2/1.0 (-1) | 1,120 (-5%) | 5mo | $105,000 | $94 | 48 |
| 413 E Poplar St | 0.61mi | 3/1.0 | 1,283 (+9%) | 5mo | $130,000 | $101 | 48 |
| 518 W North St | 0.28mi | 2/1.5 (-1) | 1,349 (+14%) | 10mo | $98,000 | $73 | 48 |
| 305 Monroe St | 0.75mi | 3/1.0 | 1,130 (-4%) | 9mo | $69,600 | $62 | 47 |
| 624 St Marys Ave | 0.62mi | 3/1.5 | 1,326 (+13%) | 7mo | $180,000 | $136 | 42 |
| 912 Evergreen Dr | 0.73mi | 2/1.0 (-1) | 1,348 (+14%) | 8mo | $138,000 | $102 | 26 |
Match score weights: distance 35% · size 25% · config 20% · recency 20%. Top-matched comps best support the ARV.
Projected returns pro-forma
-3.0% appreciation · 3.0% rent growth · sell at horizon
- IRR
- -4.5%
- Equity multiple
- 0.83×
- Total profit
- $-4,990
- Equity at exit
- $15,939
- IRR
- 5.2%
- Equity multiple
- 1.38×
- Total profit
- $11,488
- Equity at exit
- $9,243
Cash invested: $29,932 (down + closing). Projections, not guarantees.
Landlord ↔ Tenant lean methodology
- Overall (STATE)
- 73 Landlord-Friendly
- State Ohio
- 73 Landlord-Friendly · R+6
- County
- — inherits STATE
- City
- — inherits STATE
ZIP-level market 45365
- Home prices YoY
- -20.1%
- Active inventory
- 145
- Price-to-rent
- 8.0×
Monthly cashflow live
- Estimated rent
- $1,110 high interval (Pro) →
- Mortgage (P&I)
- −$561
- Tax from tax record
- −$78 /mo · $937/yr
- Insurance
- −$45
- HOA
- −$0
- Vacancy / Maint / Mgmt
- −$233
- Net cashflow
- $194
Break-even live
UW: 25.0% down · 7.5% · 30yr · 1.5% tax · 5.0% vac · 8.0% maint · 8.0% mgmt
Financing live
Cash to close
- Down payment
- $26,725
- Closing costs
- $3,207
- Reserves months
- —
- Total cash needed
- —
Loan-product check · same deal, 3 products live
Conventional
25% down · 7.5% · 30yr
- Down + closing
- —
- Monthly P&I
- —
- Monthly cashflow
- —
- DSCR
- —
- Eligible?
- —
Personal DTI + credit; lowest rate.
DSCR
20% down · 8.5% · 30yr
- Down + closing
- —
- Monthly P&I
- —
- Monthly cashflow
- —
- DSCR
- —
- Eligible?
- —
No personal income docs; deal must DSCR.
Hard money
10% down · 12.0% · 12mo
- Down + closing
- —
- Monthly P&I
- —
- Monthly cashflow
- —
- DSCR
- —
- Eligible?
- —
Short-term bridge; refi at stabilization.
Rent comps 10 comps
| Address | Beds | Baths | Sqft | Rent | $/sqft | DOM | Units | Dist |
|---|---|---|---|---|---|---|---|---|
| 121 W Poplar St Sidney, OH | 2.0 | 1.0 | 612 | $1,125 | $1.84 | 2d | 3 | 0.29mi |
| 751 Campbell Rd Sidney, OH | 2.0 | 1.0 | 980 | $1,100 | $1.12 | 2d | 1 | 0.38mi |
| 314 Thompson St Sidney, OH | 3.0 | 1.0 | 1352 | $1,200 | $0.89 | 2d | 1 | 0.51mi |
| 803 S Main Ave Sidney, OH | 2.0 | 1.0 | 1104 | $1,030 | $0.93 | 2d | 1 | 0.52mi |
| 803 S Main Ave Sidney, OH | 2.0 | 1.0 | 1104 | $1,100 | $1.00 | 43d | 1 | 0.52mi |
| 805 S Main Ave Sidney, OH | 3.0 | 1.0 | 1423 | $1,400 | $0.98 | 21d | 1 | 0.52mi |
| 560 N Wagner Ave Sidney, OH | 2.0 | 1.0 | 729 | $975 | $1.34 | 2d | 1 | 0.66mi |
| 600 N Wagner Ave Sidney, OH | 2.0 | 1.0 | 729 | $975 | $1.34 | 14d | 1 | 0.68mi |
| 612 N Wagner Ave Sidney, OH | 2.0 | 1.0 | 700 | $975 | $1.39 | 19d | 1 | 0.70mi |
| 776 Country Side Ln Sidney, OH | 3.0 | 1.0 | 1001 | $994 | $0.99 | 2d | 1 | 1.11mi |
Listing history 23 events
-
2026-06-18days on market $106,900 Active 44 DOM
-
2026-06-17days on market $106,900 Active 43 DOM
-
2026-06-16days on market $106,900 Active 42 DOM
-
2026-06-15days on market $106,900 Active 41 DOM
-
2026-06-14days on market $106,900 Active 39 DOM
-
2026-06-13days on market $106,900 Active 38 DOM
-
2026-06-10days on market $106,900 Active 36 DOM
-
2026-06-09days on market $106,900 Active 35 DOM
-
2026-06-08days on market $106,900 Active 34 DOM
-
2026-06-07days on market $106,900 Active 33 DOM
-
2026-06-03days on market $106,900 Active 29 DOM
-
2026-06-02days on market $106,900 Active 28 DOM
-
2026-06-01days on market $106,900 Active 27 DOM
-
2026-05-31days on market $106,900 Active 26 DOM
-
2026-05-31days on market $106,900 Active 25 DOM
-
2026-05-05$109,900 Active 777-char remark
Show marketing remark (777 chars)
Opportunity awaits with this 3-bedroom, 2-bath home offering tons of potential for the right buyer! Featuring a fenced-in yard, this property is perfect for creating your own private outdoor retreat. Inside, you'll find a welcoming entry room--ideal for relaxing with your morning coffee or unwinding at the end of the day. This home does need some TLC, but it's a fantastic chance to build instant equity and customize the space to your style and needs. Whether you're an investor or a homeowner looking to put in a little work, the possibilities here are endless. Conveniently located near downtown, West Town shopping, and local schools, you'll enjoy easy access to everything you need while still having a place to make your own. Don't miss this value-packed opportunity!
-
2026-05-05$109,900 Active 775-char remark
Show marketing remark (777 chars)
Opportunity awaits with this 3-bedroom, 2-bath home offering tons of potential for the right buyer! Featuring a fenced-in yard, this property is perfect for creating your own private outdoor retreat. Inside, you'll find a welcoming entry room--ideal for relaxing with your morning coffee or unwinding at the end of the day. This home does need some TLC, but it's a fantastic chance to build instant equity and customize the space to your style and needs. Whether you're an investor or a homeowner looking to put in a little work, the possibilities here are endless. Conveniently located near downtown, West Town shopping, and local schools, you'll enjoy easy access to everything you need while still having a place to make your own. Don't miss this value-packed opportunity!
-
2019-09-30historical
-
2018-03-31$68,000
-
2015-02-05soldstatus $52,000
-
2007-09-07soldstatus $34,000
-
2007-08-05soldstatus $34,000
-
2007-06-29$39,900
ⓘ Source: listings_history table (triggers on properties + properties_extension) + one-shot
backfill from property_details.listing_events for pre-trigger history.
Tax reassessment forecast OH · Partial reset (capped growth)
- Current annual tax
- $937 · $78/mo
- Projected year-2 tax
- $1,302 · $109/mo
- Expected delta
- +$365/yr (+$30/mo · 39.0%)
ⓘ Screening estimate from a state-policy table — verify with the county assessor before closing.
Climate risk First Street
- Flood 1/10 Low FEMA zone X (unshaded) · 0% chance over 30 yrs
- Wildfire 1/10 Low
- Heat 3/10 Moderate 7 d/yr ≥100°F today · 18 d/yr by 30 yrs out
- Wind 2/10 Low
- Air quality 2/10 Low 1 unhealthy d/yr today · 2 by 30 yrs out
Nearby sold comps map
Loading sold comps map…
Walkable amenities ~0.75 mi
Loading nearby amenities…
Taxation est. · year 1
- Rental income
- $13,324
- − Mortgage interest
- −$5,988
- − Property taxes
- −$937
- − Insurance
- −$534
- − Repairs & maintenance
- −$1,066
- − Management
- −$1,066
- − Depreciation
- −$3,110
- Taxable income
- $622
- Est. tax owed @ 24.0%
- −$149
- After-tax cash flow
- $2,178/yr
For passive investors: Depreciation is non-cash, so a rental often shows a tax loss while cash-flowing — sheltering income. Rental losses are passive: they offset passive income freely, and up to $25,000/yr can offset ordinary (W-2) income if you actively participate and your MAGI is under $100k (phasing out to $0 by $150k); unused losses carry forward. On sale, claimed depreciation is recaptured at up to 25%, and gains may owe capital-gains tax (a 1031 exchange can defer both). Figures are a year-1 estimate at your 24.0% rate — not tax advice; consult a CPA.
Schools (NCES district)
- District
- Sidney City
- NCES district ID
- 3910003
- Math proficiency
- 46% ▼ -14.00%
- Reading proficiency
- 52% ▼ -6.00%
- Median HH income
- $45,974
- Composite
- 41.55/100
- National rank
- #3443
- State rank
- #454 of 656 in OH
Livability — Sidney
- Score
- 76/100
- State rank
- #220
- US rank
- #3412
Category grades
Schools grade is shown separately in the Schools card above.
Census & demographics
- Census place
- Sidney, OH
- County
- Shelby · 44,840 people
- City population
- 28,955
- Population (ZIP)
- 28,955
- Household income
- $66,044
- Rent vs Own
- Severe rent burden
- 5.7
Population outlook (Shelby County) Hauer SSP2
- Today (2025)
- 47,264 people
- By 2030
- 45,935 · -2.8%
- By 2040
- 42,786 · -9.5%
- By 2050
- 38,981 · -17.5%
- By 2075
- 30,225 · -36.1%
- By 2100
- 21,273 · -55.0%
Race, ethnicity, and origin ACS 2023
- Neighborhood character
- Predominantly White (90%)
- Race & ethnicity
- White 90% Two or more races 4% Black 3% Hispanic / Latino 2%
- Common ancestry
- Lithuanian 3% Slovak 1% Italian 1%
- Foreign-born
- 2% · Canada
- Languages at home
- 98% English-only · Spanish 1%
Political lean MEDSL · Shelby
- 2024 margin
- Solid R (+64.8) · D 17.2% · R 82.0%
- 2008→2024 swing
- -28.5pp toward R · 2008: -36.4pp · 2024: -64.8pp
- All cycles
- 2024: R+64.8 2020: R+63.2 2016: R+60.6 2012: R+46.0 2008: R+36.4
Not yet ingested
- Civics
- —
Market trends
- HPI YoY
- ▼ -66.62%
- Current HPI
- 264.4532
- Rent YoY
- —
- Metro
- —
- State GDP YoY
- ▲ 1.98%
- F500 in state
- 48
Industry mix (Fortune 500 HQ in OH)
| Industry | F500 HQs | Revenue |
|---|---|---|
| Insurance | 3 | $145B |
|
||
| Industrial Machinery | 3 | $49B |
|
||
| Financial Services | 3 | $24B |
|
||
| Consumer Goods | 2 | $93B |
|
||
| Aerospace / Defense | 2 | $47B |
|
||
| Utilities | 2 | $33B |
|
||
Price history
+167.9% since first listed10 events — show timeline
- 2026-05-29 Price Changed $106,900 Dayton MLS
- 2026-05-29 Price Changed $106,900 WRIST
- 2026-05-05 Listed $109,900 WRIST
- 2026-05-05 Listed $109,900 Dayton MLS
- 2019-09-30 Listing Removed — WRIST
- 2018-03-31 Listed $68,000 WRIST
- 2015-02-05 Sold (Public Records) $52,000 Public Records
- 2007-09-07 Sold (Public Records) $34,000 Public Records
- 2007-08-05 Sold (MLS) $34,000 WRIST
- 2007-06-29 Listed $39,900 WRIST
Property tax history
+2.1%/yrLatest (2025): $937 · -1.4% YoY. Source: county tax records.
Cash-flow waterfall
monthlySold comps — $/sqft
last 12 mo · ≤1 miLoading sold comps…