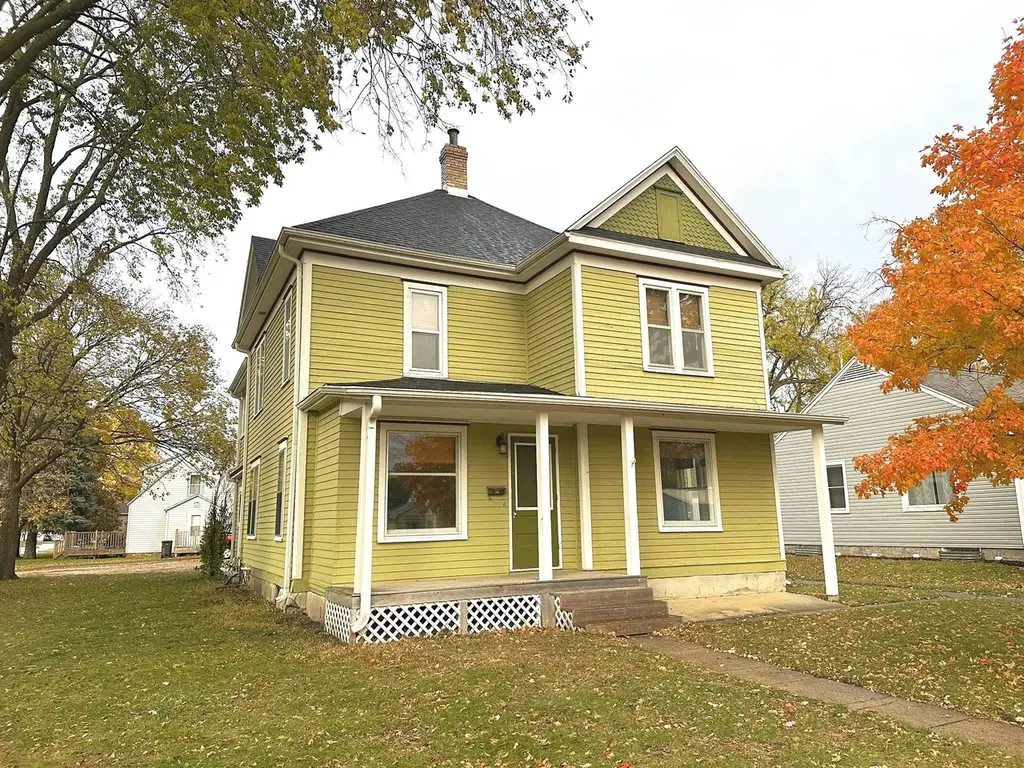
 Duplex
2207 16th St · Emmetsburg, IA
Flood risk 1/10 · Minimal
- FEMA flood zone
- X (unshaded)
- Chance of flooding over 30 yrs
- 0.0%
- Est. flood insurance / yr
- $473 – $860
Fire risk 1/10 · Minimal
- Est. fire insurance / yr
- $902 – $1,676
Heat risk 2/10 · Minimal
- Hot days now (above 101°F)
- 7 days/yr
- Hot days in 30 yrs
- 16 days/yr
Wind risk 2/10 · Minimal
- Chance of severe wind over 30 yrs
- —
Air-quality risk 2/10 · Minimal
- Unhealthy air days now
- 1 days/yr
- Unhealthy air days in 30 yrs
- 1 days/yr
Risk factors via First Street. Map © Google.
Why this score? — see what drove the B- grade
The composite is a weighted blend of 9 inputs, each scored 0–100. Each bar is that input's sub-score; the figure is the points it added to the 100-point composite (weight × sub-score).
- Cash flow +25.9/30.0
- ARV discount +9.9/15.0
- DSCR +8.7/10.0
- 1% rule +6.1/10.0
- Schools +5.7/10.0
- Livability +4.2/5.0
- Rent growth +2.5/5.0
- Condition / age +2.5/5.0
- Appreciation +0.0/10.0
$139,900
🖨 Deal sheet (PDF) 📄 Offer letter ✓ Due diligence
Multi-family units
County records classify this as Multi-Family (2-4 Unit). Listing-text estimate: 2 units. confirmed
Listing remarks
Excellent Investment Opportunity! This well-maintained duplex features two spacious 3-bedroom, 1-bath units — each with its own 1-car garage, private entrance, and in-unit laundry. Both units offer bright living spaces, functional layouts, and separate utilities for easy management. Recent updates include a brand-new roof and new carpeting in the main-floor bedrooms, making this property truly move-in ready. Perfect for an owner-occupant looking to live in one unit and rent the other, or an investor seeking reliable rental income. Don’t miss your chance to own this versatile, income-producing property — schedule a showing today!
Key facts
- Separate utilities
- Recent updates
- Brand new roof
Tags
Property features AI
Exterior
- Parking: Attached garage
- Utilities: Public water; Public sewer
- Home design: Duplex (multi-family residential); Two levels; Facing information not provided
- Construction: Wood siding; Asphalt roof
- Exterior features: Corner lot; Publicly maintained road
Interior
- Heating & cooling: Natural gas forced-air heating
- Interior features: Full basement; Gas water heater
- Laundry & utility: Main-level laundry
Neighborhood map
What this means for you Summary
Snapshot
- This is a 2 × 3-bed/1.0-bath units multifamily listed at $140k.
Deal economics
- At list price, monthly cash flow is $345 ($4k/yr) — positive. Per door: $172/mo.
- The deal already cash-flows at list — no discount required.
- Meets the 1% rule at list price ($2k rent vs $140k).
- Recommended offer: $136k (3.0% below list) — sets the bar for market timing.
- Cap rate 9.2% vs local median 2.7% in Emmetsburg — top-decile yield for the area; either an underpriced asset or a hidden risk that comps aren't pricing in. Stress-test before assuming the spread holds.
Location & tenants
- Location reads 83/100 on livability (#31 in IA, #881 nationally) — a professional / high-income tenant draw. Strengths: cost of living A+, housing A+, health & safety A+; Watch: amenities F, commute F.
- Emmetsburg Community School District (town): math 64% / reading 71% proficiency, ranked #176 of 289 in IA (top 61%) — acceptable for families but not a draw, mixed tenant base, ~2y average lease.
- Zoned schools: West Elementary School (math 72% / reading 77%, grade A, #131 of 616 statewide, top 27%, 300 students, 41% FRL); Emmetsburg Middle School (math 68% / reading 67%, grade A-, #133 of 246 statewide, top 56%, 225 students, 48% FRL); Emmetsburg High School (math 57% / reading 72%, grade B-, #211 of 336 statewide, top 70%, 245 students, 33% FRL).
- Market conditions: 47 active listings in the ZIP; 19 units permitted in Palo Alto County in 2024 (0 in 5+ unit buildings).
Forward outlook
- Local home prices are declining (-3.0%/yr); year-one equity from $967 of loan paydown is wiped out by about $4k of value loss. Plan a longer hold.
- Palo Alto County population projected to shrink 7% by 2050 — rents likely to lag national; underwrite the cash flow, not the appreciation.
Negotiation context
- It's been on market 58 days — a 3% lower offer ($136k) is reasonable based on typical stale-listing flexibility.
- 2 sale attempts with the ask held roughly flat each time — persistent listings suggest the price (not the market) is what's stuck; bring a comps-based counter.
Risks & watch-outs
- Watch-outs: built in 1921 — expect roof / HVAC / electrical / plumbing capex.
Questions for the listing agent
- It's been on market 58 days. Have you received any prior offers? Is the seller open to a 3% concession, seller financing, or rate buy-down credit?
- Can we see the unit-by-unit rent roll, current vacancy, and any below-market leases? What's the average tenancy length?
- What capital expenditures (roof, boiler, parking lot, exteriors) have been made in the last 5 years, and what's planned in the next 2?
- Built in 1921 — when were the roof, HVAC, electrical panel, plumbing, and water heater last replaced?
- Is there a deadline driving the sale (1031 exchange, divorce, estate, relocation)? That informs how much negotiation room exists.
- Schools are A-rated — typically a magnet for longer-tenancy family renters. What's the average tenant stay here, and is there a school-zone premium baked into asking?
- What's the average days-on-market for RENTAL listings here right now (not sales)? A rising rental-DOM trend means longer vacancies and softer asking-rent achievability than the comps imply.
- What's the recent tenant-quality profile in this submarket — average credit score on applications, eviction rate, late-payment / NSF rate, and stable-employment percentage? A property-management company in the area should have these aggregated.
- How much new apartment / multifamily construction is in the pipeline within 1–3 miles? Heavy new supply (>2% of stock underway) typically softens rents 12–24 months out; light construction supports rent growth.
Investment metrics
- 1% rule
- 1.11% ✓
- Cap rate
- 9.25%
- Cash-on-cash
- 10.56%
- DSCR
- 1.47
- GRM
- 7.5
CMA / ARV
- ARV (median comp)
- $147,928
- List price
- $139,900
- Delta
- -5.43%
- Verdict
- FAIR
- Comps
- 2 within 2.0 mi
Projected returns pro-forma
-3.0% appreciation · 3.0% rent growth · sell at horizon
- IRR
- -0.5%
- Equity multiple
- 0.98×
- Total profit
- $-755
- Equity at exit
- $20,860
- IRR
- 9.1%
- Equity multiple
- 1.70×
- Total profit
- $27,479
- Equity at exit
- $12,096
Cash invested: $39,172 (down + closing). Projections, not guarantees.
Landlord ↔ Tenant lean methodology
- Overall (STATE)
- 83 Strongly Landlord-Friendly
- State Iowa
- 83 Strongly Landlord-Friendly · R+6
- County
- — inherits STATE
- City
- — inherits STATE
ZIP-level market 50536
- Home prices YoY
- -7.0%
- Active inventory
- 47
- Price-to-rent
- 15.0×
Monthly cashflow live
- Estimated rent
- $1,550 medium interval (Pro) →
- Mortgage (P&I)
- −$734
- Tax from tax record
- −$88 /mo · $1,056/yr
- Insurance
- −$58
- HOA
- −$0
- Vacancy / Maint / Mgmt
- −$326
- Net cashflow
- $345
Break-even live
Sensitivity live
| Price | -10% $424 | -5% $384 | +0% $345 | +5% $305 | +10% $265 |
|---|---|---|---|---|---|
| Rent | -10% $222 | -5% $283 | +0% $345 | +5% $406 | +10% $467 |
| Rate | -1.0pp $415 | -0.5pp $380 | base $345 | +0.5pp $308 | +1.0pp $271 |
2-unit breakdown (identical units grouped — click to expand)
| Units | Beds | Baths | Est. rent |
|---|---|---|---|
| 2× units | 3 | 1 | $1,550 |
| #1 | 3 | 1 | $775 |
| #2 | 3 | 1 | $775 |
| Total (2 units) | $1,550 | ||
UW: 25.0% down · 7.5% · 30yr · 1.5% tax · 5.0% vac · 8.0% maint · 8.0% mgmt
Financing live
Cash to close
- Down payment
- $34,975
- Closing costs
- $4,197
- Reserves months
- —
- Total cash needed
- —
Loan-product check · same deal, 3 products live
Conventional
25% down · 7.5% · 30yr
- Down + closing
- —
- Monthly P&I
- —
- Monthly cashflow
- —
- DSCR
- —
- Eligible?
- —
Personal DTI + credit; lowest rate.
DSCR
20% down · 8.5% · 30yr
- Down + closing
- —
- Monthly P&I
- —
- Monthly cashflow
- —
- DSCR
- —
- Eligible?
- —
No personal income docs; deal must DSCR.
Hard money
10% down · 12.0% · 12mo
- Down + closing
- —
- Monthly P&I
- —
- Monthly cashflow
- —
- DSCR
- —
- Eligible?
- —
Short-term bridge; refi at stabilization.
Listing history 19 events
-
2026-06-21days on market $139,900 Active 58 DOM
-
2026-06-21days on market $139,900 Active 57 DOM
-
2026-06-18days on market $139,900 Active 55 DOM
-
2026-06-17days on market $139,900 Active 54 DOM
-
2026-06-16days on market $139,900 Active 53 DOM
-
2026-06-15days on market $139,900 Active 52 DOM
-
2026-06-13days on market $139,900 Active 50 DOM
-
2026-06-12days on market $139,900 Active 49 DOM
-
2026-06-09days on market $139,900 Active 46 DOM
-
2026-06-08days on market $139,900 Active 45 DOM
-
2026-06-07days on market $139,900 Active 44 DOM
-
2026-06-05days on market $139,900 Active 42 DOM
-
2026-06-04days on market $139,900 Active 40 DOM
-
2026-06-02days on market $139,900 Active 39 DOM
-
2026-06-01days on market $139,900 Active 38 DOM
-
2026-05-31days on market $139,900 Active 37 DOM
-
2026-05-31days on market $139,900 Active 36 DOM
-
2026-04-24$139,900 Active 654-char remark
-
2025-10-31$144,900 Active
ⓘ Source: listings_history table (triggers on properties + properties_extension) + one-shot
backfill from property_details.listing_events for pre-trigger history.
Tax reassessment forecast IA · Partial reset (capped growth)
- Current annual tax
- $1,056 · $88/mo
- Projected year-2 tax
- $1,626 · $136/mo
- Expected delta
- +$570/yr (+$48/mo · 54.0%)
ⓘ Screening estimate from a state-policy table — verify with the county assessor before closing.
Climate risk First Street
- Flood 1/10 Low FEMA zone X (unshaded) · 0% chance over 30 yrs
- Wildfire 1/10 Low
- Heat 2/10 Low 7 d/yr ≥101°F today · 16 d/yr by 30 yrs out
- Wind 2/10 Low
- Air quality 2/10 Low 1 unhealthy d/yr today · 1 by 30 yrs out
Nearby sold comps map
Loading sold comps map…
Walkable amenities ~0.75 mi
Loading nearby amenities…
Taxation est. · year 1
- Rental income
- $18,600
- − Mortgage interest
- −$7,837
- − Property taxes
- −$1,056
- − Insurance
- −$700
- − Repairs & maintenance
- −$1,488
- − Management
- −$1,488
- − Depreciation
- −$4,070
- Taxable income
- $1,962
- Est. tax owed @ 24.0%
- −$471
- After-tax cash flow
- $3,664/yr
For passive investors: Depreciation is non-cash, so a rental often shows a tax loss while cash-flowing — sheltering income. Rental losses are passive: they offset passive income freely, and up to $25,000/yr can offset ordinary (W-2) income if you actively participate and your MAGI is under $100k (phasing out to $0 by $150k); unused losses carry forward. On sale, claimed depreciation is recaptured at up to 25%, and gains may owe capital-gains tax (a 1031 exchange can defer both). Figures are a year-1 estimate at your 24.0% rate — not tax advice; consult a CPA.
Schools (NCES district)
- District
- Emmetsburg Community School District
- NCES district ID
- 1910950
- Math proficiency
- 64% ▲ 2.00%
- Reading proficiency
- 71% ▲ 7.00%
- Median HH income
- $46,839
- Composite
- 56.97/100
- National rank
- #1110
- State rank
- #176 of 289 in IA
Livability — Emmetsburg
- Score
- 83/100
- State rank
- #31
- US rank
- #881
Category grades
Schools grade is shown separately in the Schools card above.
Census & demographics
- Census place
- Emmetsburg, IA
- City population
- 4,287
- Population (ZIP)
- 4,287
Population outlook (Palo Alto County) Hauer SSP2
- Today (2025)
- 8,816 people
- By 2030
- 8,634 · -2.1%
- By 2040
- 8,334 · -5.5%
- By 2050
- 8,232 · -6.6%
- By 2075
- 8,533 · -3.2%
- By 2100
- 8,976 · +1.8%
Race, ethnicity, and origin ACS 2023
- Neighborhood character
- Predominantly White (97%)
- Race & ethnicity
- White 97% Hispanic / Latino 1% Two or more races 1% Asian 1%
- Common ancestry
- Portuguese 10% Lithuanian 2% Iranian 2%
- Foreign-born
- 1% · Canada, China
- Languages at home
- 99% English-only · German/W. Germanic 1% Spanish 1%
Political lean MEDSL · Palo Alto
- 2024 margin
- Solid R (+45.0) · D 26.9% · R 71.9% · Other 1.2%
- 2008→2024 swing
- -47.8pp toward R · 2008: 2.8pp · 2024: -45.0pp
- All cycles
- 2024: R+45.0 2020: R+37.3 2016: R+36.0 2012: R+10.8 2008: D+2.8
Not yet ingested
- Civics
- —
Market trends
- HPI YoY
- ▼ -17.96%
- Current HPI
- 237.1703
- Rent YoY
- —
- Metro
- —
- State GDP YoY
- ▲ 2.48%
- F500 in state
- 4
Industry mix (Fortune 500 HQ in IA)
| Industry | F500 HQs | Revenue |
|---|---|---|
| Financial Services | 1 | $16B |
|
||
| Retail / Convenience | 1 | $15B |
|
||
Price history
-3.5% since first listed2 events — show timeline
- 2026-04-24 Listed $139,900 Iowa Great Lakes BOR
- 2025-10-31 Listed $144,900 Iowa Great Lakes BOR
Property tax history
+3.5%/yrLatest (2025): $1,056 · +1.0% YoY. Source: county tax records.
Cash-flow waterfall
monthlySold comps — $/sqft
last 12 mo · ≤1 miLoading sold comps…