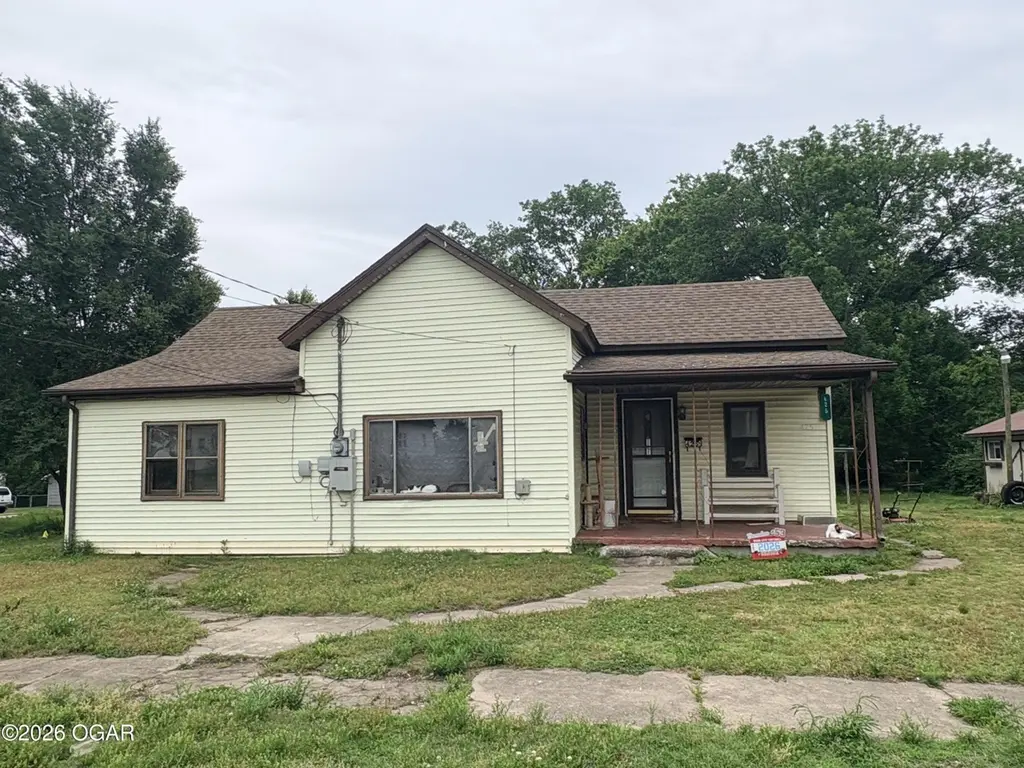
425 N Fountain St · Carterville, MO
Flood risk No data
- FEMA flood zone
- —
- Chance of flooding over 30 yrs
- —
- Est. flood insurance / yr
- —
Fire risk No data
- Est. fire insurance / yr
- —
Heat risk No data
- Hot days now (above threshold)
- —
- Hot days in 30 yrs
- —
Wind risk No data
- Chance of severe wind over 30 yrs
- —
Air-quality risk No data
- Unhealthy air days now
- —
- Unhealthy air days in 30 yrs
- —
Risk factors via First Street. Map © Google.
Why this score? — see what drove the B- grade
The composite is a weighted blend of 9 inputs, each scored 0–100. Each bar is that input's sub-score; the figure is the points it added to the 100-point composite (weight × sub-score).
- Cash flow +29.9/30.0
- DSCR +10.0/10.0
- 1% rule +7.5/10.0
- ARV discount +7.5/15.0
- Schools +4.8/10.0
- Livability +3.6/5.0
- Rent growth +2.5/5.0
- Condition / age +2.5/5.0
- Appreciation +0.0/10.0
$110,000
🖨 Deal sheet (PDF) 📄 Offer letter ✓ Due diligence
Listing remarks MLS
3 bedroom (could be 4), 1 bath house on double lot (extra lot is buildable). Back room (7x19) added Dec. 2019, has separate heating/cooling unit. Whole house Generac generator. Detached 25x32 metal garage/workshop with concrete floor and water. Additional outbuilding stays.
Key facts
- Vacant lot
- Partial basement
- Large lot
Tags
Property features AI
Finance
- Financial info: Annual tax noted (amount on file)
Exterior
- Parking: Detached 2-car garage; Detached 1-car carport; Additional listed parking: 2 Car Det Garage, 1 Car Det Carport
- Utilities: Public sewer
- Home design: Single-family residence; Freestanding property; Level topography
- Construction: Vinyl siding; Shingle roof; Built area above grade: 1,696
- Exterior features: Covered porch; Porch
Interior
- Bedrooms: 7 total rooms (includes bedrooms and living spaces)
- Flooring: Carpet; Vinyl; Wood
- Bathrooms: 1 full bathroom
- Heating & cooling: Natural gas heating; Ceiling fans; Wall-mounted cooling units
- Interior features: Ceiling fans; Walk-in closets; Partial basement
Neighborhood map
What this means for you Summary
Snapshot
- This is a 3-bed/1.0-bath other listed at $110k.
Deal economics
- At list price, monthly cash flow is $406 ($5k/yr) — positive.
- The deal already cash-flows at list — no discount required.
- Meets the 1% rule at list price ($1k rent vs $110k).
Location & tenants
- Location reads 72/100 on livability (#90 in MO) — a middle-class / working-renter tenant base. Strengths: cost of living A+, housing A+, health & safety A+; Watch: amenities F, commute F, employment F.
- Webb City R-VII (suburban): math 53% / reading 60% proficiency, ranked #21 of 324 in MO (top 6%) — acceptable for families but not a draw, mixed tenant base, ~2y average lease.
- Zoned schools: Carterville Elem. (math 52% / reading 52%, grade C-, #231 of 1,115 statewide, top 24%, 239 students, 57% FRL); Webb City Middle (math 53% / reading 55%, grade B-, #46 of 391 statewide, top 12%, 696 students, 47% FRL).
- Market conditions: 21 active listings in the ZIP; 4 comparable units currently listed for rent nearby; rentals at typical pace (median 22d on market — plan ~3-4 weeks tenant-placement turnaround); 602 units permitted in Jasper County in 2024 (0 in 5+ unit buildings).
Forward outlook
- Local home prices are declining (-3.0%/yr); year-one equity from $761 of loan paydown is wiped out by about $3k of value loss. Plan a longer hold.
- At projected returns (-3.0% appreciation + 3.0% rent growth), your $31k cash investment doubles in ~8 years — after that, you're playing with house money.
Negotiation context
- Only 11 days on market — expect competitive offers; lowballing is unlikely to land.
- 2 sale attempts since 5y ago with the ask held roughly flat each time — persistent listings suggest the price (not the market) is what's stuck; bring a comps-based counter.
- Current owner paid $80k; 38% above their basis — modest negotiation headroom, anchor on the comps not their cost.
Questions for the listing agent
- Built in 1965 — when were the roof, HVAC, electrical panel, plumbing, and water heater last replaced?
- Is there a deadline driving the sale (1031 exchange, divorce, estate, relocation)? That informs how much negotiation room exists.
- What's the average days-on-market for RENTAL listings here right now (not sales)? A rising rental-DOM trend means longer vacancies and softer asking-rent achievability than the comps imply.
- What's the recent tenant-quality profile in this submarket — average credit score on applications, eviction rate, late-payment / NSF rate, and stable-employment percentage? A property-management company in the area should have these aggregated.
- How much new for-sale + rental construction is in the pipeline within 1–3 miles? Heavy new supply typically softens prices + rents 12–24 months out; constrained supply supports both.
Investment metrics
- 1% rule
- 1.25% ✓
- Cap rate
- 10.72%
- Cash-on-cash
- 15.82%
- DSCR
- 1.70
- GRM
- 6.6
CMA / ARV
No comps found within radius.
Projected returns pro-forma
-3.0% appreciation · 3.0% rent growth · sell at horizon
- IRR
- 6.7%
- Equity multiple
- 1.26×
- Total profit
- $8,007
- Equity at exit
- $16,401
- IRR
- 16.0%
- Equity multiple
- 2.30×
- Total profit
- $40,160
- Equity at exit
- $9,511
Cash invested: $30,800 (down + closing). Projections, not guarantees.
Landlord ↔ Tenant lean methodology
- Overall (STATE)
- 81 Strongly Landlord-Friendly
- State Missouri
- 81 Strongly Landlord-Friendly · R+10
- County
- — inherits STATE
- City
- — inherits STATE
ZIP-level market 64835
- Home prices YoY
- -7.8%
- Active inventory
- 21
- Price-to-rent
- 6.6×
Monthly cashflow live
- Estimated rent
- $1,378 medium interval (Pro) →
- Mortgage (P&I)
- −$577
- Tax from tax record
- −$60 /mo · $724/yr
- Insurance
- −$46
- HOA
- −$0
- Vacancy / Maint / Mgmt
- −$289
- Net cashflow
- $406
Break-even live
Sensitivity live
| Price | -10% $468 | -5% $437 | +0% $406 | +5% $375 | +10% $344 |
|---|---|---|---|---|---|
| Rent | -10% $297 | -5% $352 | +0% $406 | +5% $460 | +10% $515 |
| Rate | -1.0pp $461 | -0.5pp $434 | base $406 | +0.5pp $377 | +1.0pp $348 |
UW: 25.0% down · 7.5% · 30yr · 1.5% tax · 5.0% vac · 8.0% maint · 8.0% mgmt
Financing live
Cash to close
- Down payment
- $27,500
- Closing costs
- $3,300
- Reserves months
- —
- Total cash needed
- —
Loan-product check · same deal, 3 products live
Conventional
25% down · 7.5% · 30yr
- Down + closing
- —
- Monthly P&I
- —
- Monthly cashflow
- —
- DSCR
- —
- Eligible?
- —
Personal DTI + credit; lowest rate.
DSCR
20% down · 8.5% · 30yr
- Down + closing
- —
- Monthly P&I
- —
- Monthly cashflow
- —
- DSCR
- —
- Eligible?
- —
No personal income docs; deal must DSCR.
Hard money
10% down · 12.0% · 12mo
- Down + closing
- —
- Monthly P&I
- —
- Monthly cashflow
- —
- DSCR
- —
- Eligible?
- —
Short-term bridge; refi at stabilization.
Rent comps 4 comps
| Address | Beds | Baths | Sqft | Rent | $/sqft | DOM | Units | Dist |
|---|---|---|---|---|---|---|---|---|
| 705 N Washington St Carterville, MO | 3.0 | 2.0 | 1180 | $1,400 | $1.19 | 21d | 1 | 0.21mi |
| 612 Easton Unit B Webb City, MO | 3.0 | 2.0 | 1560 | $1,300 | $0.83 | 21d | 1 | 0.66mi |
| 618 N Hall St Unit A Webb City, MO | 3.0 | 2.0 | 1250 | $1,400 | $1.12 | 21d | 1 | 0.84mi |
| 214 S Tom St Webb City, MO | 3.0 | 2.0 | 1556 | $1,400 | $0.90 | 21d | 1 | 1.09mi |
Listing history 13 events
-
2026-06-09status $110,000 Pending 11 DOM
-
2026-06-08days on market $110,000 Active 11 DOM
-
2026-06-07days on market $110,000 Active 10 DOM
-
2026-06-05days on market $110,000 Active 7 DOM
-
2026-06-02days on market $110,000 Active 5 DOM
-
2026-06-01days on market $110,000 Active 4 DOM
-
2026-05-31days on market $110,000 Active 3 DOM
-
2026-05-30days on market $110,000 Active 2 DOM
-
2026-05-26$110,000 Active
-
2021-12-13soldstatus Closed 274-char remark
Show marketing remark (274 chars)
3 bedroom (could be 4), 1 bath house on double lot (extra lot is buildable). Back room (7x19) added Dec. 2019, has separate heating/cooling unit. Whole house Generac generator. Detached 25x32 metal garage/workshop with concrete floor and water. Additional outbuilding stays.
-
2021-12-13soldstatus $80,000
Show marketing remark (274 chars)
3 bedroom (could be 4), 1 bath house on double lot (extra lot is buildable). Back room (7x19) added Dec. 2019, has separate heating/cooling unit. Whole house Generac generator. Detached 25x32 metal garage/workshop with concrete floor and water. Additional outbuilding stays.
-
2021-10-29$77,000 274-char remark
Show marketing remark (274 chars)
3 bedroom (could be 4), 1 bath house on double lot (extra lot is buildable). Back room (7x19) added Dec. 2019, has separate heating/cooling unit. Whole house Generac generator. Detached 25x32 metal garage/workshop with concrete floor and water. Additional outbuilding stays.
-
1971-10-26soldstatus
ⓘ Source: listings_history table (triggers on properties + properties_extension) + one-shot
backfill from property_details.listing_events for pre-trigger history.
Tax reassessment forecast MO · Resets to sale price
- Current annual tax
- $724 · $60/mo
- Projected year-2 tax
- $1,067 · $89/mo
- Expected delta
- +$343/yr (+$29/mo · 47.5%)
ⓘ Screening estimate from a state-policy table — verify with the county assessor before closing.
Nearby sold comps map
Loading sold comps map…
Walkable amenities ~0.75 mi
Loading nearby amenities…
Taxation est. · year 1
- Rental income
- $16,541
- − Mortgage interest
- −$6,162
- − Property taxes
- −$724
- − Insurance
- −$550
- − Repairs & maintenance
- −$1,323
- − Management
- −$1,323
- − Depreciation
- −$3,200
- Taxable income
- $3,260
- Est. tax owed @ 24.0%
- −$782
- After-tax cash flow
- $4,090/yr
For passive investors: Depreciation is non-cash, so a rental often shows a tax loss while cash-flowing — sheltering income. Rental losses are passive: they offset passive income freely, and up to $25,000/yr can offset ordinary (W-2) income if you actively participate and your MAGI is under $100k (phasing out to $0 by $150k); unused losses carry forward. On sale, claimed depreciation is recaptured at up to 25%, and gains may owe capital-gains tax (a 1031 exchange can defer both). Figures are a year-1 estimate at your 24.0% rate — not tax advice; consult a CPA.
Schools (NCES district)
- District
- Webb City R-VII
- NCES district ID
- 2931500
- Math proficiency
- 53% ▼ -1.00%
- Reading proficiency
- 60% ▼ -1.00%
- Median HH income
- $45,022
- Composite
- 47.68/100
- National rank
- #2244
- State rank
- #21 of 324 in MO
Livability — Carterville
- Score
- 72/100
- State rank
- #90
- US rank
- #6139
Category grades
Schools grade is shown separately in the Schools card above.
Census & demographics
- Census place
- Carterville, MO
- City population
- 1,978
- Population (ZIP)
- 1,978
Population outlook (Jasper County) Hauer SSP2
- Today (2025)
- 120,033 people
- By 2030
- 120,091 · +0.0%
- By 2040
- 119,297 · -0.6%
- By 2050
- 117,705 · -1.9%
- By 2075
- 110,402 · -8.0%
- By 2100
- 99,719 · -16.9%
Race, ethnicity, and origin ACS 2023
- Neighborhood character
- Predominantly White (83%)
- Race & ethnicity
- White 83% Two or more races 12% Hispanic / Latino 8%
- Hispanic origin (detail)
- Mexican 2% Puerto Rican 3%
- Common ancestry
- Italian 2% Lithuanian 1% Iranian 1%
- Foreign-born
- 2% · Canada, Vietnam
- Languages at home
- 96% English-only · Spanish 3%
Political lean MEDSL · Jasper
- 2024 margin
- Solid R (+46.8) · D 25.9% · R 72.7% · Other 1.4%
- 2008→2024 swing
- -13.6pp toward R · 2008: -33.2pp · 2024: -46.8pp
- All cycles
- 2024: R+46.8 2020: R+46.2 2016: R+50.8 2012: R+41.0 2008: R+33.2
Not yet ingested
- Civics
- —
Market trends
- HPI YoY
- ▼ -16.03%
- Current HPI
- 189.2
- Rent YoY
- —
- Metro
- —
- State GDP YoY
- ▲ 1.84%
- F500 in state
- 20
Industry mix (Fortune 500 HQ in MO)
| Industry | F500 HQs | Revenue |
|---|---|---|
| Healthcare | 1 | $163B |
|
||
| Insurance | 1 | $21B |
|
||
| Industrial Technology | 1 | $17B |
|
||
| Retail | 1 | $16B |
|
||
| Industrial Distribution | 1 | $10B |
|
||
| Utilities | 1 | $9B |
|
||
Price history
+42.9% since first listed5 events — show timeline
- 2026-05-26 Listed $110,000 OGAR
- 2021-12-13 Sold (Public Records) $80,000 Public Records
- 2021-12-13 Sold (MLS) — OGAR
- 2021-10-29 Listed $77,000 OGAR
- 1971-10-26 Sold (Public Records) — Public Records
Property tax history
-0.1%/yrLatest (2025): $724 · +10.0% YoY. Source: county tax records.
Cash-flow waterfall
monthlySold comps — $/sqft
last 12 mo · ≤1 miLoading sold comps…