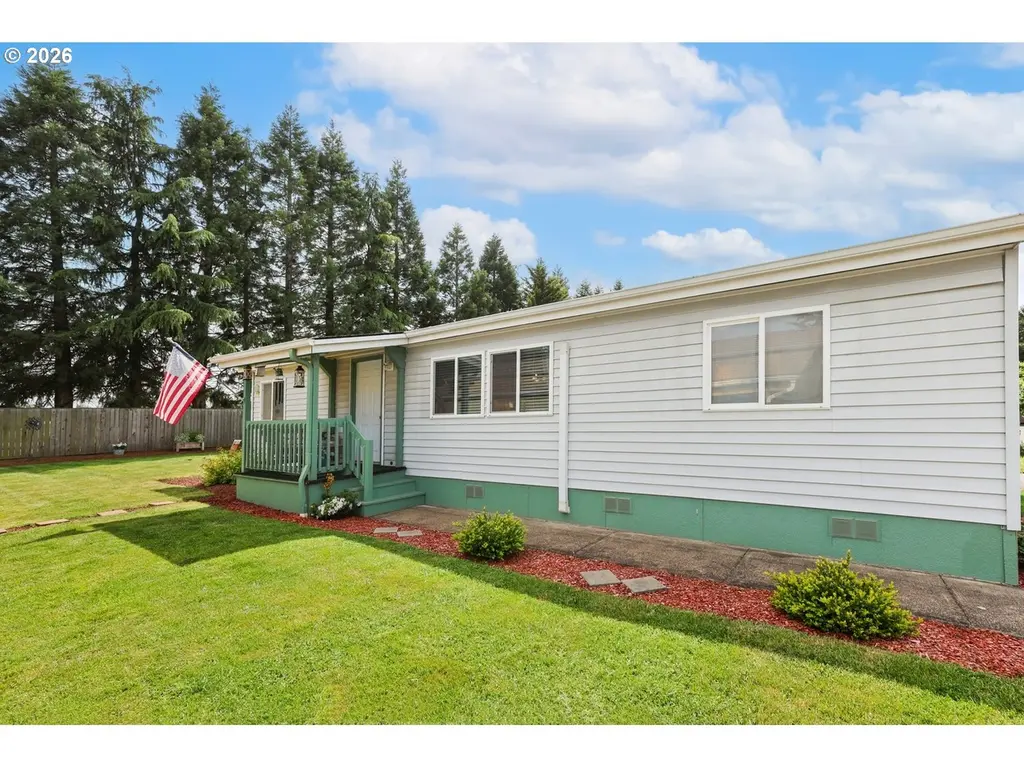
310 Pitney Ln #51 · Junction City, OR
Flood risk 1/10 · Minimal
- FEMA flood zone
- X (unshaded)
- Chance of flooding over 30 yrs
- 0.0%
- Est. flood insurance / yr
- $507 – $1,088
Fire risk 1/10 · Minimal
- Est. fire insurance / yr
- $498 – $926
Heat risk 4/10 · Minor
- Hot days now (above 92°F)
- 7 days/yr
- Hot days in 30 yrs
- 15 days/yr
Wind risk 1/10 · Minimal
- Chance of severe wind over 30 yrs
- —
Air-quality risk 10/10 · Severe
- Unhealthy air days now
- 12 days/yr
- Unhealthy air days in 30 yrs
- 13 days/yr
Risk factors via First Street. Map © Google.
Why this score? — see what drove the D+ grade
The composite is a weighted blend of 9 inputs, each scored 0–100. Each bar is that input's sub-score; the figure is the points it added to the 100-point composite (weight × sub-score).
- Cash flow +19.4/30.0
- ARV discount +7.5/15.0
- DSCR +6.1/10.0
- 1% rule +4.1/10.0
- Livability +4.1/5.0
- Schools +2.9/10.0
- Rent growth +2.5/5.0
- Condition / age +2.5/5.0
- Appreciation +0.0/10.0
$160,000
🖨 Deal sheet (PDF) 📄 Offer letter ✓ Due diligence
Listing remarks MLS
Find the unexpected in this 1997 Fleetwood, 3 bedroom, 2 bath home that has a large fenced backyard. Vaulted ceilings and good seperation of space, forced air heat! Good opportunity for the right buyer.
Key facts
- Covered porch
- Large yard
- Carport
Tags
Property features AI
Finance
- Other: Unit dimensions: 45' length x 26' width; Property type: Residential — manufactured home in park; Parcel number available
- Financial info: Monthly lot rent applies ($750)
- HOA & community: Park amenities include trash service; Located in The Meadows On Pitney Pond (park-managed); management contact available
Exterior
- Parking: Covered off-street parking; Carport
- Security: No security features
- Utilities: Public water; Public sewer; Electric service
- Home design: Manufactured home in a park (Fleetwood); Single-level; Updated/remodeled; No attached units; Main-level living; No notable view
- Construction: Built in 1997; Wood siding exterior
- Exterior features: Shingle roof; Wood siding; Tool shed; Yard; Level lot; Paved road access
Interior
- Kitchen: Dishwasher; Free-standing refrigerator; Stainless steel appliances
- Bedrooms: Primary bedroom on main level; Second bedroom; Third bedroom
- Flooring: Luxury vinyl plank
- Bathrooms: Two full bathrooms (both on main level)
- Heating & cooling: Forced air heating; Mini-split heating and cooling
- Interior features: Luxury vinyl plank flooring; Vaulted ceilings; Washer/Dryer included; Vinyl frame windows; Accessible — minimal steps and one-level layout
- Laundry & utility: Washer and dryer included; Electric hot water
Neighborhood map
What this means for you Summary
Snapshot
- This is a 3-bed/2.0-bath manufactured listed at $160k.
Deal economics
- At list price, monthly cash flow is $177 ($2k/yr) — positive.
- The deal already cash-flows at list — no discount required.
- To meet the 1% rule (rent ≥ 1% of price), the offer needs to be $146k (8.7% below list).
- Recommended offer: $146k (8.7% below list) — sets the bar for 1% rule.
- Cap rate 7.6% vs local median 2.7% in Junction City — top-decile yield for the area; either an underpriced asset or a hidden risk that comps aren't pricing in. Stress-test before assuming the spread holds.
Location & tenants
- Location reads 82/100 on livability (#46 in OR, #1,184 nationally) — a professional / high-income tenant draw. Strengths: housing A+, health & safety A+, cost of living B+.
- Junction City SD 69 (town): math 26% / reading 41% proficiency, ranked #27 of 58 in OR (top 47%) — families likely to look elsewhere, expect single-tenant / working-renter base with shorter leases.
- Zoned schools: Laurel Elementary School (math 32% / reading 42%, grade F, #205 of 412 statewide, top 51%, 501 students, 50% FRL); Oaklea Middle School (math 32% / reading 47%, grade F, #45 of 128 statewide, top 35%, 490 students, 52% FRL); Junction City High School (math 10% / reading 70%, grade F, #69 of 143 statewide, top 54%, 539 students, 43% FRL).
- Market conditions: 87 active listings in the ZIP; 7 comparable units currently listed for rent nearby; rentals at typical pace (median 15d on market — plan ~3-4 weeks tenant-placement turnaround); 43% of comp listings sitting > 30 days — soft ceiling on asking rent; 1,808 units permitted in Lane County in 2024 (972 in 5+ unit buildings).
Forward outlook
- Local home prices are declining (-3.0%/yr); year-one equity from $1k of loan paydown is wiped out by about $5k of value loss. Plan a longer hold.
- Lane County population projected at +15% by 2050 — long-run rental-demand tailwind backs the buy-and-hold thesis.
Negotiation context
- It's been on market 34 days — a 3% lower offer ($155k) is reasonable based on typical stale-listing flexibility.
- 2 sale attempts since 21y ago with the ask held roughly flat each time — persistent listings suggest the price (not the market) is what's stuck; bring a comps-based counter.
- Current owner paid $30k; list at $160k implies a 442% gain — meaningful room to come down on a strong offer.
Questions for the listing agent
- It's been on market 34 days. Have you received any prior offers? Is the seller open to a 9% concession, seller financing, or rate buy-down credit?
- Is there a deadline driving the sale (1031 exchange, divorce, estate, relocation)? That informs how much negotiation room exists.
- Schools are D-rated, which usually means shorter tenancies and higher turnover. Who's the typical renter profile here, and what's been the actual vacancy rate?
- The area grade is low — what's the realistic commute time and amenity access for the typical tenant pool here? Any planned neighborhood developments (good or bad) we should know about?
- What's the average days-on-market for RENTAL listings here right now (not sales)? A rising rental-DOM trend means longer vacancies and softer asking-rent achievability than the comps imply.
- What's the recent tenant-quality profile in this submarket — average credit score on applications, eviction rate, late-payment / NSF rate, and stable-employment percentage? A property-management company in the area should have these aggregated.
- How much new for-sale + rental construction is in the pipeline within 1–3 miles? Heavy new supply typically softens prices + rents 12–24 months out; constrained supply supports both.
Investment metrics
- 1% rule
- 0.91% ✗
- Cap rate
- 7.62%
- Cash-on-cash
- 4.75%
- DSCR
- 1.21
- GRM
- 9.1
CMA / ARV
- ARV (on-the-fly)
- $76,050
- Comps found
- 6
Show comp detail 6 sales within ~0.75 mi
| Address | Dist | Beds/Ba | Sqft | Sold | Price | $/sf | Match |
|---|---|---|---|---|---|---|---|
| 310 Pitney Ln #1 | 0.18mi | 3/2.0 | 1,248 (+7%) | 11mo | $123,500 | $99 | 71 |
| 1225 W 10th Ave #47 | 0.55mi | 3/2.0 | 1,152 (-2%) | 10mo | $70,000 | $61 | 64 |
| 1225 W 10th Ave #45 | 0.55mi | 2/2.0 (-1) | 1,152 (-2%) | 21mo | $75,000 | $65 | 50 |
| 1225 W 10th Ave #5 | 0.55mi | 2/1.0 (-1) | 1,120 (-4%) | 23mo | $65,000 | $58 | 39 |
| 1225 W 10th Ave #11 | 0.55mi | 2/1.0 (-1) | 1,008 (-14%) | 14mo | $75,000 | $74 | 30 |
| 1225 W 10th Ave #44 | 0.55mi | 2/2.0 (-1) | 1,344 (+15%) | 24mo | $75,000 | $56 | 25 |
Match score weights: distance 35% · size 25% · config 20% · recency 20%. Top-matched comps best support the ARV.
Projected returns pro-forma
-3.0% appreciation · 3.0% rent growth · sell at horizon
- IRR
- -8.9%
- Equity multiple
- 0.67×
- Total profit
- $-14,690
- Equity at exit
- $23,857
- IRR
- 0.5%
- Equity multiple
- 1.03×
- Total profit
- $1,517
- Equity at exit
- $13,834
Cash invested: $44,800 (down + closing). Projections, not guarantees.
Landlord ↔ Tenant lean methodology
- Overall (STATE)
- 28 Tenant-Leaning
- State Oregon
- 28 Tenant-Leaning · D+6
- County
- — inherits STATE
- City
- — inherits STATE
ZIP-level market 97448
- Home prices YoY
- -35.0%
- Active inventory
- 87
- Price-to-rent
- 9.1×
Monthly cashflow live
- Estimated rent
- $1,460 high interval (Pro) →
- Mortgage (P&I)
- −$839
- Tax from tax record
- −$70 /mo · $845/yr
- Insurance
- −$67
- HOA
- −$0
- Vacancy / Maint / Mgmt
- −$307
- Net cashflow
- $177
Break-even live
Sensitivity live
| Price | -10% $268 | -5% $223 | +0% $177 | +5% $132 | +10% $87 |
|---|---|---|---|---|---|
| Rent | -10% $62 | -5% $120 | +0% $177 | +5% $235 | +10% $293 |
| Rate | -1.0pp $258 | -0.5pp $218 | base $177 | +0.5pp $136 | +1.0pp $94 |
UW: 25.0% down · 7.5% · 30yr · 1.5% tax · 5.0% vac · 8.0% maint · 8.0% mgmt
Financing live
Cash to close
- Down payment
- $40,000
- Closing costs
- $4,800
- Reserves months
- —
- Total cash needed
- —
Loan-product check · same deal, 3 products live
Conventional
25% down · 7.5% · 30yr
- Down + closing
- —
- Monthly P&I
- —
- Monthly cashflow
- —
- DSCR
- —
- Eligible?
- —
Personal DTI + credit; lowest rate.
DSCR
20% down · 8.5% · 30yr
- Down + closing
- —
- Monthly P&I
- —
- Monthly cashflow
- —
- DSCR
- —
- Eligible?
- —
No personal income docs; deal must DSCR.
Hard money
10% down · 12.0% · 12mo
- Down + closing
- —
- Monthly P&I
- —
- Monthly cashflow
- —
- DSCR
- —
- Eligible?
- —
Short-term bridge; refi at stabilization.
Rent comps 7 comps
| Address | Beds | Baths | Sqft | Rent | $/sqft | DOM | Units | Dist |
|---|---|---|---|---|---|---|---|---|
| 151 Maple St Unit 20102 Junction City, OR | 2.0 | 1.0 | 810 | $1,295 | $1.60 | 15d | 1 | 0.41mi |
| 165 SW Kalmia St Ste 3 Junction City, OR | 2.0 | 1.0 | 886 | $1,295 | $1.46 | 15d | 1 | 0.50mi |
| 165 SW Kalmia St Unit 4 Junction City, OR | 2.0 | 1.0 | 886 | $1,295 | $1.46 | 45d | 1 | 0.50mi |
| 2280 W 10th Ave Unit 414-259 Junction City, OR | 2.0 | 2.0 | 968 | $1,565 | $1.62 | 15d | 1 | 0.76mi |
| 2254 W 10th Ave Unit 414-115 Junction City, OR | 2.0 | 2.0 | 968 | $1,599 | $1.65 | 45d | 1 | 0.79mi |
| 2272 W 10th Ave Junction City, OR | 2.0 | 2.0 | 990 | $1,575 | $1.59 | 15d | 1 | 0.82mi |
| 29426 Dane Ln Junction City, OR | 3.0 | 2.0 | 1320 | $2,100 | $1.59 | 45d | 1 | 1.42mi |
Listing history 20 events
-
2026-06-21days on market $160,000 Active 34 DOM
-
2026-06-18days on market $160,000 Active 31 DOM
-
2026-06-17days on market $160,000 Active 30 DOM
-
2026-06-16days on market $160,000 Active 29 DOM
-
2026-06-15days on market $160,000 Active 28 DOM
-
2026-06-14days on market $160,000 Active 26 DOM
-
2026-06-10days on market $160,000 Active 23 DOM
-
2026-06-09days on market $160,000 Active 22 DOM
-
2026-06-08days on market $160,000 Active 21 DOM
-
2026-06-07days on market $160,000 Active 20 DOM
-
2026-06-05days on market $160,000 Active 17 DOM
-
2026-06-03days on market $160,000 Active 16 DOM
-
2026-06-02days on market $160,000 Active 15 DOM
-
2026-06-01days on market $160,000 Active 14 DOM
-
2026-05-31days on market $160,000 Active 13 DOM
-
2026-05-30days on market $160,000 Active 12 DOM
-
2026-05-18$160,000 Active
-
2006-01-26soldstatus $29,500 204-char remark
Show marketing remark (204 chars)
Find the unexpected in this 1997 Fleetwood, 3 bedroom, 2 bath home that has a large fenced backyard. Vaulted ceilings and good seperation of space, forced air heat! Good opportunity for the right buyer.
-
2006-01-16historical 204-char remark
Show marketing remark (204 chars)
Find the unexpected in this 1997 Fleetwood, 3 bedroom, 2 bath home that has a large fenced backyard. Vaulted ceilings and good seperation of space, forced air heat! Good opportunity for the right buyer.
-
2005-10-16$34,900 204-char remark
Show marketing remark (204 chars)
Find the unexpected in this 1997 Fleetwood, 3 bedroom, 2 bath home that has a large fenced backyard. Vaulted ceilings and good seperation of space, forced air heat! Good opportunity for the right buyer.
ⓘ Source: listings_history table (triggers on properties + properties_extension) + one-shot
backfill from property_details.listing_events for pre-trigger history.
Tax reassessment forecast OR · Resets to sale price
- Current annual tax
- $845 · $70/mo
- Projected year-2 tax
- $1,552 · $129/mo
- Expected delta
- +$707/yr (+$59/mo · 83.6%)
ⓘ Screening estimate from a state-policy table — verify with the county assessor before closing.
Climate risk First Street
- Flood 1/10 Low FEMA zone X (unshaded) · 0% chance over 30 yrs
- Wildfire 1/10 Low
- Heat 4/10 Moderate 7 d/yr ≥92°F today · 15 d/yr by 30 yrs out
- Wind 1/10 Low
- Air quality 10/10 Extreme 12 unhealthy d/yr today · 13 by 30 yrs out
Nearby sold comps map
Loading sold comps map…
Walkable amenities ~0.75 mi
Loading nearby amenities…
Taxation est. · year 1
- Rental income
- $17,521
- − Mortgage interest
- −$8,962
- − Property taxes
- −$845
- − Insurance
- −$800
- − Repairs & maintenance
- −$1,402
- − Management
- −$1,402
- − Depreciation
- −$4,655
- Taxable loss
- −$544
- Est. tax savings @ 24.0%
- +$131
- After-tax cash flow
- $2,259/yr
For passive investors: Depreciation is non-cash, so a rental often shows a tax loss while cash-flowing — sheltering income. Rental losses are passive: they offset passive income freely, and up to $25,000/yr can offset ordinary (W-2) income if you actively participate and your MAGI is under $100k (phasing out to $0 by $150k); unused losses carry forward. On sale, claimed depreciation is recaptured at up to 25%, and gains may owe capital-gains tax (a 1031 exchange can defer both). Figures are a year-1 estimate at your 24.0% rate — not tax advice; consult a CPA.
Schools (NCES district)
- District
- Junction City SD 69
- NCES district ID
- 4106930
- Math proficiency
- 26% ▼ -10.00%
- Reading proficiency
- 41% ▼ -11.00%
- Median HH income
- $50,018
- Composite
- 29.05/100
- National rank
- #6608
- State rank
- #27 of 58 in OR
Livability — Junction City
- Score
- 82/100
- State rank
- #46
- US rank
- #1184
Category grades
Schools grade is shown separately in the Schools card above.
Census & demographics
- Census place
- Junction City, OR
- Population (ZIP)
- 14,629
Population outlook (Lane County) Hauer SSP2
- Today (2025)
- 391,933 people
- By 2030
- 405,860 · +3.6%
- By 2040
- 429,386 · +9.6%
- By 2050
- 452,016 · +15.3%
- By 2075
- 508,825 · +29.8%
- By 2100
- 531,208 · +35.5%
Race, ethnicity, and origin ACS 2023
- Neighborhood character
- Predominantly White (84%)
- Race & ethnicity
- White 84% Two or more races 8% Hispanic / Latino 8%
- Hispanic origin (detail)
- Mexican 6%
- Common ancestry
- Lithuanian 4% Portuguese 2% Italian 2%
- Foreign-born
- 3% · Canada
- Languages at home
- 95% English-only · Spanish 4%
Political lean MEDSL · Lane
- 2024 margin
- Strong D (+23.1) · D 60.0% · R 36.9% · Other 3.1%
- 2008→2024 swing
- -4.3pp toward R · 2008: 27.4pp · 2024: 23.1pp
- All cycles
- 2024: D+23.1 2020: D+24.3 2016: D+18.9 2012: D+23.4 2008: D+27.4
Not yet ingested
- Civics
- —
Market trends
- HPI YoY
- ▼ -151.05%
- Current HPI
- 281.1105
- Rent YoY
- —
- Metro
- —
- State GDP YoY
- ▲ 2.05%
- F500 in state
- 2
Industry mix (Fortune 500 HQ in OR)
| Industry | F500 HQs | Revenue |
|---|---|---|
| Consumer Goods | 1 | $51B |
|
||
Price history
+358.5% since first listed4 events — show timeline
- 2026-05-18 Listed $160,000 RMLS
- 2006-01-26 Sold (MLS) $29,500 RMLS
- 2006-01-16 Delisted — RMLS
- 2005-10-16 Listed $34,900 RMLS
Property tax history
+4.0%/yrLatest (2025): $845 · +3.6% YoY. Source: county tax records.
Cash-flow waterfall
monthlySold comps — $/sqft
last 12 mo · ≤1 miLoading sold comps…